
Author corrections, January 2024: After publication the authors identified that there was an error in the original values used in the February 2023 version of this article for Table 1 and Figure 2. These data and related text have been corrected.
Introduction
Speed is a major contributing factor to death and serious injuries from road crashes internationally (OECD / International Transport Forum, 2018), including in New Zealand (International Transport Forum, 2020b; Job & Brodie, 2022). Higher speeds increase the risk of a crash occurring and the severity of injury as a result of a crash (OECD / International Transport Forum, 2018).
The primary purpose of speed management is to ensure that speed limits are set at levels that are safe for all road users thereby reducing the number of crashes and avoiding injuries and death if crashes happen (Aldred et al., 2018; Cairns et al., 2014). Lowering speed limits can also generate co-benefits such as a shift to active transport modes, improved traffic flow, reduced traffic speed and volume, improved perceptions of road safety, reduced noise and air pollution, and contribute to mitigating road transport emissions (Cairns et al., 2014; Rossi et al., 2020). Ultimately these benefits can improve quality of life and livability, particularly in urban areas (OECD / International Transport Forum, 2018), and have significant implications on public health (Elvik, 2012).
The OECD / International Transport Forum research report Speed and Crash Risk (2018) recommends setting speed limits according to Safe System principles which take into account the road function and use and the forces that the human body can tolerate if hit by a vehicle. According to the Safe System principles, 30 km/h is “a reasonable speed limit in built up areas where there is a mix of vulnerable road users and motor vehicle traffic” (OECD / International Transport Forum, 2018). In 2018, most countries in the International Traffic Safety Data and Analysis Group (IRTAD) had a default speed limit in urban areas of 50 km/h, often had lower speed limits (ranging from 20 km/h to 40 km/h) in residential areas and around schools, and were undertaking regular communication campaigns to promote lower speeds and better compliance with the speed limits (OECD / International Transport Forum, 2018). Many countries showed a trend for implementing 30 km/h zones in city centres and residential areas and some also considered setting a default speed limit of 30 km/h in urban areas with possible higher speed limits on arterial roads (OECD / International Transport Forum, 2018; Scottish Borders Council, 2021; The Guardian, 2022).
In New Zealand, the general speed limit is 50 km/h on urban roads and 100 km/h on rural roads and motorways (International Transport Forum, 2020b). The number of deaths from road crashes in New Zealand decreased between 2000 and 2013 but has continued to rise since 2013 (International Transport Forum, 2020b; Walton et al., 2020). In 2019, New Zealand had 7.1 deaths from road crashes per 100,000 inhabitants compared to 4.7 in Australia and 2.0 in Norway (International Transport Forum, 2020a). According to police reports, speeding was a contributing factor in 26% of deaths from road crashes in New Zealand (78 out of 300 fatal crashes), 403 serious crashes and 1,450 minor injury crashes (International Transport Forum, 2020b). Extensive research has been conducted on travel speed and the risk of crashes and serious injuries (Doecke et al., 2021; Kloeden et al., 1997, 2001, 2002; Kloeden & McLean, 1998). Using combined evidence from different sources to account for under-reporting of speed as a factor in road crashes, Job and Brodie (2022) estimated that speeding was involved in approximately 60% of fatal road crashes in New Zealand and speeds above New Zealand’s limits for Safe and Appropriate Speeds were present in approximately 71% of injury crashes.
In response to an increasing number of deaths from road crashes, the New Zealand Government published a new road safety strategy for 2020-30, the Road to Zero, with a vision of New Zealand where no one is killed or seriously injuried in road crashes, and with a target to reduce annual deaths and serious injuries by 40% by 2030 (New Zealand Government, 2019).
In 2022, the New Zealand Government introduced the Land Transport Rule: Setting of Speed Limits 2022 (the Rule) (New Zealand Government, 2022) and guidance (Waka Kotahi New Zealand Transport Agency, 2022). Under the Rule, road controlling authorities (which include city and district councils in New Zealand) may set a speed limit for a road or area under its control. The Rule also requires lowering of speed limits around schools generally to 30 km/h (at least 40% of the schools by June 2024 and all schools by the end of 2027). According to the Rule, speed limit changes can be made independently of infrastructure changes followed by monitoring and evaluation to identify if speed management/traffic calming interventions are needed to further reduce traffic operating speeds.
In a recent survey, most New Zealanders understood that travelling at higher speeds increases the chance of having a crash (88%) and the severity of injuries if a crash occurred (97%) and 44% thought that no deaths from road crashes were acceptable (Waka Kotahi New Zealand Transport Agency, 2020b). According to the same report, 82% of New Zealanders believed that speed limits in urban areas should be left as is and only 12% believed that speed limit should be lowered (Waka Kotahi New Zealand Transport Agency, 2020b). In addition, 58% supported and 22% opposed 30 km/h speed limit in urban centres and 68% supported lowering speed limits up to 30 km/h around schools (Waka Kotahi New Zealand Transport Agency, 2020b).
This study presents a technical analysis conducted by Wellington City Council (Wellington, New Zealand) to assess nine options for speed management considering different approaches to safe speeds around schools, safe speeds citywide and the timing of their implementation using cost benefit analysis. The goal was to explore the best approach to speed management for Wellington City and inform subsequent council decisions aligning it with the priority of providing a safe, resilient and reliable network of transport infrastructure that supports active and public transport choices and to comply with the new Rule (New Zealand Government, 2022).
Methods
Setting
Wellington is the capital city of New Zealand with a population of 202,727 (Stats NZ, 2018), highest GDP per capita in the country (NZD $124,000 GDP per capita (Ministry of Business, Innovation and Employment, 2020) and 700 km of roads (including 641 km of urban roads). Wellington city’s transport network is complex and has a strategic importance by providing access to a regional port, hospital and airport and the largest regional commercial centre. The city has 81 schools, most of which will require speed limit reduction to comply with the new Rule. During the 2012-2021 period, 3,992 injuries (31 fatalities; 650 serious injuries; 32% involving pedestrians or cyclists) were reported from crashes on Wellington city’s urban street network (including the State Highway). Wellington City Council uses speed management as a key means of reducing harm on its roads: 50 km/h default urban speed limit; safer speed zones (30 km/h) in most town centres, and 30 km/h on most central city streets. Nevertheless, according to an assessment of infrastructure risk rating (Waka Kotahi New Zealand Transport Agency, 2020a), approximately 80% of Wellington city’s streets had speed limits that did not align with the safe and appropriate speed calculated for the street, and 98% of those streets required a speed reduction.
Optioneering
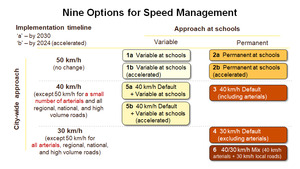
Technical work examined nine options for speed management (Figure 1). The options described in detail in Appendix 1 varied based on their approach to safe speeds around schools (permanent or variable) and across the city (30 km/h, 40 km/h, or 50 km/h default) as well as the implementation timing (by 2024 (accelerated) or by 2030). Options with variable speed limits around schools considered a 30 km/h speed limit between 8:30am and 9:00am and 3:00pm and 3:30pm on non-holiday weekdays. The assessment of options was conducted in 2021.

The options were assessed using a cost benefit analysis. Cost benefit analysis is a systematic approach to account for all of the effects (costs, benefits, and disbenefits) of an intervention together. In the context of road safety, use of a cost benefit analysis approach allows decision-makers to understand the relative attractiveness of alternative approaches to speed management (Frith, 2012). Speed management has multiple benefits (including crash savings, mode shift towards active transport, improved air quality, reduced noise, etc.) and disbenefits (such as increased travel time and increased vehicle fuel consumption at lower speeds). This cost benefit analysis included detailed cost estimation and only quantified and monetised travel time and crash savings.
Modelling of vehicle travel time disbenefits. This modelling was performed using a mesoscopic traffic model in AIMSUN (Advanced Interactive Microscopic Simulator for Urban and Non-Urban Networks; https://www.aimsun.com/). The speed limits of roads were changed based on the scenario being modelled and the effect of speed reduction was observed on total travel times. The model consisted of three peaks (morning peak: 6am-10am; inter-peak: 10am-2pm; afternoon peak: 3pm-7pm). An off-peak model was created (calculated as half of the morning peak traffic volume for a duration of 4 hours) to assess the impact of speed reduction, as speed limit reductions are likely to have a higher impact on travel times when traffic volumes are lower. The off-peak model represented traffic conditions during night-time, when the road traffic can travel at the speed limit of the road, if the road environment allows.
The modelling did not assume any change in vehicle travel patterns (traffic volume or trip distribution) or mode shift as a result of the speed limit changes.
The base scenario modelled the speed limits of the road as the current speed limit (i.e., 50 km/h for most urban streets; Figure 1). The scenarios for 40 km/h default (with exceptions) and 30 km/h default (with exceptions) modified the speed of selected links in the model accordingly (Figure 1). Option 6 (40/30 km/h mix) was not directly modelled as it was added as an option after the modelling phase (Figure 1). The travel time disbenefits for Option 6 were assumed to be halfway between 40 km/h default and 30 km/h default.
The 40 km/h default speed limit and 30 km/h default speed limit estimated to increase morning peak travel time by approximately 5% and 6%, respectively. Projected increase in travel time around schools was estimated by scaling the citywide impacts according to the proportion of the network around schools (calculated as an average of 600 metres of slow speed streets around each of 81 schools - a total of 48.6 km (7%) of the city’s street network). Modelling assumed the speed limit reduction in the treatment areas without any other substantial changes (such as traffic calming measures and increased enforcement) that may increase compliance with the speed limit. AIMSUN employs detailed modelling of the behaviour of individual vehicles assuming that driver behaviour is dependent on local conditions, such as speed limits, road type, traffic volumes, and differences in safe stopping distances and maximum speeds across vehicle types (AIMSUN, n.d.). For the options with variable speed limits outside schools, travel time disbenefits were assumed to occur during half the period of the morning and afternoon peak periods (2 hours each). A composite value of time for each time period was modelled using value of time by trip purpose (derived from Monetised Benefits and Costs Manual (Waka Kotahi New Zealand Transport Agency, 2021)) and the proportion of trips by purpose (‘commuting’, ‘work’ and ‘other purpose’; based on New Zealand Household Travel Survey data 2015-2017 for Wellington City).
Safety impact assessment. Crashes were identified through Waka Kotahi Crash Analysis System (CAS) for the 2015-2019 period (Waka Kotahi New Zealand Transport Agency, n.d.). A 5-year period was used instead of a 10-year period to estimate a baseline crash level that took into account road safety improvements that occurred in Wellington city between 2010 to 2014 (including 30 km/h zones introduced in town centres). A crash analysis was completed using the Monetised Benefits and Cost Manual, method A: crash by crash analysis (Waka Kotahi New Zealand Transport Agency, 2021). The crash modification factors used to estimate crash reduction benefits after implementation of interventions were based on previous evidence (Islam & El-Basyouny, 2015; Let’s Get Wellington Moving, 2019). The crash modification factors for speed limit reduction from 50 km/h to 40 km were 0.81, 0.50 and 0.90 for central, higher benefits and lower benefits scenarios, respectively and for a speed limit reduction from 50 km/h to 30 km/h were 0.62, 0.50 and 0.81 for central, higher benefits and lower benefits scenarios, respectively. The central scenario is a mid-point case for economic analysis. Sensitivity tests were conducted using crash modification factors for higher and lower benefits scenarios. Other key parameters used for crash estimation included fatal to serious injury ratio for central case and lower benefits scenarios (0.03; Wellington city specific ratio) and fatal to serious injury ratio for higher benefits scenario (0.07). In addition, to adjust for under-reporting, reported serious and minor crash numbers were multiplied by serious crash under-reporting factor (1.50) and minor crash under-reporting factor (2.75), respectively (Waka Kotahi New Zealand Transport Agency, 2021). Social costs of injuries were calculated for each injury in a crash using the social cost based on injury severity (fatal, serious or minor injury) (Ministry of Transport, 2021). Total predicted crash reductions were calculated as a product of the effectiveness of the intervention at reducing injury crashes (the crash modification factor) and the number of crashes in the intervention area.
Cost estimation. Costs included signage, traffic calming devices, implementation costs, and annual maintenance costs. A range of signs were considered depending on the type and location of the speed zone. Traffic calming devices included small threshold treatment, large threshold treatment, threshold treatment with traffic calming, school zone raised pedestrian crossing/threshold treatment, and localised traffic calming. The number of sites where the speed limit would change under each option was determined by intersecting road segments using ArcGIS Pro (Esri, www.esri.com/en-us/home) to determine sites which required replacement or new speed signs. The type of sign and threshold treatment requirements at each site were determined by analysing the speed limit change and the mean operating speed at the boundary. The implementation costs included communication, consultation and engagement, project management, and contingency. Annual maintenance cost included sign replacement 10 years after installation, and annual threshold maintenance at 2% of installation cost for all installed treatments.
Cost benefit analysis. The cost benefit analysis used a 4% discount rate over 40 years and an annualisation factor of 245 corresponding to working days per year. The analysis also used occupancy rates of 1.2 people per vehicle and 15 people per bus. These were determined from local sources (Wellington City Council Cordon Surveys and Greater Wellington Regional Council data, respectively).
Results
Details of the cost benefit analysis for the nine options are presented in Table 1. Cost estimations for signage, traffic calming, construction, maintenance as well as total cost for each option are presented in Table 2.
Results of the cost benefit analysis (summarised in Figure 2) showed that citywide, permanent speed reduction would be most effective for reducing road crash-related injuries. The option with most crash reduction benefits (Option 6) had speed limits of 30 km/h for local streets and 40 km/h for arterials, with substantial crash reduction benefits (over $250 million, discounted over 40 years). However, this option had high total cost ($44.8 million) and relatively high travel time disbenefits.

Option 4 (30 km/h default) provided the second highest crash reduction benefits but also at a high cost ($44.8 million) and with high travel time disbenefits.
Options 2a and 2b with permanent speed limit reduction at schools (total cost: $12.7 million and $13.0 million, respectively) were the options with the highest value for money but had lower total benefits compared to options 3, 4, 5a, 5b, and 6.
Option 3 (40 km/h default) had the lowest BCR of all options and provided very low value for money under the central scenario. The major difference in crash reductions of Option 3 and Option 4 was the proportion of network covered by the speed limit change: Option 4 (30 km/h default) excluded most arterial streets (i.e., most arterials remained at 50 km/h), resulting in lower coverage of the city than Option 3 (40 km/h) which reduced the traffic speed limit on most arterials to 40 km/h and impacted 71% of the city’s crash locations.
Options 5a and 5b with a 40 km/h default with variable speed at schools (total cost: $32.4 million and $32.7 million, respectively) provided high benefits but had a very low value for money.
Options 1a and 1b with variable speed limits at schools (total cost: $22.0 million and $22.4 million, respectively) were the worst performing options in terms of safety outcomes. Not only were the costs of variable speed limit signs high, but the safety benefits were low as there were relatively few crashes in the vicinity of schools during the school drop-off and pick-up periods.
Incremental cost benefit calculations indicated that the most efficient options were Options 2a and 2b (permanent speed reduction at schools).
Discussion
The results of the cost benefit analysis showed that options with citywide, permanent speed reduction (options 3, 4, 5a, 5b and 6) were most effective for reducing road crash-related injuries, especially if speed limits were reduced on arterial streets. Most options had significant crash reduction benefits and these benefits were offset by increased travel times. However, these safety benefits were outweighed by increased travel times for seven of the nine options.
In this analysis, options with citywide, permanent speed limit reduction were most effective for reducing road crash-related injuries. Area-wide speed management approaches are necessary to support active transport to schools and other destinations and would also benefit a diversity of users. To encourage walking, cycling and scooting to and from schools and other destinations, street environments need to consistently support those modes not only at destinations but also in the neighbourhoods and along the routes that provide access to those destinations (Pocock et al., 2019; Rahman et al., 2020). Therefore, changing the speed limits just outside of school gates is unlikely to encourage active transport because such an approach neither addresses the traffic-related safety concerns along the school route nor achieves significant safety benefits (due to relatively few crashes occurring in the vicinity of schools during the school drop-off and pick-up periods, as shown in the current analysis). For high school students, a reasonable walking distance to school ranges between 1.4 km and 3 km whereas a reasonable cycling distance ranges from 4 km to 8 km (for example, Nelson et al., 2008; Pocock et al., 2019; Van Dyck et al., 2010). Shorter distances were reported for primary school children (for example, Duncan et al., 2016). Analysis performed as part of this study showed that combined school walking catchment areas for primary and intermediate schools using a 1 km buffer and secondary schools using a 2.25 km buffer based on New Zealand research (Duncan et al., 2016; Pocock et al., 2019) covered approximately 80% of the Wellington city’s urban street network. Therefore, to achieve safety benefits and be effective in encouraging active transport to schools and other destinations, it is essential to take the whole-of-network approach to speed management in urban areas and permanent speed limit reduction around schools, taking into account school walking (and ideally also cycling) catchment distances.
One of the major concerns related to speed limit reduction is increase in travel time for vehicles. This analysis estimated that options with citywide default speed limits of 40 km/h (with exceptions) and 30 km/h (with exceptions) would increase morning peak travel time by approximately 5% and 6%, respectively. In Wellington city, that translates into an average increase in road vehicle travel time of approximately 26-39 seconds per trip during morning peak (calculated using current average vehicle speed of 35.5-37.4 km/h and average trip distance of 5.3-6.4 km based on AIMSUN model). In the modelling work, the effects of lower speeds on travel times were heterogeneous across the city. Slower speed limits actually reduced travel times on busy sections of the network with high traffic signal density by moderating arrivals and reducing queuing at traffic signals. Slower speeds slightly increased travel times in areas of the network with less congestion and fewer traffic signals, where speed limits have a larger effect on journey times. This work also contributes to understanding the relative benefits and disbenefits of default urban speed limits of 30 km/h, 40 km/h or a 30/40 km/h mix in one city. Lowering the default speed limit to 30 km/h or 40 km/h in urban areas represents an important contribution to a wider policy context to make streets safer, healthier and more liveable and should be considered when planning speed management approaches. However, travel time disbenefits were larger than projected safety benefits for options with reduced citywide default urban speed limits. This may suggest that 30km/h or 40 km/h default speed limits are interventions that may not be economically justified based on safety benefits alone, but may be justified when wider health, liveability, and mode shift benefits are taken into account.
Change in speed limits is often a subject of intense social and political debate with most discussions in urban areas focusing on lowering speed limits (OECD / International Transport Forum, 2018). Any speed limit decision is likely to be controversial and regarded by many drivers as either too high or too low partly because of the conflicting nature of speed limit objectives (road safety objectives are best met with slower speeds whereas reduced travel time is achieved by higher speeds) and differences in drivers’ opinions about optimal speed limits (Elvik, 2012). Recent New Zealand research found that although approximately two-thirds of New Zealanders supported speed limits of up to 30 km/h around schools and over half supported 30 km/h in urban centres, the majority (82%) believed that speed limits in urban areas should remain unchanged (Waka Kotahi New Zealand Transport Agency, 2020b). Nonetheless, the reduction of speed limits on New Zealand roads is necessary to improve road safety, encourage active transport and improve liveability in urban areas. Efforts to reduce speed limits on New Zealand roads will require balancing of road safety and mobility aspects and consideration of synergies with other areas such as environmental benefits, response to climate change, public health benefits derived from increasing active and public transport, and liveability (Elvik, 2012; OECD / International Transport Forum, 2018).
Study Limitations
This cost benefit analysis did not assume any change in vehicle travel patterns (traffic volume or trip distribution across time periods) due to the speed limit changes. Since urban speed limit changes are typically designed to help encourage more walking and cycling, it is reasonable to assume that the changes would result in an increase in number of walking and cycling trips and a reduction in driving for shorter trips. However, the magnitude of this mode shift is difficult to quantify and therefore it was excluded from the analysis. Because mode shift would produce travel time benefits which would reduce travel time disbenefits from lower average traffic speeds, this economic assessment likely over-estimates the travel time disbenefits associated with speed limit changes. In addition, this cost benefit analysis did not quantify or monetise noise and air pollution reduction benefits, which could also be substantial (Lopez-Aparicio et al., 2020) and may vary across assessed options. Finally, this study was conducted before the release of the updated Rule (New Zealand Government, 2022) which resulted in one of the assessed options (3) and implementation timing for three options (1b, 2b and 5b) not fully complying with aspects of the updated Rule. Nevertheless, this study shows the advantages of the citywide approach to speed management for safety benefits although those benefits were outweighed by increased travel times resulting in negative BCRs. To gain a comprehensive view of the relative cost and benefits of alternative approaches to speed management, it may be necessary to quantify a wider set of benefits, such as wider benefits of speed limit changes on population health, liveability, and mode shift.
Conclusions
Setting safe and appropriate speed limits as part of speed management should be considered within a wider policy context to make streets safer, healthier and more liveable, although such changes may be accompanied by relatively high travel time disbenefits. Lowering the default speed limit to 30 km/h in most urban areas and considering school walking catchments when planning speed limits represent important contributions to that goal and should be considered when planning speed management approaches. Strategies to reduce speed limits will require balancing of road safety and mobility aspects and consideration of synergies with other areas such as environmental benefits, response to climate change, public health benefits and liveability.
Acknowledgements
The authors would like to thank Rebecca McMorran, Annie Bruckner, Amy Hobbs and many other Wellington City Council officers who contributed their expertise to this work and Chris Blackmore from Abley for his assistance with the cost benefit analysis. Disclaimer: The views expressed in this report are the authors’ and are not necessarily official Wellington City Council policy positions.
Author Contributions
All authors contributed to the conception, design, analyses, and interpretation of results. Sandra Mandic drafted the article. Joe Hewitt, Nadine Dodge and Neha Sharma revised the article for intellectual contents.
All authors have read and agreed to the published version of the article.
Funding
This work was supported by internal funding from the Wellington City Council (Wellington, New Zealand). The funder did not have the role in the study design, analysis and interpretation of data, or writing of the paper.
Human Research Ethics Review
This study did not require Human Research Ethics Review.
Conflicts of interest
Sandra Mandic is the founder and the director of the research consultancy AGILE Research Ltd. (www.agileresearch.nz; Wellington, New Zealand) and Adjunct Professor at Auckland University of Technology (Auckland, New Zealand). Other authors declare that there is no conflict of interest.
Data Availability Statement
Due to commercial sensitivity, data used for this work will not be shared.
Article History
This peer-reviewed paper was first submitted as an Extended Abstract and an Oral Presentation was recommended by two reviewers at the 2022 Australasian Road Safety Conference (ARSC2022) held in Christchurch, New Zealand, 28-30 September 2022. The two reviewers also recommended that the Extended Abstract be expanded into a ‘Full Paper’ and undergo further peer-review as a journal submission by three independent experts in the field. The Extended Abstract is published in the ARSC2022 Proceedings. This ‘Full Paper’ version is being reproduced here with the kind permission of the authors and will only be available in this edition of the JRS.
Received: 14/08/2022; Received in revised form: 09/09/2022; Accepted: 13/01/2023; Available online: 08/02/2023