Glossary
STU State Transport Undertakings
CIRT Central Institute of Road Transport
MoRTH Ministry of Road Transport and Highways
DTC Delhi Transport Corporation
BMTC Bengaluru Metropolitan Transport Corporation
BEST Brihanmumbai Electricity Supply and Transport
WHO World Health Organisation
OECD Organisation for Economic Cooperation and Development
ESRI Environmental Systems Research Institute
KDE Kernel Density Estimation
Introduction
Road traffic crashes are one of the leading causes of deaths in the world. However, road traffic crashes and injuries from bus transportation represent a relatively small proportion of fatal crashes (Truong & Currie, 2019). Buses are typically about 1 percent or less of the total vehicle population and public transport buses constitute an even smaller proportion (Cafiso et al., 2012). The total number of crash fatalities involving buses are comparatively low compared to other modes of transport (Litman, 2012). Even the WHO (2018) Global Status Report on Road Safety does not mention the safety records of buses including public transport buses. Due to this, few studies examine road traffic crashes involving buses. However, the injury severity caused by a collision with a bus is severe and given the high number of crashes involving buses in developing countries (Barua & Tay, 2010), this is a topic that requires greater attention.
Public transport and road safety
Public transport is considered the safest mode of travel for most people across the globe. Studies have shown that the risk of fatality due to a traffic crash is eight times more while travelling by a car than travelling in a bus, while the same risk is increased up to 50 times when walking (Sam et al., 2018). However, crash data may not directly report the involvement of buses, even if a crash may have occurred due to lane changing or high speed of a bus. For example, direct or indirect involvement of buses are reported in 3.6 percent of traffic injury crashes by police (Brenac & Clabaux, 2005).
Public bus operations, already considered to be low revenue generating services, are burdened further when their road crash records are poor. Safety is crucial issue regarding transit buses from the perspectives of operators and passengers. Therefore, understanding bus safety risk is critical in bus based public transport services. Currently bus safety assessment is based only on statistics of crash rate and fatalities. A deeper understanding of the pattern of occurrence of bus crashes will help to identify the black spots and unsafe road sections and this can help to adopt the required road safety measures to improve bus safety.
In India, buses are a commonly used mode of public transport especially in cities with population of a million plus and mega cities of more than 10 million people. Census of India in 2011 showed that 22 percent of India’s workforce commutes daily using a bus (Singh & Tiwari, 2018). However, the number of buses as a proportion of the total vehicle fleet is on a continuous decline from 11 percent in 1951 to less than 1 percent in 2011 (Transport Research Wing, Ministry of Road Transport & Highways, 2017–2018). Yet, Ministry of Road Transport and Highways (MoRTH) crash records suggest that buses are involved in 5-10 percent of the total crashes and fatal road traffic crashes in India. These shares are higher than the European or Western counterparts of the world, where buses are involved in around 1 percent of total crashes (Cafiso et al., 2012). Understanding bus safety risk is critical and identification of black spots and unsafe road sections can help to adopt the required road safety measures to improve public transport safety.
Methods
To understand the road safety scenario of buses in urban India, some of the corporations operating in major metropolitan cities with crash data available for the select years were considered in this study. The State Road Transport Undertakings (STU) are responsible for running buses in different cities in India. In a few cities, buses are run by private companies as well. The Association of State Road Transport Undertakings (ASRTU) is the apex coordinating body formed in 1965 by the Ministry of Road Transport and Highways Government of India (www.asrtu.org). ASRTU brings together all the STUs to a common platform with the aim of pooling their resources and helping them to improve their performance as a public transit organisation. Data from all the 70 STU members regarding their bus operations, road safety, financials, etc, are collected each year by an organisation called Central Institute of Road Transport (CIRT) in Pune, India (www.cirtindia.com). It is an Institute established by Central Government of India in 1967 under the MoRTH for capacity building of STU officers. CIRT has a special department called Data Bank (2019) which publishes an annual statistics book report, which is available for purchase for a nominal fee.
The crash data for the top five populated cities in India were included in this study to understand which urban public transit organisation is not performing well in terms of road safety. Crash data for the years 2010 to 2017 were collated from the annual statistics reports of STU published by CIRT, Pune. This period of seven years was considered because complete continuous crash data were available for all the transit organisations considered. Since the data are publicly available, ethics approval was not required.
After examining the total crashes and fatalities over a period of seven years, a case city, Delhi, was identified for detailed investigation of bus crashes because it had the highest proportion of fatal crashes of total crashes. Delhi’s bus transport system is operated by two organisations, namely, Delhi Transport Corporation (DTC) and Delhi Integrated Multi-Modal Transit System Limited (DIMTS). DTC has a greater number of buses (4,549 fleet of urban buses) and caters for more passengers than DIMTS. DTC operates on 673 bus routes which cover the area of Delhi and few neighbouring rural counterparts. Crash data for DTC buses for a five-year period 2015-2019 were available from the Traffic Safety Cell of DTC based in Delhi. These data were requested by the author as a PhD Scholar and were provided by the Head (General Manager) of Traffic Safety Cell of DTC. This dataset included total crashes involving DTC buses by bus route number, origin and destination of the bus, crash severity, date, location and injured person type (pedestrians, cyclists, two-wheelers, car occupants, bus passengers), but no personal information was included. For the 2019 data only, temporal variation of total bus crashes and fatal bus crashes and that by age of drivers were available.
Bus crash locations from 2015-2019 from the DTC data were identified and marked on the road network map using Arc GIS platform. Spatial analysis helps to analyse the pattern of occurrence of crashes over an area (Fotheringham et al., 2000). As explained by Ma and colleagues (2021) an advantage of using GIS analysis is it helps to determine areas of crashes spatially, extract the spatial distribution of traffic crashes and the spatial relationship from multiple angles which cannot be achieved by simple statistical analysis. GIS visual characteristics also helps to provide a more visual and intuitive understanding of the distribution of crashes which helps to understand the traffic safety scenario in the region.
Kernel Density Estimation (KDE) technique was used to understand crash locations along the public transport routes and the corresponding land uses and its effects on occurrence of crashes. KDE is a classic approach to spatial point pattern analysis that identifies the ‘hotspots’ of point events (Diggle, 1985) and has been used to analyse traffic crashes spatially and temporally (Blazquez & Celis, 2013) to identify crash hotspots in cities (de Andrade et al., 2014; Le & Liu, 2020). It detects hotspots using a series of estimations which are made over a grid placed on the entire point pattern. This involves calculating counts, mean, median and standard deviation. Each of these estimations show the intensity of crashes at a certain location. Higher (or lower) the value, the more intense the clustering. KDE analysis was performed on all crash outcome categories (fatal, major, minor) of DTC bus crash locations.
Results
.jpeg)
Table 1 shows the number of total crashes involving urban bus services in the top five populated cities in India. Chennai city reported the highest number of total crashes while cities of Delhi and Kolkata reported the fewest crashes. However, in terms of the proportion of fatalities out of total crashes involving public transport buses, the largest percentage was reported for Delhi. The city is heavily dependent on its bus transport system which covers around 11 percent of Delhi’s vehicle kilometres, 54 percent of total passenger kilometre (PKM) demand, and 76 percent of the total public transport PKM demand (Suman et al., 2017).
Table 2 shows the annual road traffic crashes that occurred in DTC buses in Delhi. Over the years, the total crashes in Delhi were in general on a decline but the percentage of fatal crashes and crashes per 100,000 kilometres remained high or hardly changed.
The equation below is the density estimation function as given by (Silverman, 1986):
f(x)=1nh ∑ n K(x−xi )/h
Where stands for the value of the variable x at location i, n signifies the total number of locations, h denotes the bandwidth or smoothing parameter, K represents the kernel density function.
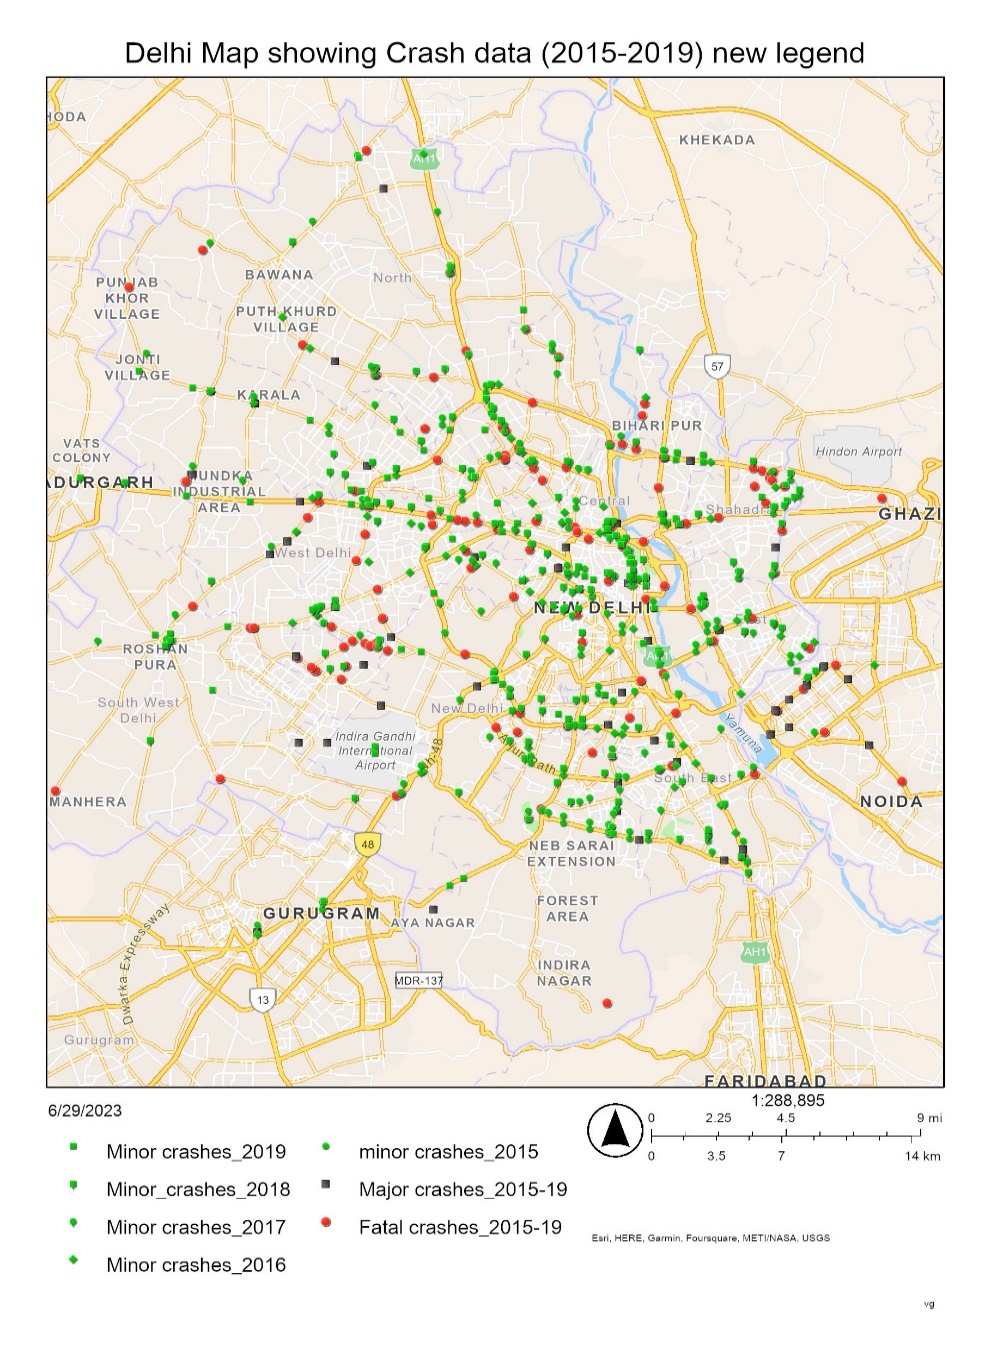
According to (Hashimoto et al., 2016), different kernel functions do not affect the results significantly but the bandwidth significantly affects the results. No impeccable measure exists for determining the bandwidth. The different band widths that can be considered are 500m or 1000m. In the current analysis, the bandwidth considered was 500m. Figure 1 presents spatial patterns of all crash types (e.g., vehicle-pedestrian, vehicle-vehicle, and single-vehicle crash) by severity (fatal, major, minor) in Delhi for a period of five years (2015–2019).
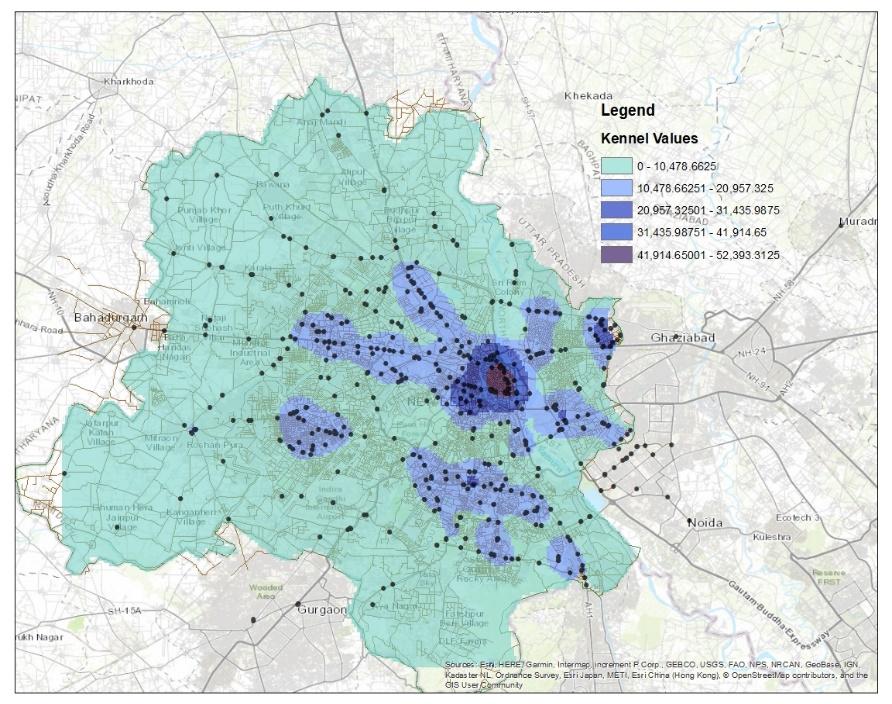
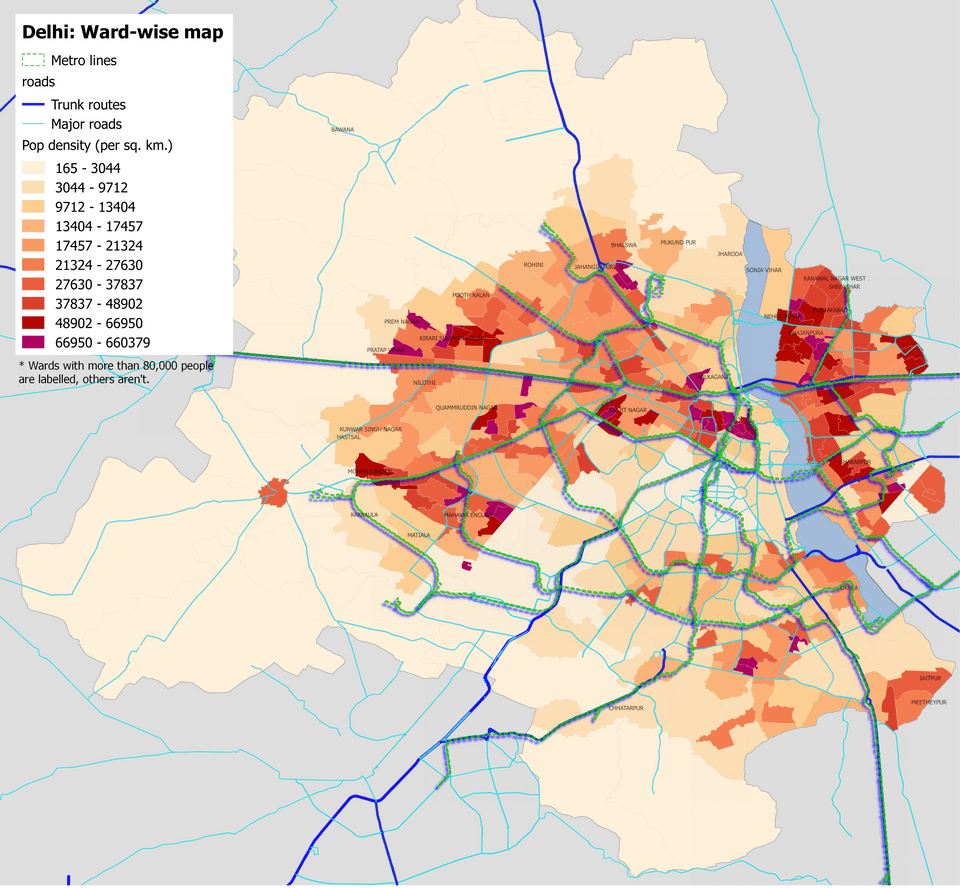
Figure 2 shows the crash-prone locations identified for DTC bus crashes in the city of Delhi using KDE method. Higher Kernel values imply more intense clusters. They show that parts of central and east Delhi are the biggest fatal crash hotspot locations. Of the total of 145 fatality crashes, 31 occurred in east Delhi (21%) and 16 in central north Delhi (11%). As shown in Figure 3, these hotspots are where urban functions and population are concentrated. The crash data analysis further identified that 44 DTC bus routes were overrepresented. Crashes on these routes included almost half (47%) of total crashes involving pedestrians and passengers and another quarter of the crashes involving two-wheelers. Of these, 14 bus routes are in the east Delhi region comprising a third of all fatal crashes (32%).

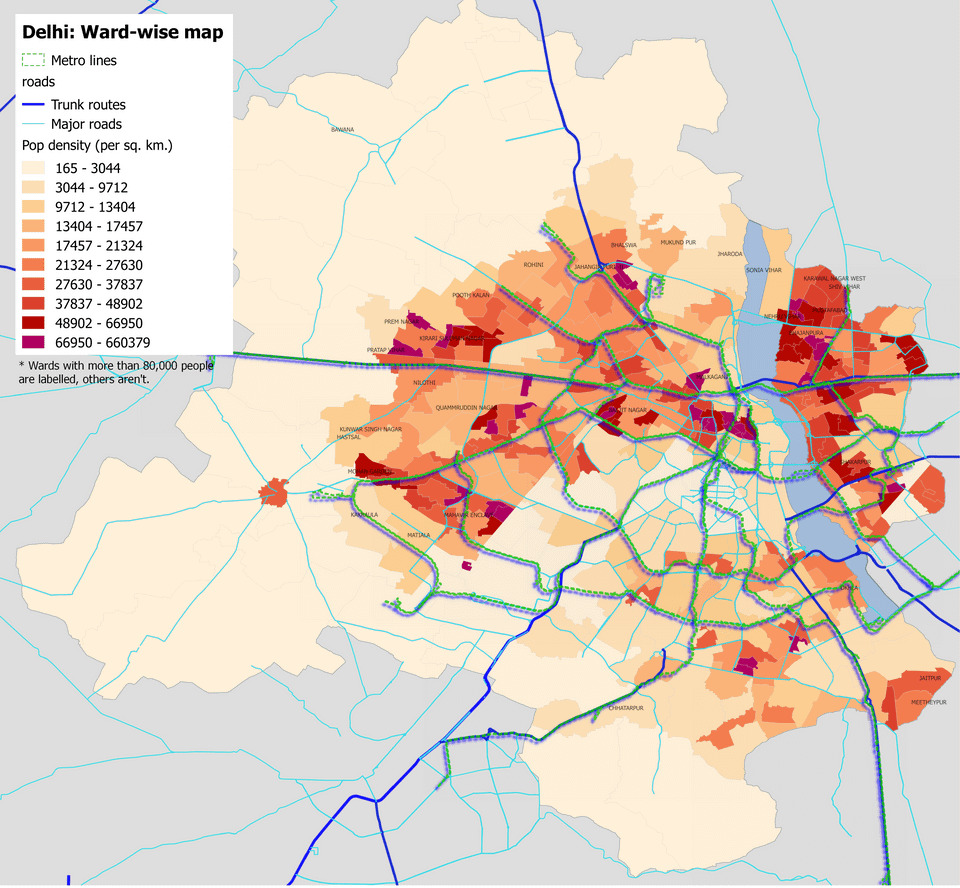
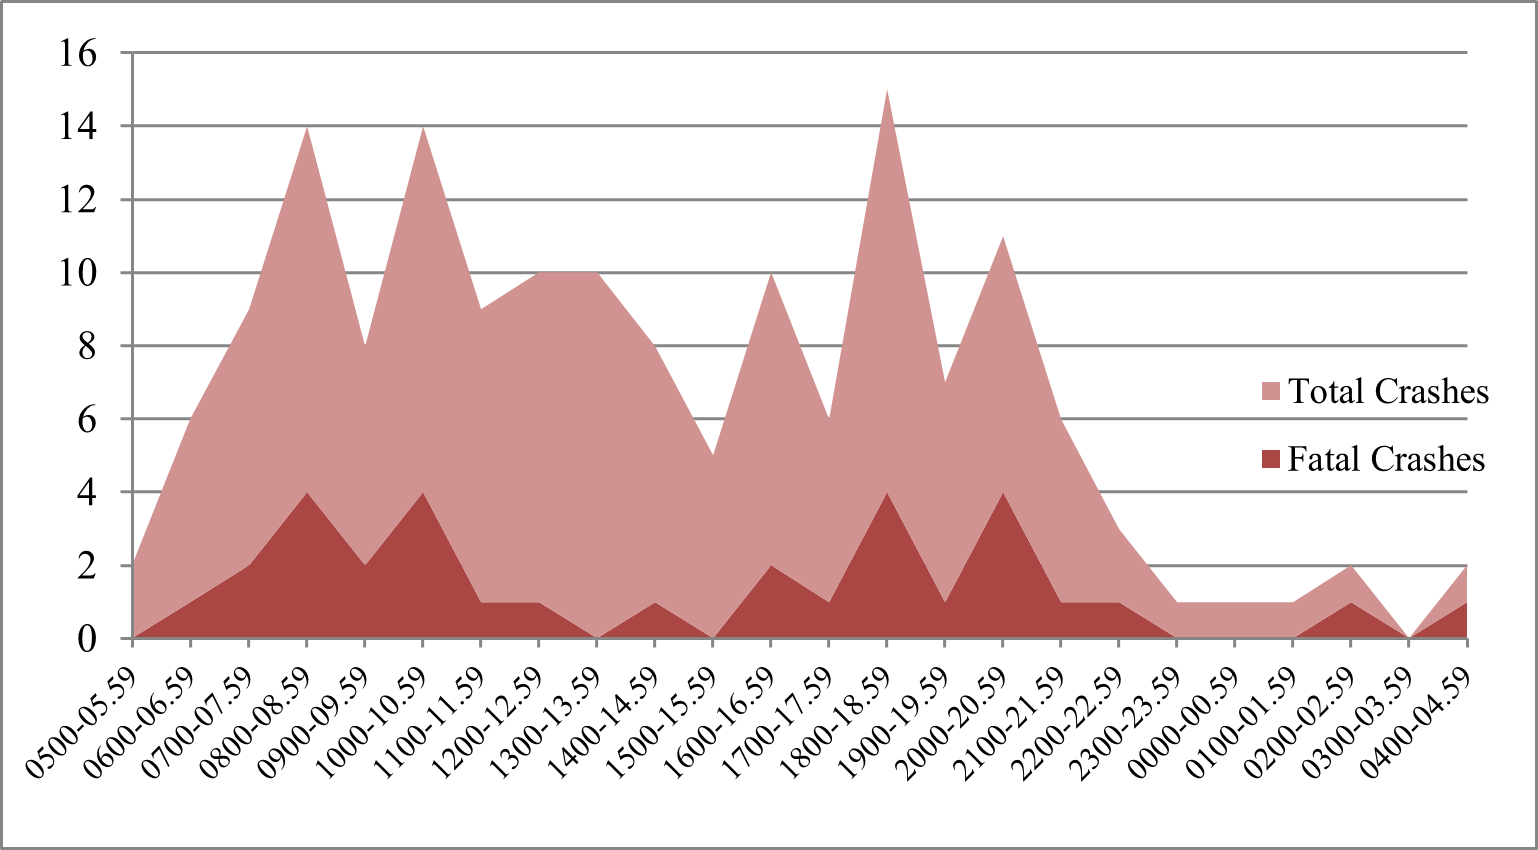
Figure 4 depicts total and fatal crashes by time of the day using 2019 data. They follow a similar trend where the spikes occur during peak commuting hours in the morning and evening. Spikes in crashes/fatal crashes during non-peak hours in a day may be due to increase in vehicle speeds without traffic.

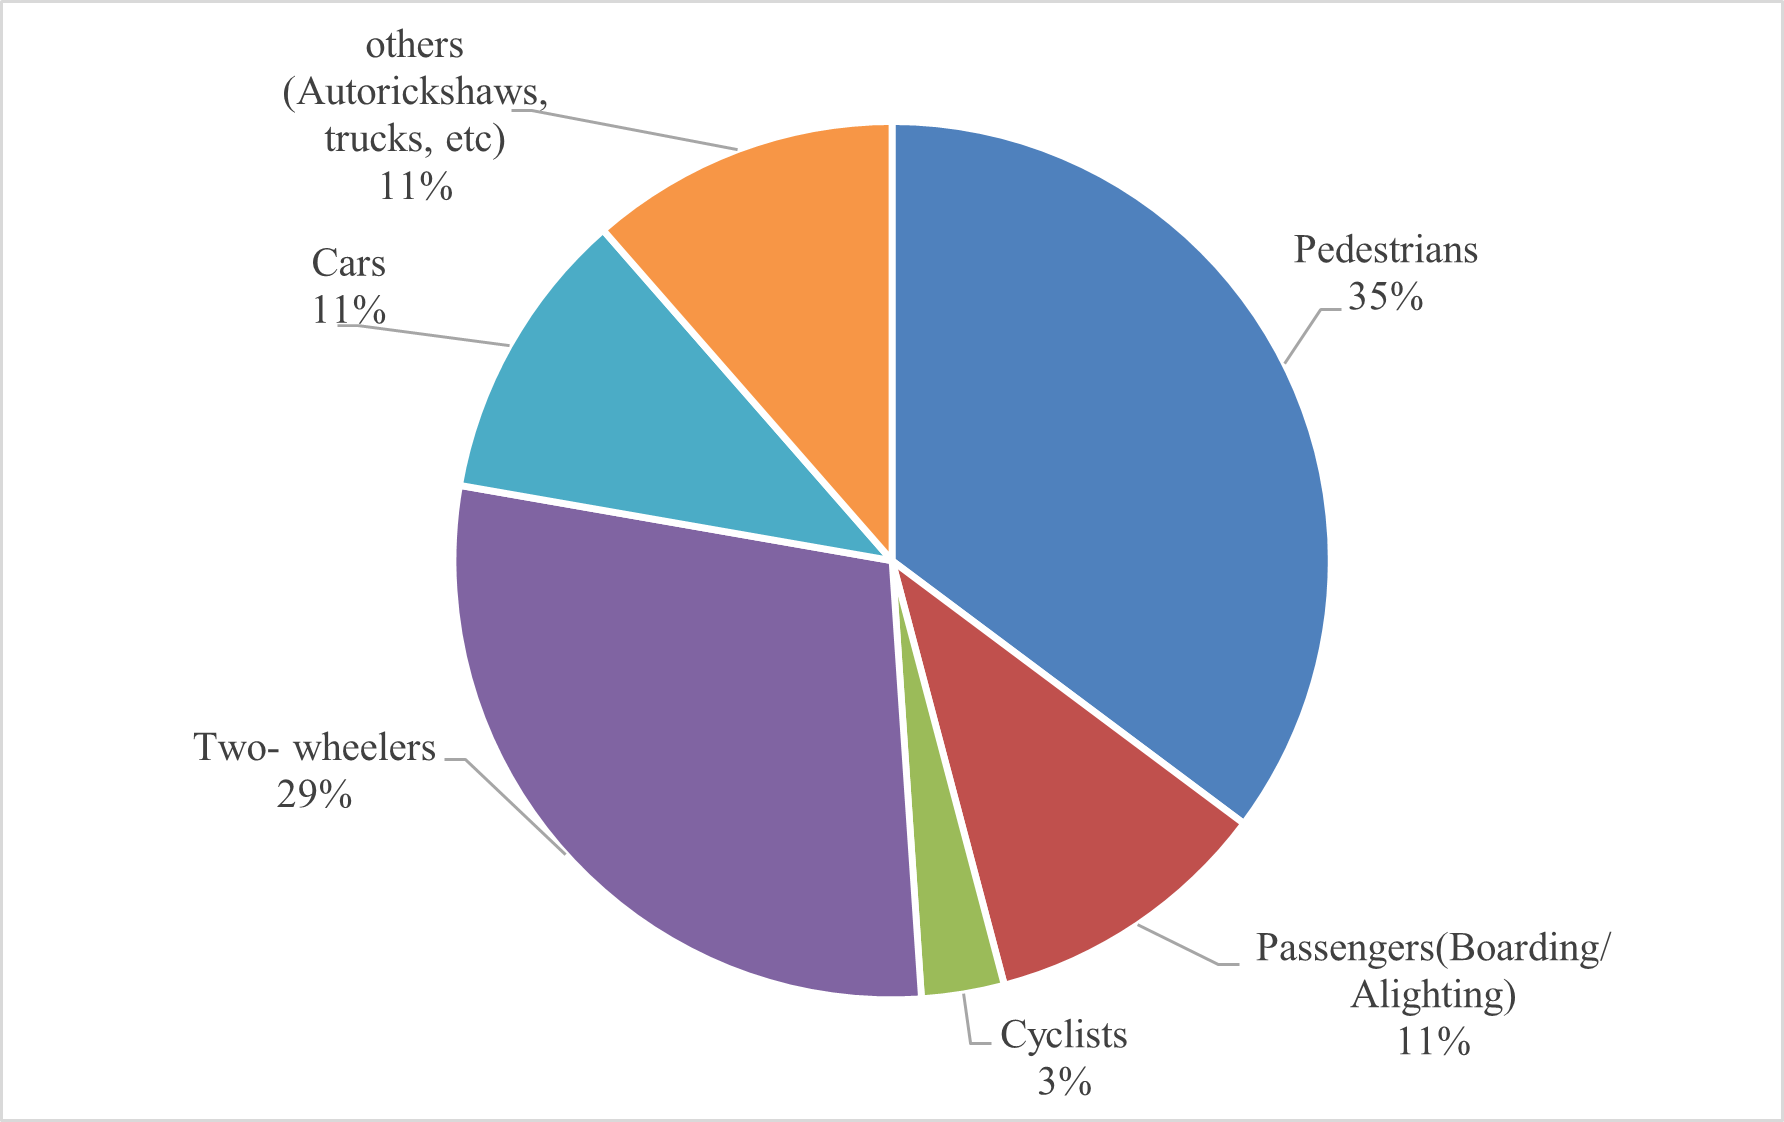
Over the five-year period between 2015 and 2019, 22 percent of total crashes were fatal crashes where 55 pedestrians, 12 bus passengers, 7 cyclists, 57 two-wheeler riders and 6 car riders died. Major crashes in the five-year period accounted for 8 percent of total crashes and involved 20 pedestrians, 8 passengers, 2 cyclists and 11 two-wheeler riders. Minor crashes accounted for 70 percent of total crashes and involved 255 pedestrians, 32 passengers, 11 cyclists, 103 two-wheeler riders and 63 car riders. As shown in Figure 5, of the total of 666 crashes involving DTC buses between 2015 and 2019 on Delhi roads, the majority of the victims were vulnerable road users – pedestrians, passengers boarding/alighting cyclists and two-wheeler riders (78%). Causes of crash are supposed to be recorded by police, but data are commonly missing and are mostly unknown. Of the few instances recorded in the data obtained from DTC, causal factors included rash and negligent driving, error of boarding/ alighting passengers and mechanical failure.
.png)
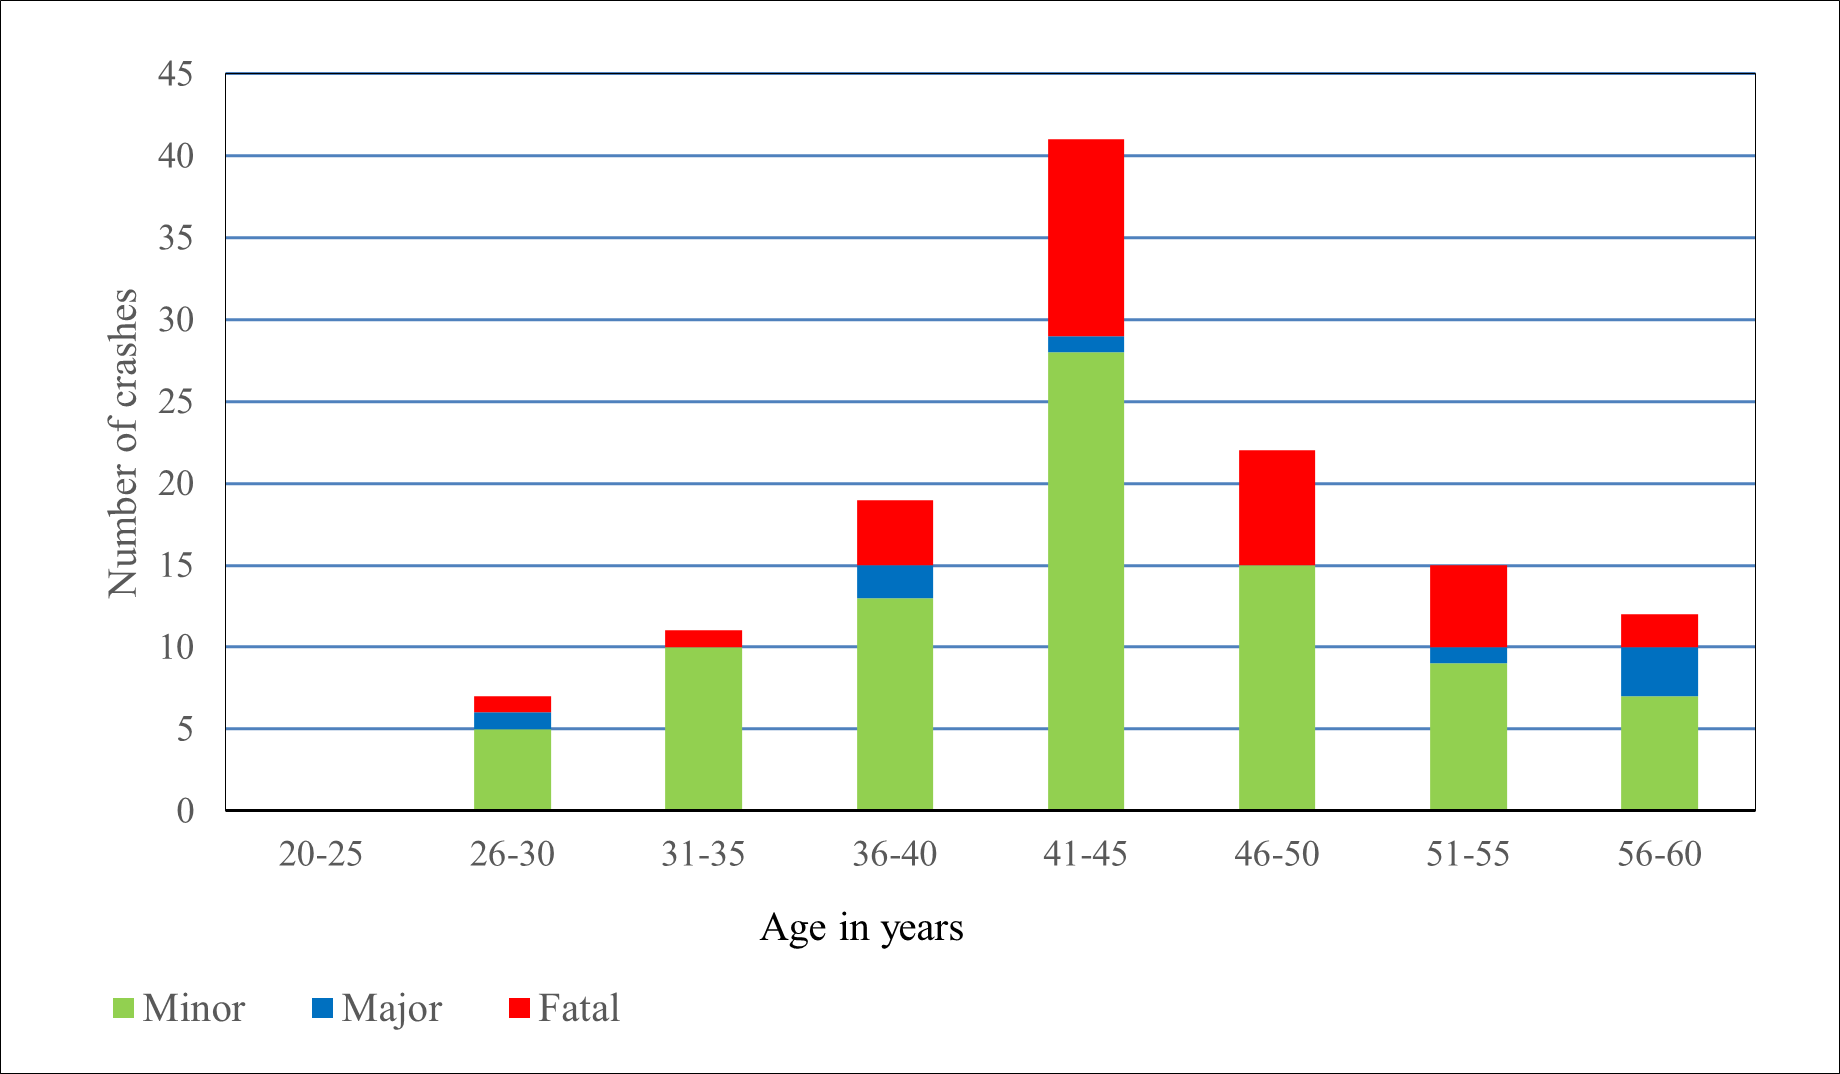
As shown in Figure 6, bus drivers involved in fatal DTC bus crashes were commonly in the age group of 36-55 years. The road safety record for DTC bus drivers also showed similar trend.
.png)
Discussion
Buses are generally considered to be a safe mode of transport but as the current study shows, in India, there is a need to focus on reducing bus crashes and their severity. Given the mass of a bus, a crash is likely to be more severe compared to other modes of vehicles especially when the crash involves a vulnerable road user. However, crashes are likely to be underreported as the indirect involvements of buses in crashes are not considered in formal police complaints or crash records (Brenac & Clabaux, 2005). Thus, there are various irregularities in capturing the status of bus safety.
In developed nations such as the EU countries and USA, crashes involving buses represent a smaller share of total crashes (e.g., EU: 0.5% (Cafiso et al., 2012); USA: 1% (Burrows et al., 2021) than in developing nations (e.g., Bangladesh: 42% (Maniruzzaman & Mitra, 2005) Africa: 36% (Sam et al., 2018); India: 5-10% (Transport Research Wing, Ministry of Road Transport & Highways, 2019)). Similarly, the share of fatal bus crashes of total crashes is lower in developed countries (e.g., EU: 3% (European Road Safety Observatory, 2018); USA: <1% (Burrows et al., 2021)) compared to developing nations (e.g., Bangladesh: 40% (Barua & Tay, 2010); India: 10% (Transport Research Wing, Ministry of Road Transport & Highways, 2019)).
Data from Delhi shows that the percentage of fatal of total crashes involving public buses is not declining despite the decline in the total number of bus crashes. KDE analysis helped to identify frequent crash locations. The majority of the crashes are happening in an urban setting but fatal crashes are more concentrated towards the fringe areas of Delhi.
The proportion of crashes involving vulnerable road users is very high (78%). Various external factors might be responsible for this vulnerability, especially for pedestrians in the absence of basic facilities such as footpaths, bus stops and level boarding facilities. High speeds on roads with low traffic, during mornings and inadequate lighting facilities during nights, might be some probable reasons for spikes during those times of day. The bus body specifications are also a cause of concern when it comes to ensuring safety. Research has shown that low floor buses with maximum height of 550 cm from ground can help to reduce injury severity, especially in crashes involving a pedestrian being run over by a bus (Kharola et al., 2010). Such standards must be established at the national level to direct vehicle manufacturing and at the state and municipal levels to direct the purchasing of standard buses.
Study Limitations
This study only examined DTC bus crashes in Delhi. However, this study is helpful in providing a snapshot for first recognising the problem in order to implement methods to remedy the situation. The initial stages in addressing this issue are precise data recording on the number of crashes and specifics such as vehicle speed and road design. The DTC team that is operating the buses must conduct safety audits at collision sites.
Conclusions
The Indian STUs operating in cities need to be cognisant of the matter and step up in their respective regions to improve their performance with respect to road safety of buses. There are a few cities such as Bengaluru where BMTC carried out a workplace alcohol prevention programme for bus drivers which is a progressive step. BEST in Mumbai in partnership with Bloomberg carried out a comprehensive plan involving measures such as crash investigation analysis, bus modifications, training by experts, online monitoring and design changes in a terminal. This led to reduction of crashes by one-fourth and fatalities by one-third for the period of 2009-2016 (Suman et al., 2017). Such measures can be carried out extensively with the support of government departments with the primary aim to make bus transport safer for passengers and other road users.
An integrated approach is imperative for reducing crashes and fatalities involving buses in our cities. Apart from the bus operating agencies, equal responsibility rests in the hands of other city agencies to improve overall safety on roads. The road agencies need to develop/modify their design criteria keeping in mind the importance of buses for cities and provide proper infrastructure for them, thus make necessary changes on roads, bus stops, bus bays etc. to promote safety for all.
The research shows that bus crashes in the given dataset of Delhi possess a spatial relationship and the dataset is not independent in nature, thus the distribution is nonparametric. The Probability Density Function (PDF) for these random variables is represented non-parametrically by Kernel Density estimation. KDE as a non-parametric function is used for different kinds of variables across the world, however, its application on bus crashes is a novel approach with respect to a case study in India.
The research establishes that bus crashes as a variable follow the Tobler’s law of geography, that is, ‘everything is related to everything else, however nearby things are more closely related’ (Tobler, 1970, p. 234) and thus crashes are spatially related. This research used KDE as a tool to establish this spatial relationship.
Acknowledgements
I wish to sincerely thank the General Manager, Head of Traffic Safety Cell-DTC, Dr R.S Minhas who provided me the detailed crash data for 5 consecutive years.
Author Contributions
My PhD guide Dr Sewa Ram has continuously encouraged me to design and structure the article. Both authors have read and agreed to the published version of the manuscript.
Data Availability Statement
All materials, data, and protocols associated with the publication will be available on request.
Human Research Ethics Review
The research protocols for this project were approved on 3 September 2020 in accordance with the review process at the School of Planning and Architecture, New Delhi, An Institution of National Importance under an Act of Parliament, Ministry of Education, Government of India (Ref/SPA/TPD,2020). The crash data for Delhi has been obtained from the Delhi Traffic Police department in the manuscript, is available for free online on the website as given in reference section. The five year-crash data for DTC buses have been obtained on request from the traffic safety cell of Delhi Transport Corporation, Delhi.
Conflicts of interest
The authors declare that there are no conflicts of interest.