
Introduction
Road safety in Auckland deteriorated significantly between 2014 and 2017 with deaths and serious injuries on the road increasing by more than 70 percent. Approximately 20 percent of fatal and serious injury crashes involved a pedestrian (Palalagi, 2016). An independent review of road safety commissioned by Auckland Transport in 2017 signalled the need for urgent action (Howard, 2018). Road safety was subsequently elevated to the highest level of priority by Auckland Transport and with the support of Auckland Council and Central Government, investment in road safety has increased significantly.
Auckland Transport developed Vison Zero for Tāmaki Makaurau (Auckland) (Auckland Transport, 2019) to guide the future investment in road safety. This document details the future road safety strategy and action plan for all modes of transport: bus, train, ferry, walking, cycling, motorcycling, micro-mobility and general traffic. The plan aligns with the safety focus of the 2021-24 Government Policy Statement on Land Transport and Auckland strategic priorities.
Auckland Transport also developed a series of business cases to ensure that road safety investments are evidence based and transparent. The Road Safety Programme Business Case (PBC) (Mason, et al., 2018) describes a programme of road safety infrastructure delivery. The need for an open and rigorous approach to planning has been reinforced through increased attention to walking and cycling in response to COVID-19 disruptions (Brodie, 2021).
Mass Action Pedestrian Crossing Improvement Programme
The Road Safety PBC includes several interventions specifically aimed at reducing road trauma. One of these, the Mass Action Pedestrian Crossing Improvement Programme (MAPI) (2018-19) was a region-wide initiative focused on improving safety at pedestrian zebra crossings.
The focus of MAPI followed data which showed that 20 percent of all pedestrian related crashes between 2011 and 2015 in Auckland (equating to 76 crashes) occurred at zebra crossings and that the failure of approaching vehicles to give way was the main contributing factor (Auckland Transport, 2017). Zebra crossings had traditionally been regarded as the safest type of crossing, particularly for children crossing the road in the vicinity of schools. The crash data provided clear evidence that road safety enhancements were required.
Speeds of no more than 30km/h are considered optimal in the Safe System for reducing the risk of harm to people travelling outside vehicles at crossings (Waka Kotahi NZ Transport Agency, 2022). In the event of a VRU/vehicle conflict, decreasing vehicle speed from 50 km/h to 30 km/h at the point of impact can reduce the likelihood of a VRU fatality or serious injury from 80 percent to 10 percent (Woolley et al., 2018). Design standards adopted by Auckland Transport for new crossings aim to improve safety by reducing conflict speeds to no more than 30km/h. Following the Vison Zero strategy adopted, Auckland Transport aims to eliminate any death or serious injury on the network that could be actively designed out. Reducing vehicle speeds at crossings is therefore the primary objective of MAPI.
Auckland Transport uses vertical and horizontal speed control devices to manage vehicle speed and to protect people travelling outside vehicles. Vertical devices use vertical displacement to reduce speed through ride discomfort, for example, through speed humps and raised safety platforms. Raised platforms are a type of vertical speed control device, consisting of a mid-block raised flat section of roadway, elevated from street level to reduce vehicle speed. As driver and passenger discomfort correlates to vertical acceleration, the profile of these devices is critical to achieving intended safety benefits while balancing community tolerances and the potential for unintended negative consequences (e.g., vehicle damage, potential risks for bus passengers). Horizontal speed devices use horizontal deflections or carriageway deviations to influence driver behaviour through a change of path.
Auckland Transport favours the use of horizontal speed control devices over vertical devices as the latter can generate a range of issues. These include pavement deformation and failure, ground borne vibrations, damage to vehicles and construction tolerance issues.
Despite Auckland Transport’s preference for horizontal speed devices, it was decided that MAPI would focus on upgrading existing zebra crossings to raised crossings, thus utilising the speed reduction effect of vertical displacement. One of the key advantages of raised platforms over horizontal devices is they can be used as pedestrian crossings. Raised platforms are also particularly useful when retrofitting within brownfield environments, such as existing roads or streets.
Platform height and ramp gradient describe the profile of the raised platform and are the primary geometric parameters which determine the degree of vehicle speed reduction. Raised platforms installed by Auckland Transport prior to 2017 on lower order roads, such as secondary arterials, collectors and residential local streets, typically have a gradient of 1:20 and are between 75 mm and 125 mm in height. An advantage of these profiles is that they accommodate a range of road users including heavy vehicles, emergency vehicles, buses, bicycles and low floor vehicles. However, observations and speed measurements undertaken by Auckland Transport indicated that most vehicles can traverse this profile at greater than 30 km/h. These profiles therefore do not meet the Safe System standard for survivable speeds at crossings.
Within Auckland, vertical devices have more traditionally been used within Low Traffic Neighbourhoods and Local Area Traffic Management schemes on local and low order collector streets, to reduce speed and ‘rat running’. Emergency services, freight, and other stakeholders have voiced concern about the use of the devices on freight and bus routes, busy arterials, and on lifeline routes used by emergency services (Green et al., 2020).
There is currently limited New Zealand research on the acceptability, effectiveness, and operational impact of vertical speed control devices on high order roads. Acceptability is critical as opposition can erode the credibility of the road controlling authority, may lead to the removal of devices, and may prevent any further installations.
This article describes the programme of development, testing and evaluation that was undertaken to inform the MAPI programme and to assess outcomes and impacts. Testing was particularly important in determining the appropriate profile of raised platforms to be used in MAPI. The optimal profile would achieve a survivable speed, be accepted by stakeholders, and minimise the potential for adverse consequences such as vehicle occupant discomfort, the risk of falls by bus passengers, heavy braking, vehicle damage, and heavy vehicle rollover.
Development and testing phase
This section describes the data that were collected and analysed during the development and testing phase of MAPI.
Literature review
A total of 19 published and unpublished sources were reviewed to examine international best practice in raised platform design. The review sought to advance understanding of the performance of difference profiles in reducing vehicle speed and to enable the performance results to be considered within the New Zealand context (McDonald et al., 2018).
Site measurements
Following the literature review, site measurements were undertaken at five existing raised platform sites in Auckland installed prior to 2015. The tables were selected to vary by profile and operating environments, including road gradient, road width, traffic density and adjacent land use.
The approach and crossing vehicles speeds were recorded with a Bushnell speed radar gun which allowed continuous measurements. The speeds of the vehicles were then plotted based on the profile of the table to establish the co-relationship between speed and profiles such as platform heights and ramp gradient.
Field trials
The literature review and the site measurement data aligned and collectively suggested that raised platform ramps should be 100 mm in height (75 mm for buses to mitigate driver passenger discomfort) at a 1:15 gradient (McDonald et al., 2018). While this design was more likely to balance safety and efficiency outcomes, Auckland Transport was concerned it was unlikely to meet the Vision Zero goal – i.e., no death or serious injuries at crossing points. Following Vision Zero, Auckland Transport had also adopted design standards for new crossings that would reduce conflict speeds to no more than 30km/h. It was therefore proposed that a 1:10 table profile was appropriate for the MAPI programme.
The MAPI team recognised that a 1:10 profile might cause discomfort for bus drivers and passengers due to the vertical acceleration effect. Buses typically have stiffer suspension than other vehicles, and there can be a double thump effect as each set of wheels traverses the platform. These concerns were concurred and shared by Auckland Transport Metro Division. To test these concerns, four raised platform profiles were installed at a contractor depot and field trials were undertaken. The table profiles tested were:
-
100 mm, 1:10 both ramps
-
75 mm, 1:10 both ramps
-
75 mm, 1:10 entry ramp and 1:40 exit ramp (3m top)
-
100 mm, 1:10 entry ramp and 1:40 exit ramp (3m top)
Three bus types were used in the trial to replicate the current bus fleet and performance differences between each type:
-
11.3 m bus, single rear axle
-
12.6 m bus, bigger wheels and tires and superior suspension
-
13.5 m bus.
The trial comprised drive-overs at 15 km/h, 20 km/h, and 30 km/h respectively and a late brake test, where the traverse speed was determined by driver braking.
Accelerometery data were collected for each drive over speed test using the mobile phone application Sensorlab. Accelerometery provides a measure of vertical acceleration which is a useful proxy for the discomfort experienced by vehicle occupants. For buses, the data were collected by 12 passengers seated in various positions within each bus. The passengers were also asked to rate their level of comfort at each speed the different profiles were traversed.
The data collected from the field test demonstrated that passengers experience an increase in discomfort as the bus speeds increase depending on where they sit on the bus. For example, passengers at the rear of the bus recorded higher levels of discomfort as the bus exited the table.
Cameras placed at each table location were also used to understand how the tables affected bus suspension at different speeds. The camera survey showed that on tables of 100 mm and 1:10 and at speeds below 30 km/h, buses did not ‘bottom out’. It was noted that passengers may experience more discomfort at higher speeds.
Implementation of MAPI
Following the investigations above it was recommended that the MAPI raised platforms should have a 1:10 gradient and should be 100 mm high. On bus routes, a 1:10 gradient and 75 mm height was recommended. Ideally a Swedish style table (1:40 exit ramp) would be installed, however site constraints limited the ability to design and build these at all locations.
The MAPI programme subsequently delivered 37 upgrades of existing at grade crossings to raised zebra crossings over 2018/19. More than 100 raised zebra crossings have been delivered to date, both upgraded existing crossings and new crossings.
Results
Programme outcomes and impact
This section details evaluation undertaken to assess outcomes and impact from MAPI.
Post construction speed surveys
Post construction vehicle speed data were collected for a seven-day period at three of the treated sites. The sites were selected to represent different types of tables constructed. Two sites are a standard raised platform and have a 1:10 ramp. The third has a Swedish table profile of 1:10 approach ramp and a 1:40 departure ramp.
Six speed tubes were laid at each site to generate a speed profile on approach and departure from each crossing. The tubes were positioned on each side of each table (i.e., to give a total of six points of measurement at each crossing), installed as follows:
-
Between the table ramp and the limit line - this position considered to give the most accurate measure of vehicle speed at the crossing itself
-
30 m from the limit line - this position measured vehicle approach speeds at an intermediate approach point in relation to each crossing
-
60 m from the crossing - this position was used to measure free running vehicle speed, outside the zone of influence of the speed tables
Table 1 shows an example of the data output from the bus with 12 passengers. Each person rated their comfort level at the various test speeds. The data shown is for a 1:10 100 mm table comfort level at 15 km/h.
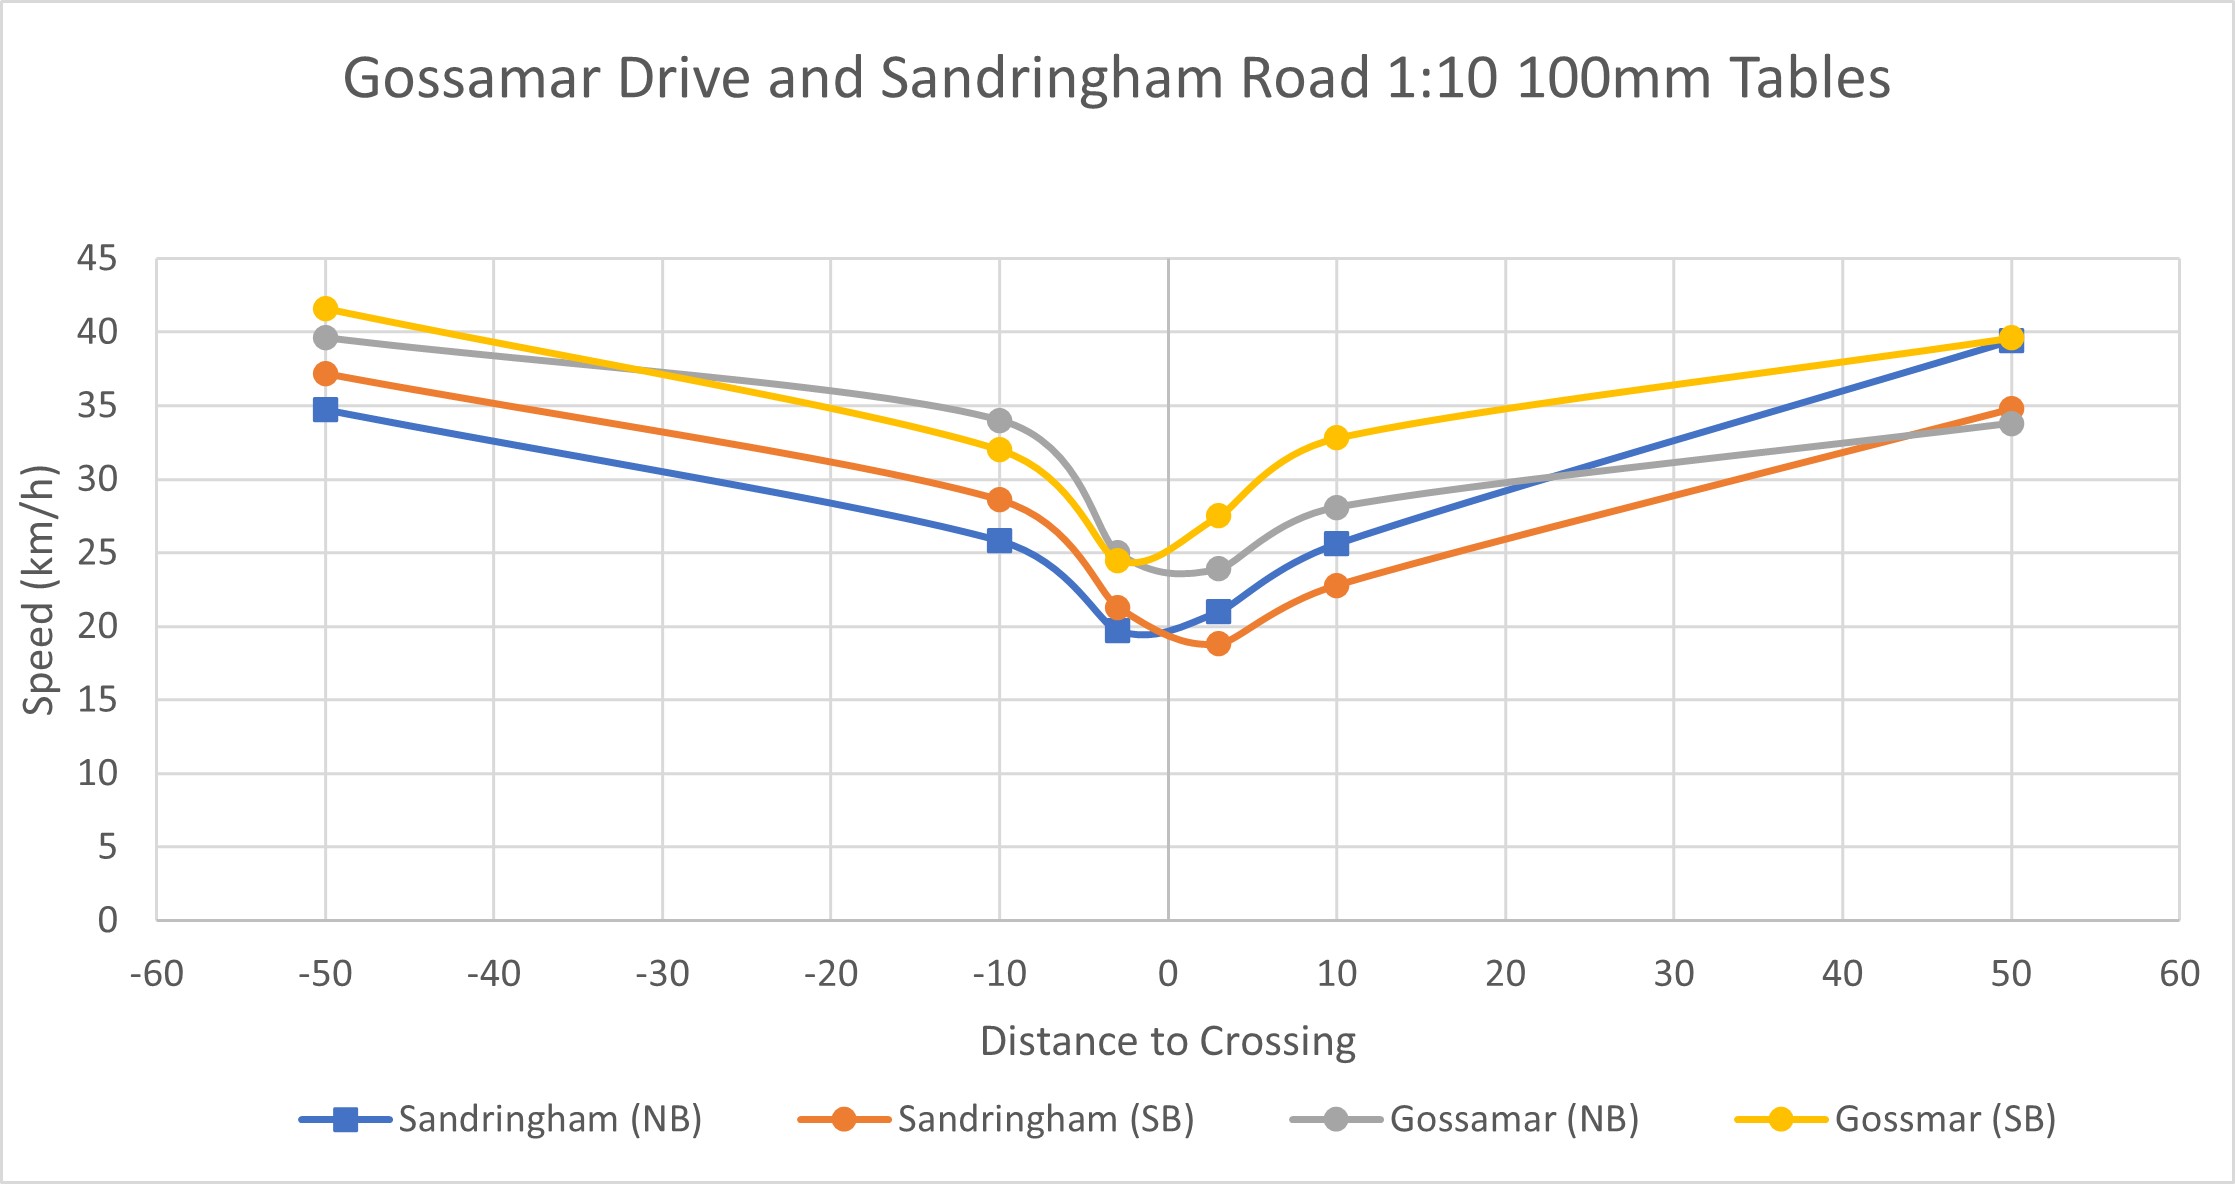
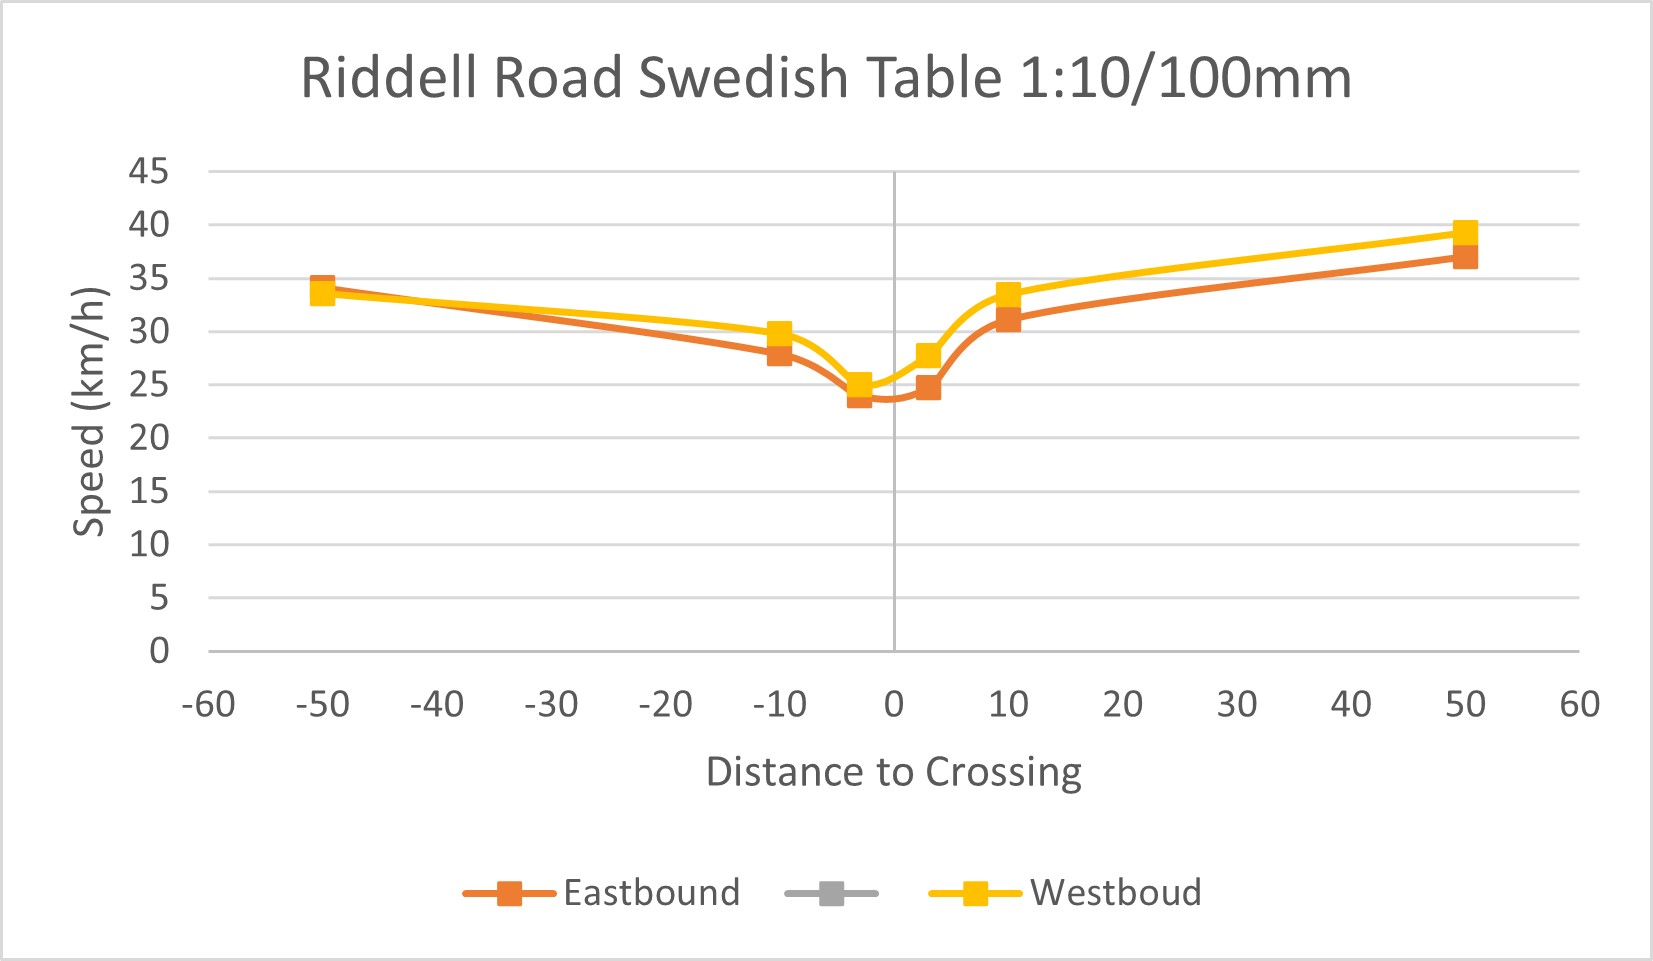
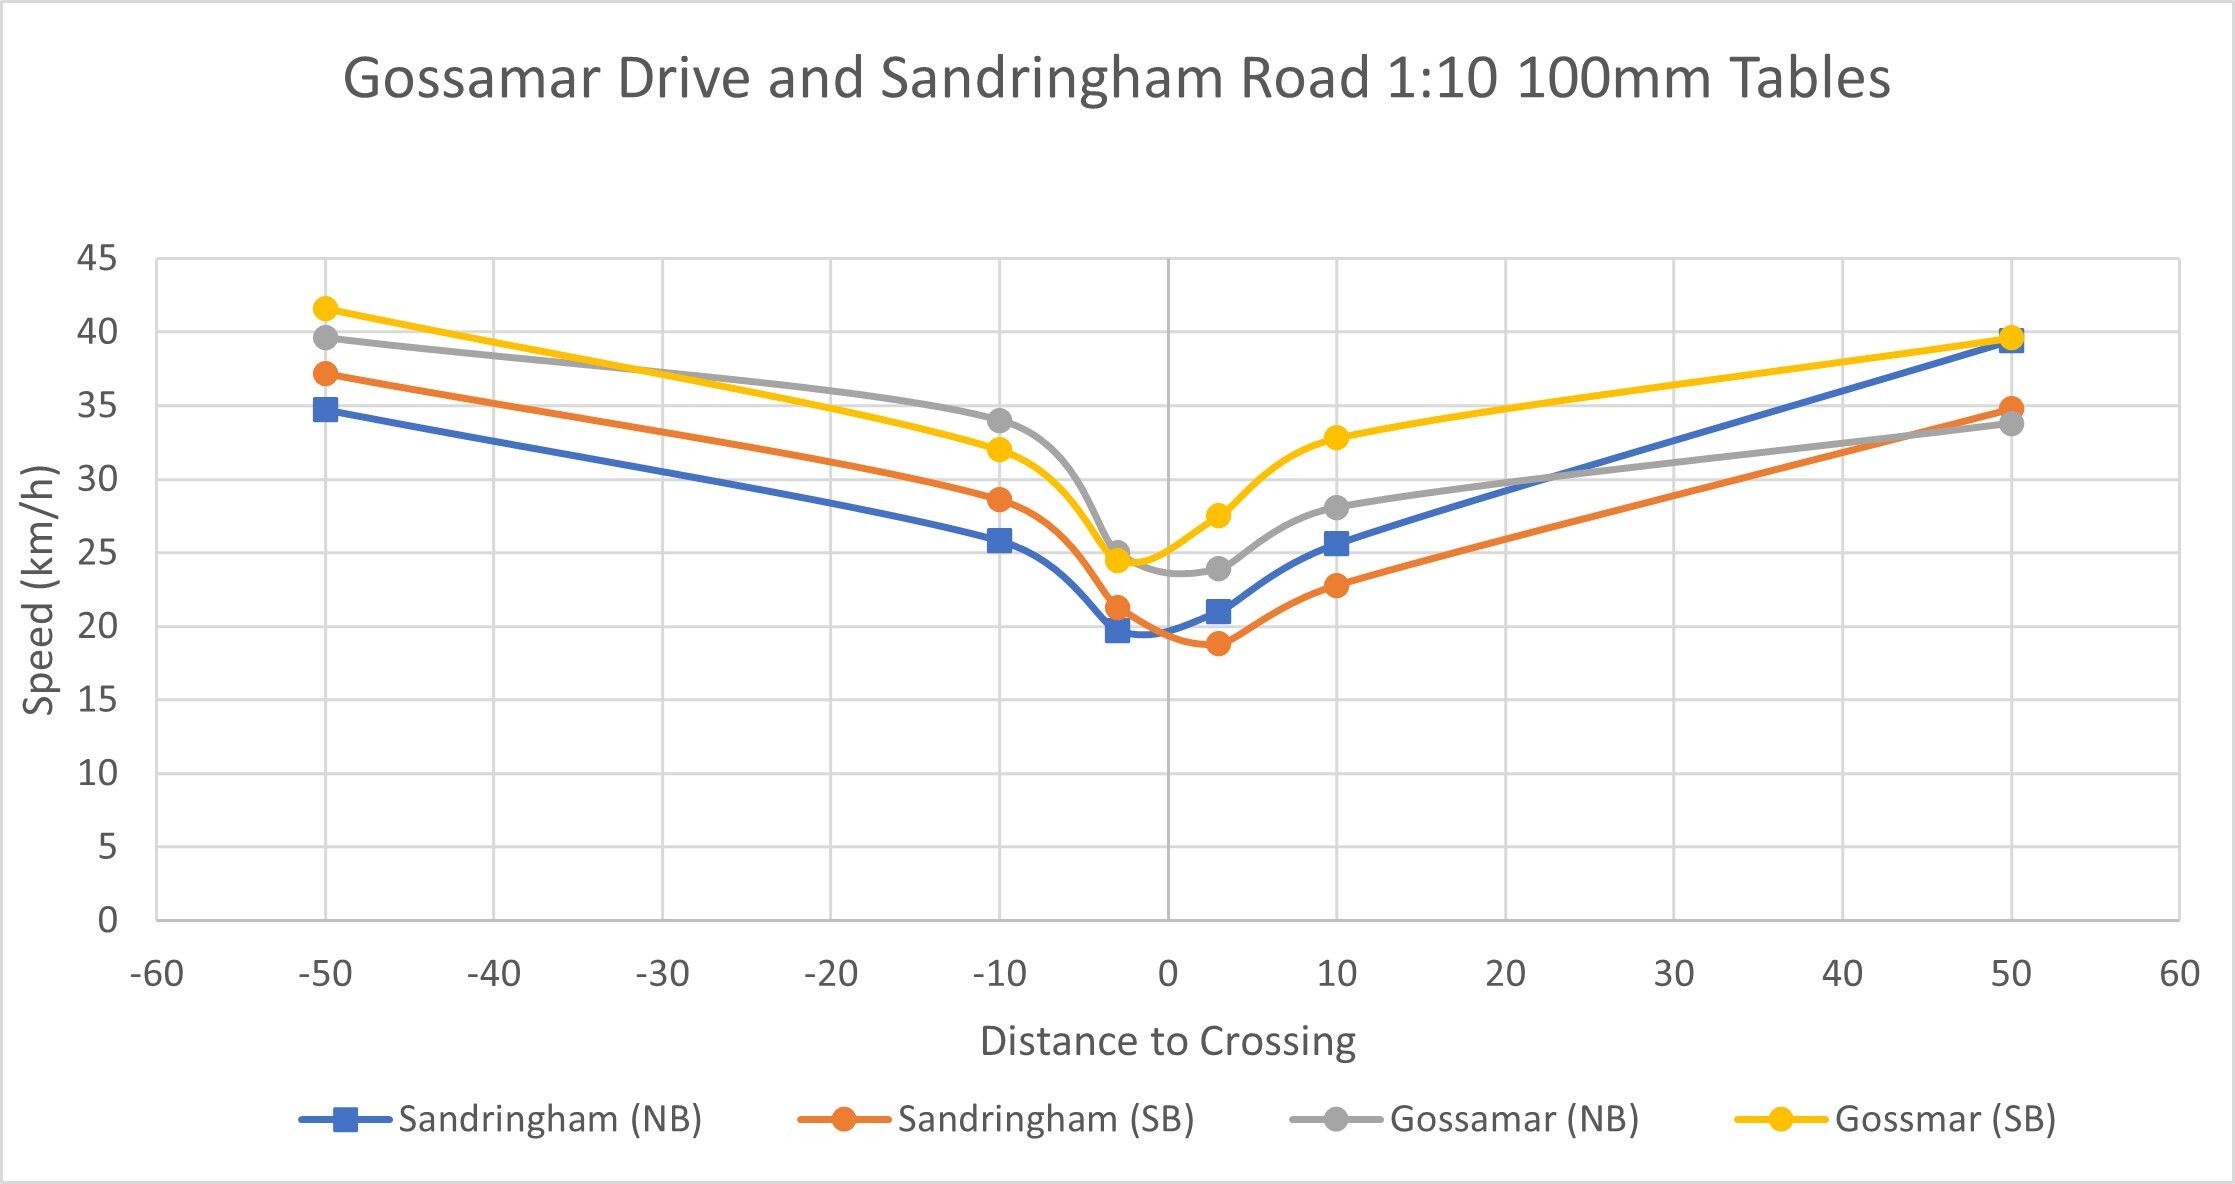
As shown in Figure 1, the mean speed ranged between 20-25 km/h for standard raised platforms with 1:10 ramps (Patel et al., 2021). Figure 2 shows the mean speed when vehicles transverse over the Swedish profile with a 1:40 departure ramp. The Swedish table is similar to the standardised raised platform with a 1:10 entry ramp but with a 1:40 departure ramp. The rate of acceleration from the Swedish table is faster due to the soft departure ramp.

Pre/post implementation crash data analysis
Pre and post implementation crash data were analysed at 37 treated sites and 30 untreated sites to understand safety outcomes.
At the time of writing, 30 months (2.5 years) of post construction crash data have been analysed. The post construction crash data were compared with five years of pre-construction crash data using 2x2 chi-square analysis. The chi-square 2x2 matrix is shown in Table 2.
Some caution is required interpreting the data as periods of data collection occurred over periods of COVID-19 related disruptions and changes to travel behaviours. These impacts may have impacted the data. However, it is difficult to identify and isolate impacts specifically.
The chi-square test has a single sided significance level of 5%. The results of the chi-square analysis with degree of freedom = 1 are as follows: χ2 (1, N = 150) = 7.03882, p = 0.008
At the 5% significance level the crash reduction at the treated sites is statistically significant.
To normalise the data from Table 2 to an annual basis, the crashes at the improved sites have reduced from 20.8 to 5.6 crashes per year. The number of serious and fatal crashes was also assessed with the analysis showing ten serious and two fatal crashes prior to treatment and one serious and no fatal crashes nor pedestrian crashes post treatment.
Table 3 shows a summary of serious and fatal crashes pre and post treatment. On an annual basis the serious and fatal crash rates have reduced from 2.4 to 0.4 crashes per year.
The above data suggest that there is a reduction in crashes at the treated sites. Of interest is whether there is a wider network effect with a reduction in crash rates at pedestrian crossings. To provide initial insights, the Waka Kotahi NZ Transport Agency crash database was interrogated to identify pedestrian injury crashes at pedestrian crossings between 2011 and 2021. Figure 3 shows the number of pedestrian injury crashes that occurred at pedestrian crossings. In general, there was an increasing trend in crash rates with an average of 18 pedestrian injury crashes per year over the 7-year period.

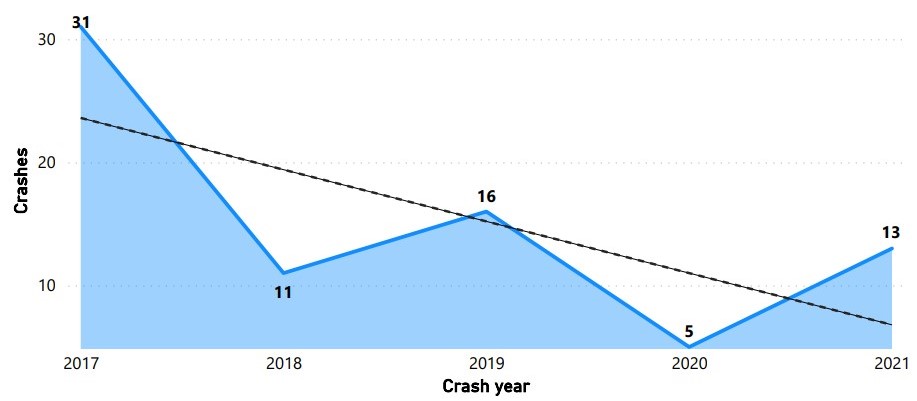
From 2017 there has been a reversal of the crash trend as shown in Figure 4. The crash rate has reversed despite an increase in the total number of pedestrian crossing facilities installed on the Auckland roading network. The average pedestrian injury crash rate per year is 11.3 over the 4-year period between 2018 to 2021. The reversal in crash trend coincides with implementation of the MAPI programme in 2018.

Discussion
The 2018/19 MAPI programme upgraded 37 existing at grade crossings to raised zebra crossings. Guided by a literature review, site measurements, and field trials, profiles of 1:10 profile were installed. Programme outcomes and impact were evaluated by pre and post construction speed surveys and analysis of pre/post implementation crash data.
The evaluation showed that mean speeds at treated sites ranged between 20 km/h to 25 km/h which is below 30km/h, the suggested survivable speed for VRU. An analysis of crash data also showed a notable reduction in crashes at the treated sites. The crash reduction was statistically significant at the 95th percentile confidence interval using 2x2 chi-square analysis. Only one serious crash has occurred at the treatment sites analysed. This was a loss of control crash by a driver and was likely a result of excessive speed and unsafe driving behaviour.
Safety concerns about the crossings have been raised by motorists to Auckland Transport, including the potential for heavy or late braking and the risk of being rear ended. Site observations undertaken by Auckland Transport have confirmed the potential for such incidents, however these are likely to be low risk given drivers are required to slow to low speed to avoid ‘bottoming out’ on the table ramp.
Some motorists regard the 1:10 profile as too aggressive. There have also been reports and feedback from the public to Auckland Transport and via social media that the crossings impact traffic efficiency along busy arterial routes, especially during off-peak hours. This is due to the change in speed when traffic negotiates the raised platforms.
Site observations completed by Auckland Transport indicated that motorists are more likely to yield and give way to pedestrians at raised crossings. Observations and positive feedback received from the school communities have also suggested increased utilisation of the zebra crossings following the upgrades due to the reduction in speed and positive driving behaviours. There has also been an increase in requests from school communities received by Auckland Transport for raised crossings to facilitate safe crossings and connections to public transports and currently there are approximately 100 raised crossings are listed in Auckland Transport programme for delivery.
Measurement of traffic induced ground vibration
Traffic Induced Ground Vibration (TIGV), the ground vibration caused by vehicles travelling the road, can impact resident amenity. A range of factors can influence the extent of TIGV, for example, road surface imperfections (e.g., raised services covers, potholes), road condition, pavement strength, vehicle factors (e.g., speed, weight, suspension, load distribution), soil type and composition, building materials, and foundation type.
In light of concerns raised by residents near some of the treated sites, Auckland Transport placed vibration loggers (geophones / mini seismographs) in several homes near different raised crossing profiles installed under MAPI. Vibration levels recorded for different types of buses confirmed that none of the profiles would contribute to property damage. The analysis also confirmed the impact of other factors on the level of TIGV, for example, level of road surface maintenance and vehicle approach speed. Auckland Transport has implemented a range of measures to ensure that bus drivers traverse the crossings at safe and appropriate speeds. These measures appear to have been effective in reducing the level of noise and vibrations nuisance to residents (Auckland Transport, 2021).
Design and construction learning
Stakeholder feedback on the raised tables installed has been mixed. While the profiles used have been relatively consistent across the programme, some sites received more complaints than others. Differences in operating environments may help to explain this. For example, vertical displacement from a 1:10 gradient may be particularly severe when tables are installed in isolation on multi-lane arterials and when approach speeds are high, particularly off-peak.
The MAPI project team observed that road grade on approach can influence the comfort of vehicle occupants when traversing raised platforms. Grade correction is required to ensure the ramp gradient relative to road gradient is maintained. Consistent advance warning signs and markings are also critical to ensure that drivers approach raised platforms in a controlled manner and that the need for late or emergency braking is avoided.
MAPI also demonstrated that stormwater management is a significant factor influencing cost and constructability. Flood flows can be difficult to manage. Drainage infrastructure can be expensive, particularly in relatively flat areas, within the flow-path or where freeboard to properties is not feasible. In general, Auckland Transport has sought to avoid slot drains and chequer plate options due to maintenance issues and slippery surfacing in wet conditions. When required, catchpits, manholes and associated pipes are the preferred construction methodology to manage the stormwater management on the approaching and departure ramps. Note, however, this approach has associated costs related to infrastructure, traffic management and the management of potential conflicts with underground services.
To reduce construction impacts of MAPI on the road network and to minimise temporary traffic management costs, contractors were required to deliver raised platforms within a relatively short timeframe. At some locations, this affected the quality of construction, including that the intended profile was not always 100 percent accurate. Even small deviations in profile can influence safety outcomes and community acceptance. Profiles that are too steep can increase discomfort levels for vehicle occupants and may lead to hard braking. These experiences can generate user complaints and erode public support. Alternatively, if profiles are too soft, speed reduction and safety outcomes can be compromised which can also have a negative impact on public sentiment.
Future considerations
Raised safety platforms are an essential Safe System treatment to ensure survivable vehicle speeds at pedestrian crossing points. While the 1:10 ramp profile used in MAPI achieved good safety outcomes, concerns were also raised by motorists and other stakeholders, particularly when used on arterial roads. Following the learning from MAPI as well as from other applications (VicRoads, 2019), AT have now adopted a 1:15 gradient as a standard design recommendation. This balances safety objectives with the need for community buy-in. This move may ultimately enhance city wide safety outcomes if community acceptance of the lower profile enables a greater number of treatments to be installed.
Within the context of budget constraints, questions remain as to whether safety investments should continue to be focused on upgrading existing crossings or whether the installation of new raised crossings should be prioritised.
Raised table treatments may also deliver safety benefits in other settings, such as signalised crossings and intersections. However, while AT are continuing the installation of raised platforms at a number of new improvement sites, there is little evidence currently on environmental impacts and potential impact on the function of arterial corridors and collectors (e.g., would adjacent collectors and residential streets see an increase in rat running as traffic seeks to avoid the treatments?). Stakeholders have expressed concern about the potential for such cumulative impact across the network. This concern is particularly raised by both the freight industry and Fire Emergency Services New Zealand. Auckland Transport will investigate this issue further in the future. More holistic assessments and planning are required to ensure the installation of raised tables targets the highest risk crossing areas across the network.
The social licence for further roll-out of raised platform upgrades must continue to be developed. Communicating the purpose and benefits of raised platforms, effective engagement with stakeholders and educating road users about how they should be approached are all important. Auckland Transport is exploring interventions such as placemaking, technology solutions, for example, point to point speed cameras, driver feedback signs and campaigns to increase awareness and support.
Clearly there is mixed community support currently for raised platforms. While walking and cycling advocates are generally supportive, drivers tend to view raised platforms as an inconvenience. Emergency services have raised concerns about impacts on response times and the ability of vehicles to execute certain emergency procedures. These impacts could compromise community health and well-being. Representatives from the freight industry have also raised concerns about increased travel times and risks to onboard cargo.
Following the above, Auckland Transport are currently in discussions with emergency services and the freight industry on the policy and applications for raised platforms on lifeline/freight routes. This discussion will inform the analysis and on-going monitoring of Tom Tom data to advance understanding of the operational impacts of raised platforms on lifeline routes and major freight routes.
On-going monitoring and evaluation will also be important to track longer term outcomes and to understand cumulative impacts across the network. Auckland Transport are currently further developing their monitoring and evaluation approaches and methods.
Strengths and limitations
The main strength of the MAPI programme is that it provided an opportunity to install and evaluate raised crossing across 37 sites. Unlike typical crossing upgrades, that are often piecemeal and dependent on funding over long periods of time, this programme provided widespread upgrades with comprehensive pre- and post-implementation testing and evaluation. In addition to the treatment profile and vehicle speed, other factors are expected to influence the level of vertical acceleration experienced from raised platforms. Factors include the vehicle suspension system, vehicle clearance, steering configuration, tyre pressure, tyre size and seat cushioning (for buses). While these factors were not able to be accounted for in this analysis, variability in the speed data results will be important topics for attention in future projects.
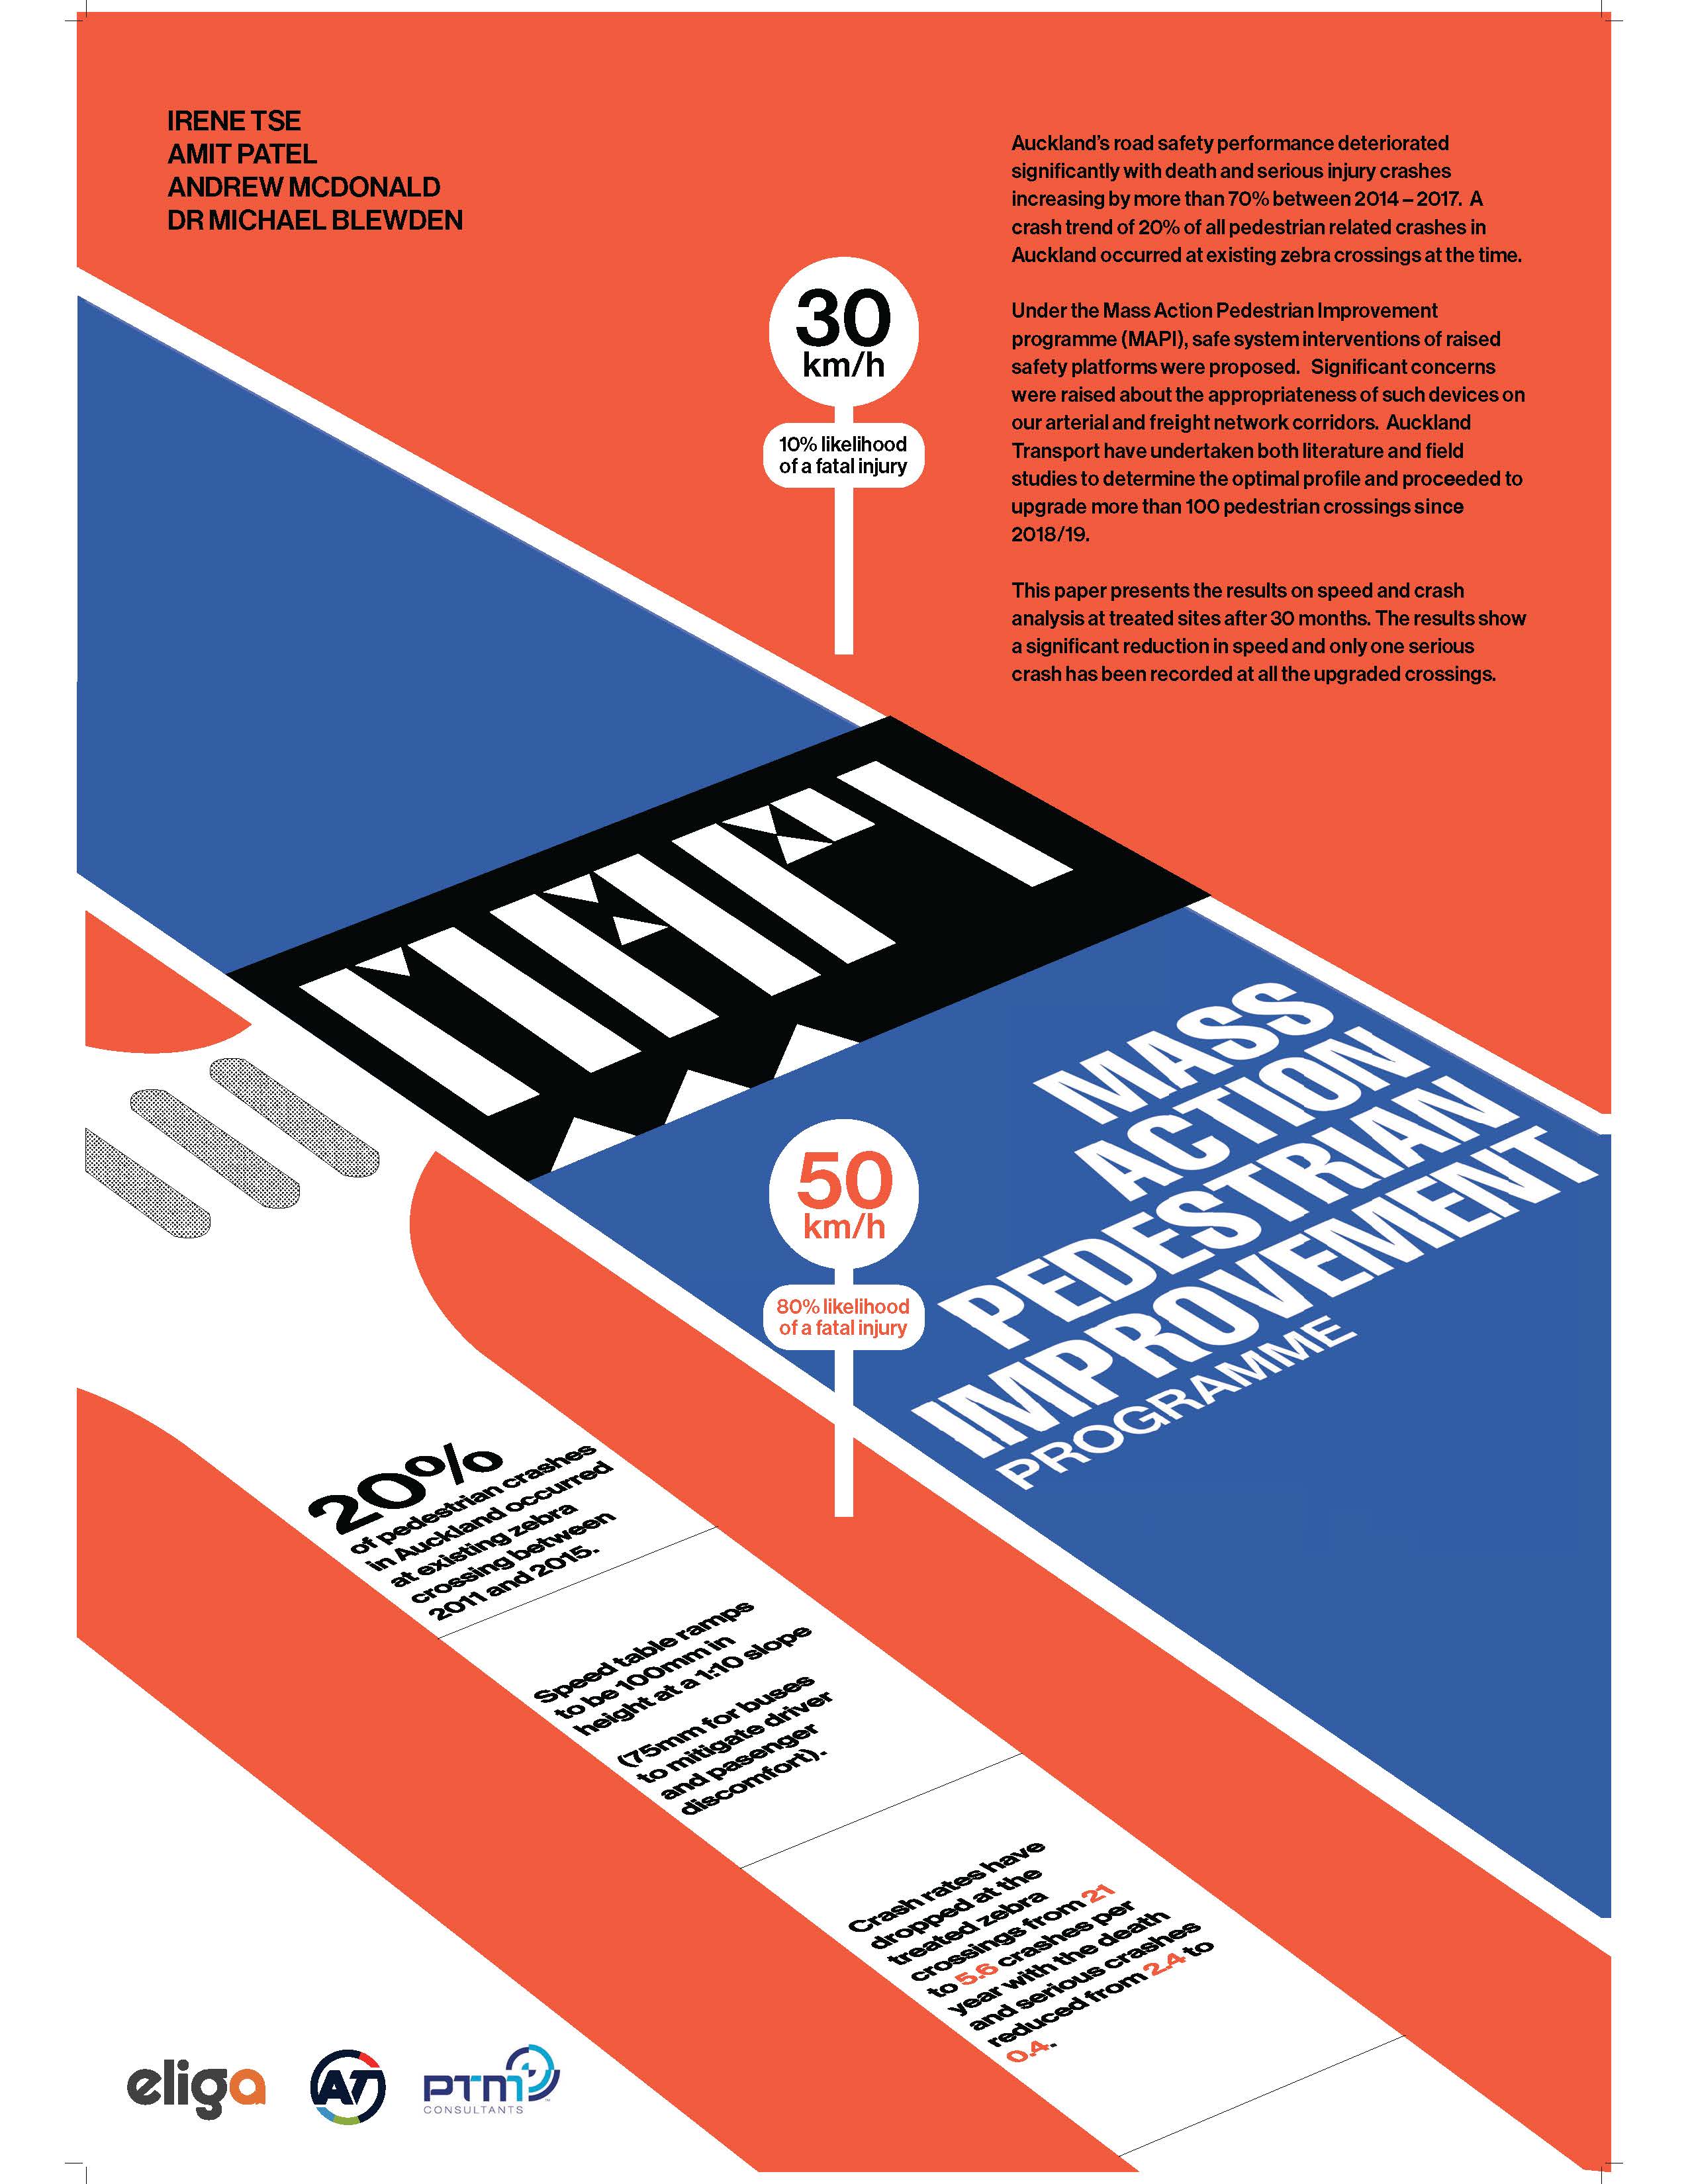
There has been strong interest in MAPI within the road safety sector, given the innovative and scaled nature of the programme in New Zealand. In addition to this paper, a poster was presented at the Australasian Road Safety Conference (ARSC) in 2022 to share our learnings. The poster shown in Figure 5 captured the key outcomes from the programme and was supported by a brief oral presentation.
.jpg)
There were some limitations of the program. How vehicle occupants experience and interpret discomfort will also vary, and in this respect, the subjectivity of passenger comfort level ratings is also acknowledged. Passengers did not represent a full demographic of bus users. For example, an elderly passenger may feel severe discomfort in locations where a younger person may not. Future projects should include a broad range of age groups to understand the impact across age groups and other demographic characteristics.
Some caution is required interpreting the crash data reported in this study as evidence of MAPI impact, in particular because of the potential impact of COVID-19. The reduction in crash rates at pedestrian crossings across the network reported between 2018-2021 may in part reflect changes in traffic volume or transport behaviour due to COVID-19 during 2020-21.
Note that this study compared the total number of pre- and post-implementation crashes at treated pedestrian crossing sites with untreated sites and that this design increases confidence that a treatment effect has been detected. The number of pre- and post-serious and fatal crashes were only reported for treated sites, and the lack of comparison with untreated sites gives less confidence that a treatment effect has been detected for serious and fatal crashes.
In general, the reader should note that the data reported in this paper was primarily collected to inform the design and delivery of the MAPI programme. It is acknowledged that the extent and quality of the data reported may not meet expected standards for research driven projects. However, these early findings provide valuable insights that may be used as a basis to inform further projects.
Conclusions
Since 2018/19, Auckland Transport has adopted the practice of installing raised zebra crossings rather than at grade crossings under the MAPI programme. Raised crossings installed have been shown to be effective in reducing traffic speeds to a survivable speed for pedestrians. There has been a significant reduction in death and injury crashes at treated sites. These results confirm that MAPI achieved the safety outcomes sought by Auckland Transport and that overall, the programme is aligned with Auckland Transport’s Vision Zero strategy.
Some concerns have been expressed by stakeholders and road users about the aggressive profile used in the programme and about the potential for cumulative impacts across the network. Auckland Transport will continue to roll out raised safety platforms to achieve survivable speeds at high-risk locations, while balancing the need for the efficient operation of the network.
Glossary
At Grade Crossing A crossing at the same level as a road
Auckland Transport Council Controlled Organisation responsible for delivering land transport facilities and services within the Auckland Council region
AT Metro Public transport brand in Auckland, New Zealand, managed by Auckland Transport
CAS/Crash Analysis System Police reported crash monitoring database for New Zealand
Horizontal Device Treatments using horizontal deflections or carriageway deviations to influence driver behaviour through change of path, including angled slow points and central blisters
Pedestrian Crossing A specially marked area giving legal rights to pedestrians crossing the road
Profile The shape of a pavement surface/raised platform measured in a vertical place from a datum which is parallel to the traffic flow
Raised pedestrian crossing A raised zebra crossing (also called a zebra crossing on a raised platform) incorporates a priority crossing featuring white striped bars on a platform raised above the road carriageway
Raised platform A mid-block raised flat section of roadway elevated from street level to reduce vehicle speed (also known as a raised table or speed table).
Safe System approach A road safety strategy focused on how elements of the road transport system combine and interact with human behaviour to produce an overall effect on road trauma. The Safe System comprises safer roads and roadsides (infrastructure), safer speeds, and safer vehicles. The approach accepts that humans will make errors and that the system must therefore account for the physical tolerances of humans in crashes, to avoid death or serious injury in the event of a crash (Woolley et al., 2018).
Survivable speed The speed at which a person is likely to survive a crash. The speed varies according to the type of crash (Wramborg, 2005).
Traffic Calming Measures Any traffic sign, road marking, traffic signal, or other device, placed or erected under public authority for the purpose of regulating, directing, warning, or guiding traffic
Traffic Induced Ground Vibration (TIGV) The ground vibration caused by vehicles travelling the road.
Vertical Device Treatments involving vertical displacement to influence vehicle speed through vehicle occupant discomfort; includes speed humps, speed tables, and short lengths of raised paving
Vulnerable Road Users (VRU) Road users vulnerable in respect to their level of protection in traffic (e.g., pedestrians, cyclists, non-motorised road users, motorcyclists) or degree of mobility (e.g., the young, the elderly, people with disabilities or special needs)
Zebra Crossing A type of pedestrian crossing where pedestrians have right of way over the vehicular traffic, indicated by regulatory signs and a series of short wide longitudinal lines marked side-by-side across a carriageway
Acknowledgements
The authors would like to acknowledge the contributions of Richard Batty, Chris Beasley and Andy Irwin for their invaluable data analysis of the bus trial study and their subject matter expert advice. The contributions of Dr Hamish Mackie for sharing his knowledge and for his continuous support. The encouragement and mentoring from Dr Fergus Tate. The support of Australasian Road Safety Conference 2022, 28-30 September, Christchurch, New Zealand. Auckland Transport in allowing this paper to be presented.
Author Contributions
Irene Tse was responsible for identifying the underlying issue of high crash rates at existing zebra crossings and developing the strategy to improve safety. She initiated this programme and journey of introducing a raised zebra crossing programme in Auckland. Amit Patel was Project Manager for the delivery of 37 raised crossings as part of the MAPI programme. Amit also set up and undertook the field test of the different table profiles. Andrew McDonald was responsible for the raised platform literature review, and the investigation into raised platform profiles. This included a measure up of a sample of existing raised platforms and measurement of vehicle speeds across raised platforms. He also undertook the chi-square analysis. Dr Michael Blewden and Sienna MacArthur-Beadle assisted with the preparation of this paper. Note that the views expressed in this paper are those of authors. All authors have read and agreed to the published version of the manuscript.
Funding
The MAPI programme was funded under the Waka Kotahi NZ Transport Agency National Land Transport Programme, with contributions from the Regional Fuel Tax.
Human Research Ethics Review
Auckland Transport did not require ethics approval for any part of the MAPI research and evaluation programme.
Data Availability Statement
Data are not publicly available.
Conflicts of interest
The authors declare there are no conflicts of interest.
Article History
This peer-reviewed paper was first submitted as an Extended Abstract and a Poster Presentation was recommended by two reviewers at the 2022 Australasian Road Safety Conference (ARSC2022) held in Christchurch, New Zealand 28-30 September 2022. The two reviewers also recommended that the Extended Abstract be expanded into a ‘Full Paper’ and undergo further peer-review as a journal submission by three independent experts in the field. The Extended Abstract is published in the ARSC2022 Proceedings. This ‘Full Paper’ version is being reproduced here with the kind permission of the authors and will only be available in this edition of the JRS.