


Introduction
In growing cities such as Melbourne, progressive changes to land-use, accompanied by increased population densities and rising affluence have led to rapid transition to higher density living. This has resulted in reallocation of road space to other modes and uses and intensified the people-vehicle interactions within a fixed space. Travel and consumption per-capita (including reliance on goods and services delivered to wherever we are) have increased, placing more stress on the existing road network (supply) which has not grown proportionally to travel (demand).
Over the past 15-20 years, traffic has doubled on urban motorways (Vehicle Kilometres Travelled or VKT). Over this period, arterial roads, with minimal increases in supply, are more congested shifting a considerable portion of the traffic growth, land use and business and industrial development activity and cross-city accessibility to the motorway network. Today urban motorways carry greater than 40% of urban arterial road travel (VKT) but comprise just 7% of the arterial road network (lane kilometres).
The nature of road transportation has changed considerably over recent decades and will continue to change in the future as road transport systems evolve and mature, placing them under more stress. The urban motorway network services the Melbourne metropolitan area and provides Victorians with direct connections to regional areas, other states, and international destinations via roads, ports, railheads and terminals. Due to local road congestion (less apparent 20 years ago), urban motorway networks now play a major role in arterial road travel connecting suburbs and neighbourhoods. These context changes place the motorway system under additional pressure, and when systems are under pressure, they fail in ways not previously anticipated.
The broader context to understanding motorway crashes in Victoria is that fatalities have declined markedly since 1970, although they have plateaued in recent decades. Today much smaller reductions in deaths and injuries are being realised than predicted by road safety strategies and forecast target reductions have not been achieved. This paper suggests increases in casualty crashes and hospitalisation can be explained by changes in driving context, seen in micro-level traffic “flow” metrics, revealing increasing driving task complexity and higher driver cognitive load.
Crashes Occur Everywhere on the Motorway Network
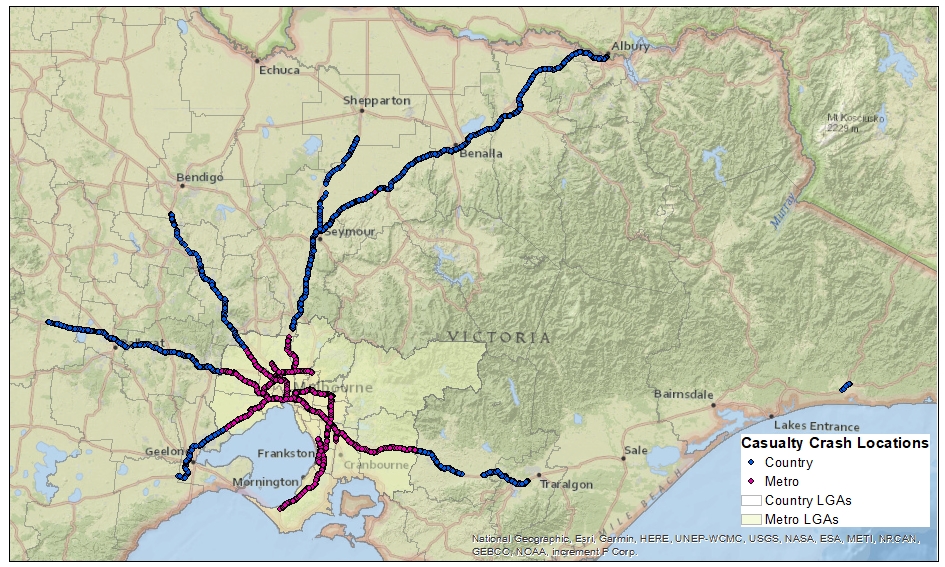
Between 1987 (when locational crash data became available) and 2021, over 22,000 unique motorway (mainline and ramps) crash locations have been added to Victoria’s crash database (Figure 1). Between 800 and 1,000 new motorway crash locations are still being added each year and most crash locations are random (Hovenden & Liu, 2020) with much of the Victorian motorway network covered in crashes. Often it is temporal conditions, especially dynamic traffic conditions at the time, rather than geometry or road conditions that trigger motorway crash sequences. Adverse traffic conditions are not limited to urban areas as rural motorways today also carry markedly increased traffic volumes.

Urban Motorway Crashes are Rising
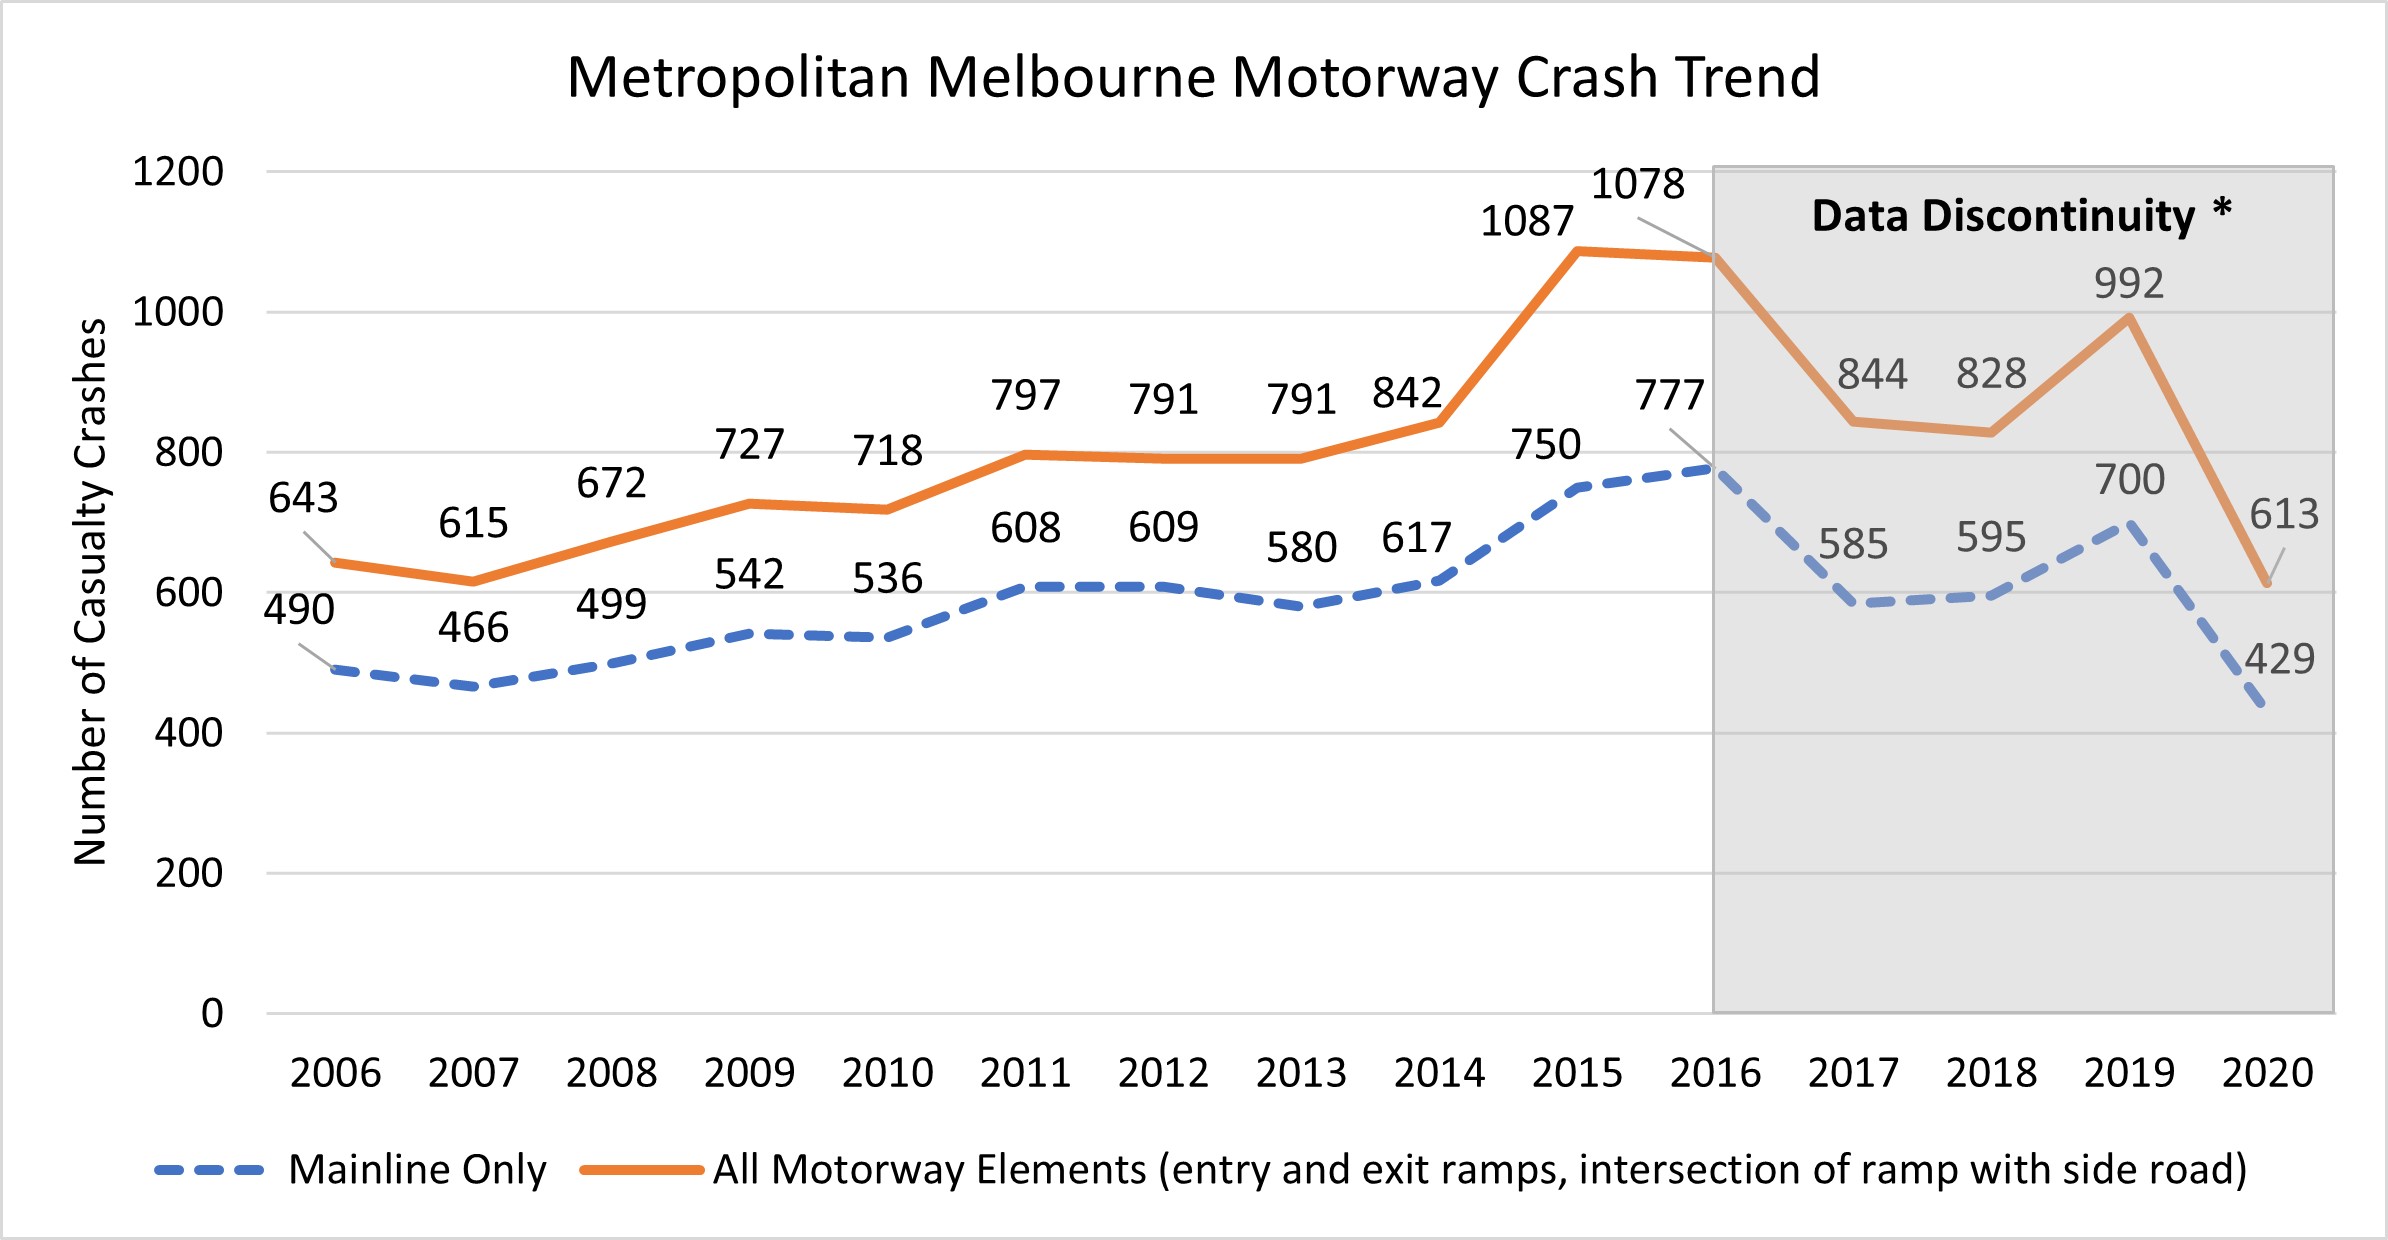
Casualty crashes on Melbourne motorways have increased by 68% from 643 in 2006 to 1078 in 2016 (Figure 2). On mainlines, this increase was 59% (from 490 to 777). The increase on arterial roads over the same period was only 9% (Gaffney & Hovenden, 2023). The paradox for urban motorways is whilst crash numbers are rising, actual crash rates are falling, due to rapid growth in demand (VKT) masking the safety problem and highlighting limitations of certain metrics.
.jpg)
Victorian crash data show crashes on urban motorways (particularly on mainlines) tend to be more severe than on urban arterial roads, 42% motorway mainline crashes were fatal and serious injury compared to 39% of arterial road crashes between 2014 and 2018 (Gaffney & Hovenden, 2023). The proportions of common crash types and how these crashes occur have changed over time. Strong evidence is emerging that today’s road safety problem involves complex mechanisms of crash causation (Hall et al., 2018; Hovenden et al., 2020; Papazikou et al., 2019).
Whilst crash rates on urban motorways are relatively low compared to other roads, their high utilisation means the number of crashes is a significant problem, rising against the urban trend. This appears to be a global trend, especially on multi-lane or divided roads, where crash numbers rose as traffic “flow” increased (Gaffney, 2018; Kononov et al., 2012).
“Flow” (rate per hour) is often confused with traffic volume (count over specified time-period). Annual or daily traffic volumes do not inform about “flow” where micro-conditions occur elevating crash risk. Traffic volumes have long been used inappropriately as a predictor of road safety outcomes (hence the wide range of research findings). Researchers will find that greater understanding of crash risk emerges by analysing sub-one-minute “flows” consequential to the context changes discussed below.
Motorways are the most heavily trafficked roads in the broader urban arterial network (Gaffney & Hovenden, 2023). They are generally built to the highest safety standards, having divided carriageways with restricted access and are perceived as being safer than other roads based on crash rates. Whilst this may be generally true, at certain times of the day, this is not correct as casualty crashes rise 5-6 times under certain traffic “flow” conditions (higher-density/lower-speed oscillating conditions) (Hovenden et al., 2020). To move annual road deaths towards zero and reduce serious injuries and casualty crashes, focus is needed on the 14% of all casualty crashes that occur on urban motorways.
The aim of this paper is to raise awareness that due to complexities within traffic “flow” motorists today have increased exposure to higher density conditions. Motorists need to drive closer together for longer periods of time, making the driving task more difficult. This leads to increases in motorway crashes and growth in certain (predominant) crash types. Understanding these factors can lead to better road design, operational practices and education.
Methodology
Melbourne’s managed motorway system controls traffic “flows” every 20 seconds across the network to provide efficient and stable traffic “flows”. These decisions are based on real-time data which are fed from “The InfraRed Traffic Loggers” (TIRTL). TIRTL data loggers measure vehicle event data using infrared-light beams capturing very precise attributes of traffic “flow” (CEOS, 2019; Hall et al., 2018). These data loggers are typically spaced every 500m along each carriageway. Analysis in this paper used data from loggers on the Monash Freeway. Each TIRTL generates upwards of 100,000 unique vehicle records per day and, depending on the length of the vehicle, up to 160 data attributes for each record.
Analysis of headway, clearance, speed and vehicle footprint was based on data from site T0504 (Monash Freeway inbound, near Stephensons Road, 12 September 2019; sample size 95,435) and site 14071 (Monash Freeway outbound, east of Gladstone Road, 26 November 2019; sample size 93,830). These sites and days are typical of traffic on urban motorways. Additional TIRTL sites were used for vehicle length analysis.
To investigate density conditions, clearance was plotted against vehicle speed. The number and percentage of vehicles travelling at clearances corresponding 0 to 0.5 sec, 0.5 to 1.0 sec, 1.0 to 1.5 sec, 1.5 sec to 2.0 sec and >2.0 sec, were calculated for all hours of the day. This was done at carriageway level and for each lane. Clearances and headways were plotted against time of day. Spacing between vehicles was plotted against the number of vehicles per lane kilometre.
To illustrate complexity and dynamic nature of traffic, variations (oscillations) in time gaps between vehicles were plotted by time of day. Variations in one-minute vehicle speeds and the longitudinal and lateral distribution of vehicle speeds were plotted. These showed carriageway speed, including lateral movements within and between lanes.
To investigate vehicle size and visibility, the angle of view (degrees) blocked by the leading vehicle was calculated for various following distances using two standard widths (heavy vehicles 2.5 m, passenger cars 1.8 m). The distribution in vehicle area, calculated by vehicle length multiplied by axle width, and the average area of vehicles per time of day were plotted. Variations in commercial vehicle lengths by time of day versus commercial vehicle percentage and rolling average vehicle length (midweek) for various TIRTL sites were calculated and plotted.
To understand how context changes and complexity have impacted crashes, casualty crash data were analysed on metropolitan Melbourne motorways. Crash data were sourced from the Victorian Government Department of Transport and Planning’s (DTP) Road Crash Information System (RCIS). Changes over time in crash numbers, crash types and single-/multi-vehicle crashes were investigated. In-depth analysis of several crash data fields, including the Police Description field, was undertaken to identify contributing factors. Date ranges were chosen to avoid the impact of data discontinuities. Although both crash numbers and crash rates are important when analysing crash data as they show different aspects of the problem, the majority of the analysis in this paper used crash numbers. Motorway crash rates analysis is an opportunity for further analysis. However, care is needed as high exposure hides the true extent of the problem.
Results and Discussion
Over the past 20 years there have been many gradual and subtle changes to roles and usage of urban and peri-urban motorways (Table 1). Although these impact road safety outcomes across the state, their contribution to increased crash risk has not been fully appreciated.
Moderately- to heavily-trafficked or congested roads are becoming typical in daytime urban and peri-urban driving and these conditions now occur seven days a week. Under conditions where road users continually compete for every square metre of road space, crash risk increases. As “flow” and density rise, there is reduced longitudinal and lateral clearance between vehicles, with drivers having less space to take evasive action (e.g., smoothly lane-change, manoeuvre, stop) to avoid a crash in emergency stopping situations.
Drivers must anticipate a wide range of complex situations that can suddenly arise on a motorway journey, more so now than in the past. In heavy traffic conditions drivers use a wide range of mental resources which over time accelerate fatigue, particularly at the end of a long day or after a period of stressful or tiring activity. The amalgam of fatigue and complex conditions (high “flow” and high density, requiring high cognitive load) can lead to minor errors of judgement and/or slower than usual reaction time. Crash risk is exacerbated when less empty road space (longitudinal and lateral gaps between vehicles) is available, reducing room for error (Hauer & Kononov, 2018; Hovenden et al., 2020; Kononov et al., 2011, 2012). With peak spreading, gaps between vehicles are very small for longer periods of the day. When these human conditions and complex driving situations converge, disproportionate consequences can result. We illustrate the many driver actions simultaneously required when driving, especially in moderate to heavy traffic conditions (Table 2). Driving task complexities are discussed in Groeger (2000) and NCHRP (2012) and seen in naturalistic driving studies (Papazikou et al., 2019).
Urban driving conditions can make high demands on the driver’s cognitive resources when empty road space reduces markedly. With increased traffic “flow” and rising density, and/or as vehicles get larger, gaps between vehicles fall below the distance travelled during the driver’s reaction time. Drivers’ reaction times vary and can be affected by the context that drivers face (Markkula et al., 2016). Braking efficiency also needs to be considered in the overall stopping distance (Zurlinden et al., 2022) which varies from vehicle to vehicle. Differential braking efficiency between consecutive vehicles can result in dangerous situations if the vehicle behind has less braking efficiency than the vehicle in front (e.g., truck following car).
Motorway traffic volumes have doubled over the past two decades. Many sections of Melbourne’s motorways carry more than 180,000 vehicles/day. Several sections have peak weekday volumes greater than 220,000 vehicles/day. The increasing volume over the day results in extended periods of high “flow”, high density traffic leading to complex traffic phenomena. These include multiple simultaneous interactions between nearby vehicles (merging, lane changes), commonly occurring within sudden “traffic state” changes, nucleations or shockwaves. Growing exposure to these conditions creates increasing numbers of close interactions or measurable events (Gaffney & Hovenden, 2023), requiring drivers to continually modify their behaviour in response to other vehicles, and elevating crash risk. Increasing exposure provides a plausible explanation for rising motorway casualty crash numbers. Despite the increasing evidence and knowledge of traffic “flow” dynamics (forward and backward moving longitudinal waves), only a limited range of traffic “flow” metrics (volume, speed) are used. The use of these aggregated metrics masks the true complexities drivers face seen in vehicle events and sub one-minute data (density, spacing, headways).
Increased competition for road space has direct consequences for safety as human capacity has limitations. When driving in short headways, both vehicles and drivers operate near their practical limits. Sight distance is generally only available to the vehicle immediately in front, often shorter than the distance travelled during the driver’s reaction time. These conditions increase the likelihood of drivers misjudging stopping distance, making mistakes or responding too slowly. The dynamic nature of traffic “flow” means that available space for emergency stopping is adequate one second but disappears in the next second (due to sudden braking, lane changing, speed differentials of other vehicles).
Compounding this further, the mix of lighter vehicles with larger, heavier vehicles creates considerable differentials in braking distances and manoeuvrability when emergency braking or stopping situations arise. When the driver and/or vehicle in front has a quicker reaction time or shorter stopping distance than the driver and/or vehicle behind, crashes can occur. These conditions often occur simultaneously with backward moving shockwaves and/or nucleation events as they are more difficult for larger, heavier, and less stable vehicles to negotiate. Whilst crashes are mostly avoided by hard braking and manoeuvring within the available empty road space, braking distance is not uniform across the driver population nor the vehicle fleet.
Within higher density traffic “flow”, many things can occur simultaneously, causing conditions which vehicles and humans at times cannot anticipate or negotiate safely, including:
-
Short headways, gaps, clearance (especially when shorter than reaction times);
-
Sudden “traffic state” changes;
-
Emerging blind spots, changing second-to-second in mirrors and peripheral vision, especially in oscillating traffic conditions;
-
Restricted lines-of-sight/visibility of events unfolding ahead (reduced in high traffic “flow”);
-
Oscillating traffic “flow” produced by backward moving shockwaves (stop-start), nucleations and forward moving waves (creating density spikes as faster vehicles catch slower vehicles);
-
Increased exposure to lane changing (into smaller gaps). The need for lane changing is a function of shorter trips (higher turnover) and is growing as local trips now rely on motorways. More lane-changing is also necessary to fill wider carriageways to capacity.
These can all occur simultaneously, adding to driver workload and actions beyond the background conditions (Table 2). All generally occur in high “flow”, high density conditions, different to those drivers usually encounter in everyday driving. Many drivers have either limited experience or avoid crashing by hard braking with no lasting learning. In some commonly occurring situations, the temporal conditions are beyond what a modern vehicle can achieve even with advances in vehicle safety systems.
Consequences of Increased Exposure to Higher Traffic Flows and Density
Growth in population and road travel, combined with minimal additional road supply, has increased the annual exposure to high “flow” and high density. When traffic “flow” reaches critical levels, sudden dangerous “traffic-state” changes occur regularly and exposure to these events increase (Gaffney & Hovenden, 2023). Exposure to these critical levels is gradually increasing over time, often under the banner of “sweating the asset”. “Sweating the asset” also “stresses the asset and the drivers” resulting in higher crash risk. The number of crashes and vehicles involved increase as traffic “flow” increases (Gaffney & Hovenden, 2023). These findings broadly align with Hauer and Kononov (2018) who found multi-vehicle crashes are associated with increasing vehicle “flow”. At “flows” of around 1,300-1,400 vehicles/h/lane, where Level of Service (LOS) is high, crash rates increase rapidly (Gaffney & Hovenden, 2023).
In “uninterrupted traffic flow” operating near capacity, traffic can become chaotic and/or suddenly change “traffic-state”. This commonly causes oscillating traffic conditions, varying from lane-to-lane, where traffic in a single lane can suddenly jam up and stop, requiring emergency braking. These events occur thousands of times each day, clearly seen in fine-grain data, with most resulting in un-reported near misses or minor collisions. Some result in casualties, with a small proportion resulting in fatalities or serious injuries.
In previous decades more hours of the year occurred in low “flow” conditions, generally providing adequate empty road-space per vehicle to absorb driver errors when disturbances occurred. It is the availability of empty space that provides the safety margin to brake and steer to avoid crashes. As “flow” increases beyond a certain limit, spaces (longitudinal and lateral) between all vehicles in the carriageway reduce below a critical distance, around the point where the clearance/speed function changes shape (around or below 70 km/h), creating conditions for which driver/vehicle combinations cannot consistently achieve (Gaffney & Hovenden, 2023).
For over 90 years “uninterrupted traffic flow” theory has been studied and commonly represented by continuous or discontinuous curves (fitted to point clouds) with or without “phase transitions”, using three fundamental diagrams (Gaffney & Hovenden, 2023). Fitted curves mask the numerous connections between consecutive points. Point clouds represent the range of real values. Detail within point clouds reveal the complexity drivers face (Gaffney & Hovenden, 2023).
The simple equation behind these relationships is (Flow = Speed x Density). The fundamental diagrams inform us that as “flow” (independent variable) rises, speed (dependent variable) declines and density (dependent variable) rises. As density rises, spaces (time and distance) between consecutive vehicles reduce. At certain “flow” values, these spaces (occurring at reduced speeds) decrease to the point where driving gets subtlety more complex and difficult especially on multi-lane facilities.
“Uninterrupted traffic flow” is more complex than described by these relationships. Less commonly seen is the fourth fundamental relationship linking clearance and speed (Gaffney & Hovenden, 2023). A fitted curve would show the clearance-speed relationship is exponential, revealing a rapid transition (inflection point) as speeds reduce below 75 km/h. Near the inflection point, drivers get caught out, as conditions change from adequate to inadequate emergency stopping space. Within a small portion of this relationship (70-50 km/h), as speed slows, the time gap between vehicles reduces below drivers’ ability to judge a safe distance. Hence at lower “flow”/low-density, clearances are generally adequate to facilitate safe driving despite higher speeds. Drivers have difficulty perceiving the subtle and constantly changing crash risk, as during disturbances clearances often momentarily reduce below what is safe.
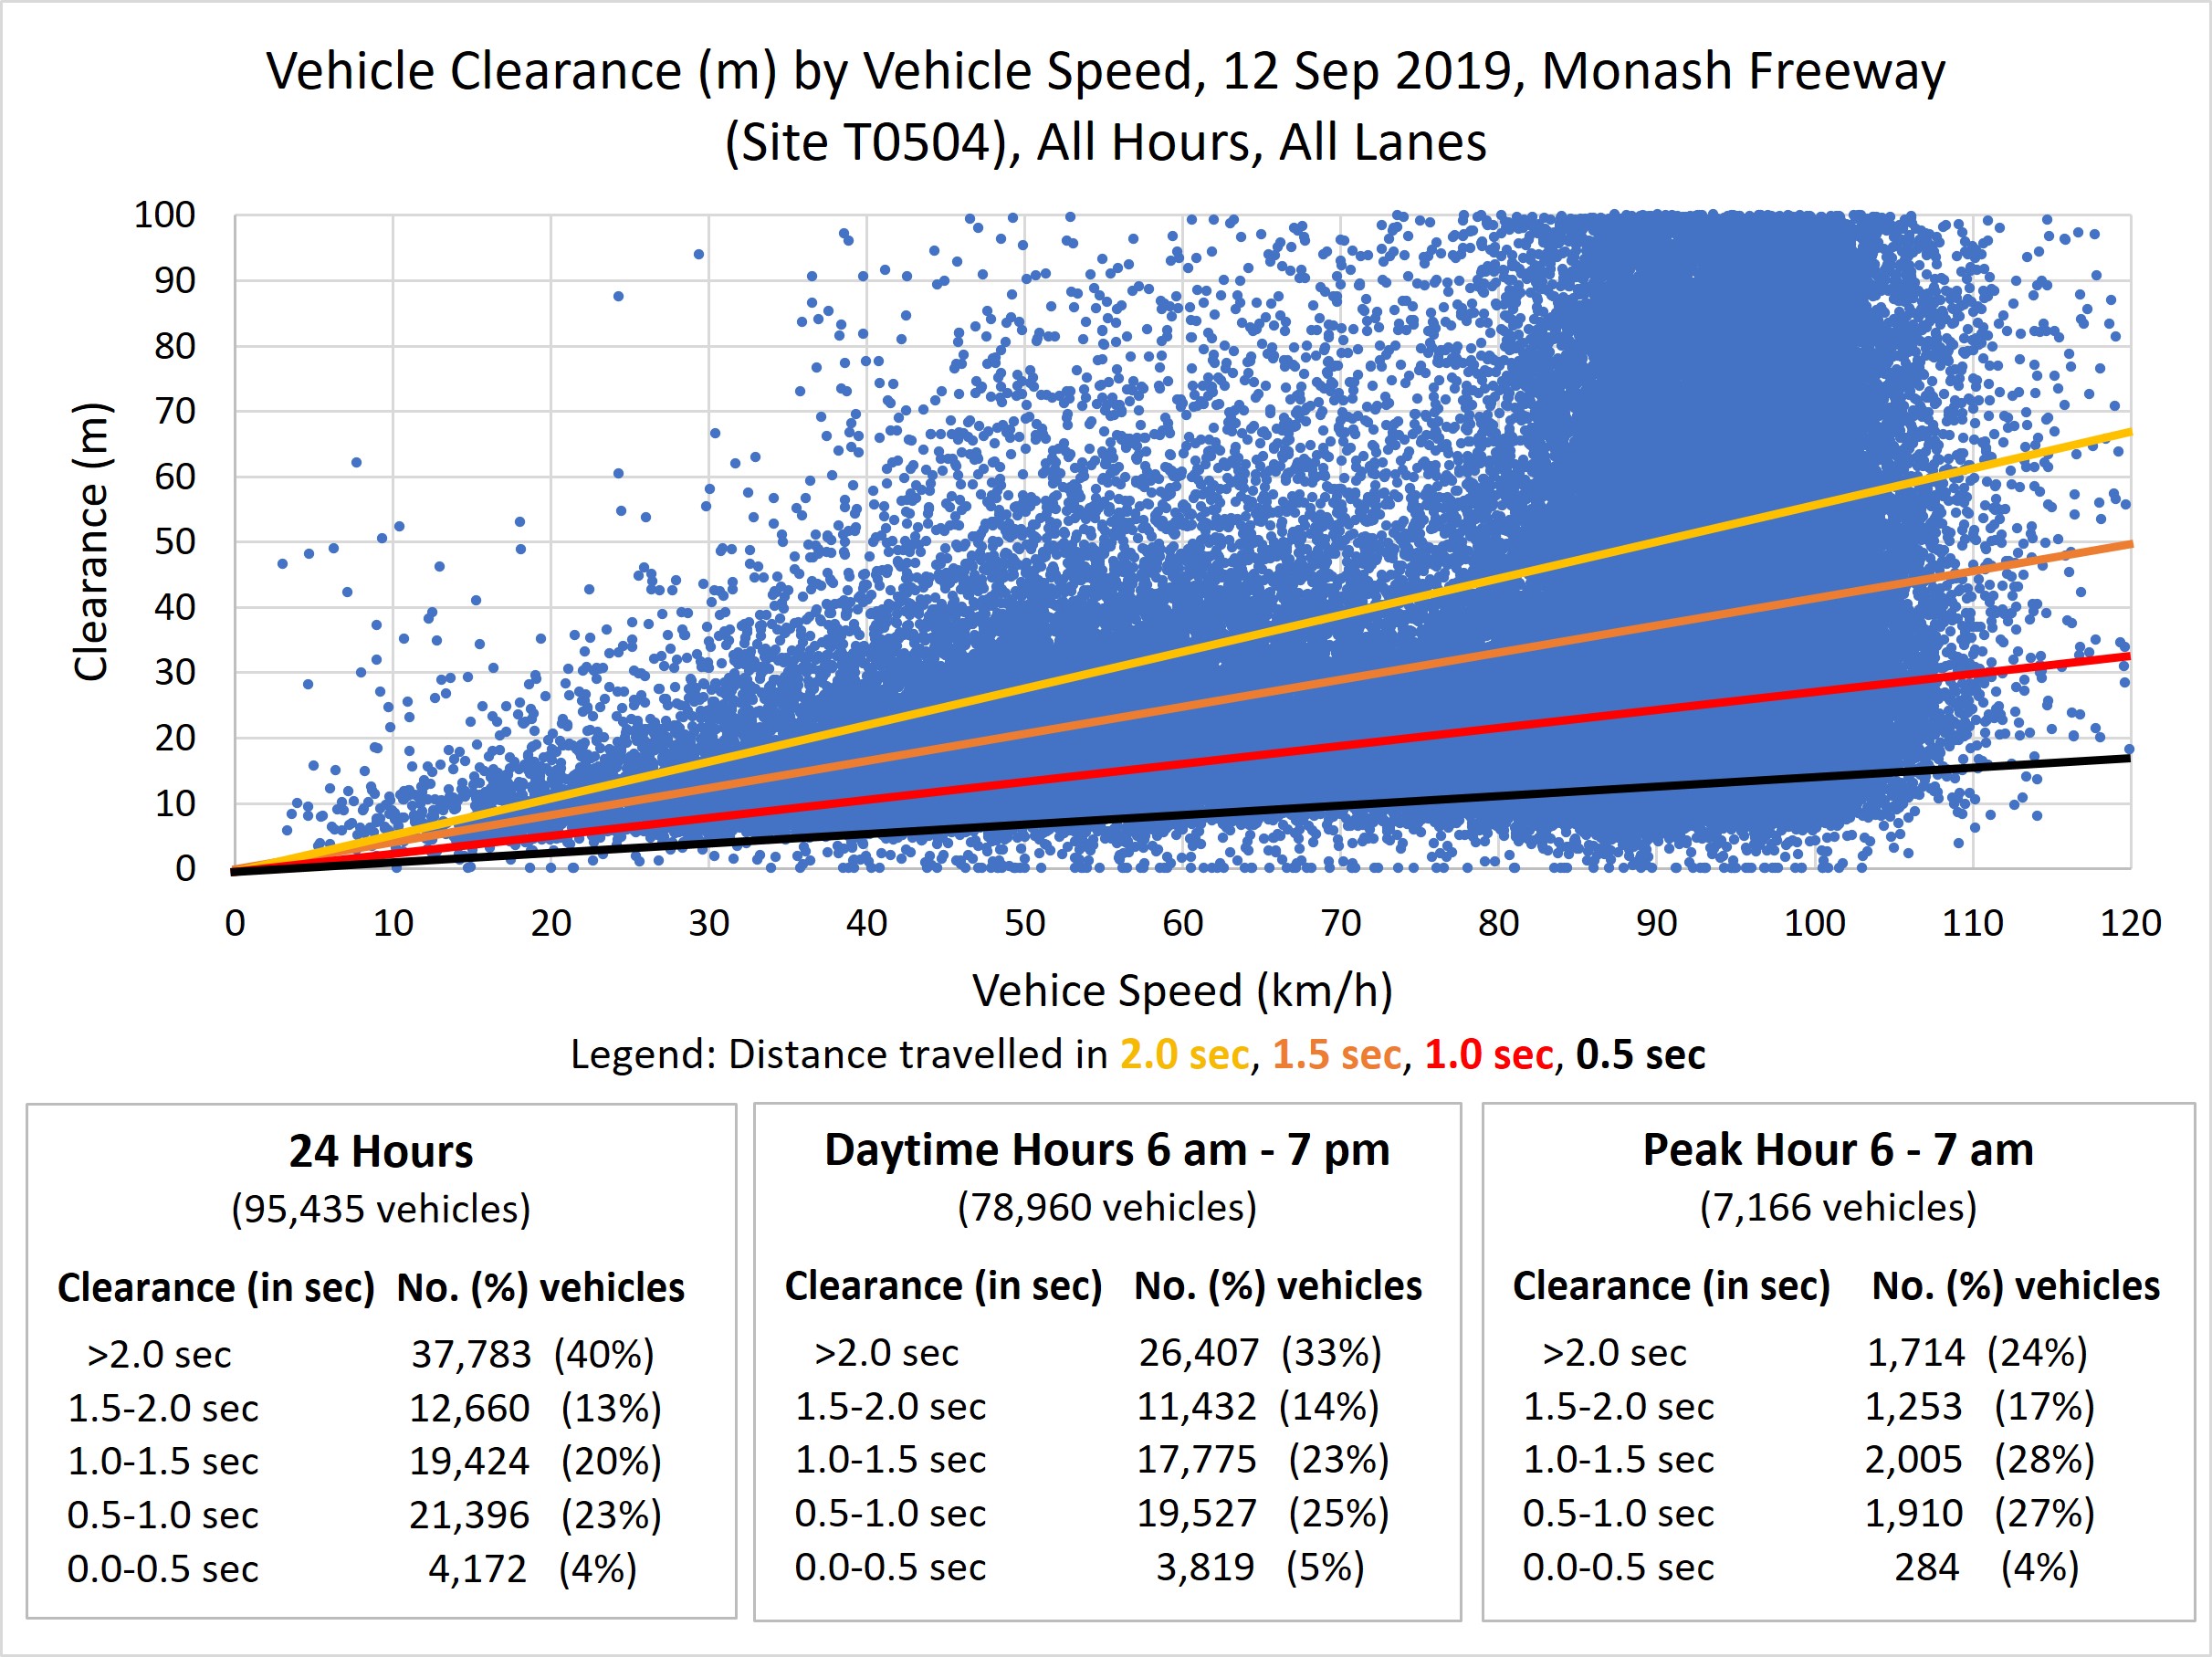
Figure 3 shows large numbers of vehicles travelling with clearances below what is recommended for safe driving (two-second rule-of-thumb – yellow line). Over 24 hours most vehicles (60%) are below this threshold. This percentage is even higher during daytime hours (6 am-7 pm, 67%) and in peak hours (e.g., 6-7 am, 76%). When clearances get small any “flow” disturbance elevates crash risk. These disturbances are the main trigger for nucleations and shockwave sequences. Examination of clearance/speed by lane shows each lane behaves differently with respect to transitions near the inflection point, much sharper in some lanes requiring drivers to abruptly modify behaviours to avoid crashes (Gaffney & Hovenden, 2023).

Figure 4 illustrates the dynamic and heterogeneous nature of traffic “flow” for a 10-minute period for one middle lane on the Monash Freeway (typical of urban motorway “flow”). Many vehicles have headways and clearances much shorter than what is considered safe (2 seconds).
_and_clearance_(bottom)_over_a_10-minute_period__(5_10_pm.jpg)
Headways (seconds) and spacing (metres) constantly change (Figure 5). Individual vehicle headways can get very small, well below the averages often implied by LOS calculations or specified for safe driving. Short headways and spacing are particularly dangerous when headways are lower than reaction times (Figure 6). The worst situations occur when “flow” (and density) rise and average speed naturally reduces to around 20-40 km/h below the speed limit (Hovenden et al., 2020). In peak periods, when average speed varies between 50 and 70 km/h, densities are above 25 vehicles/km and spaces between vehicles are less than 33 m. Crash risk rapidly increases around this point as reaction times suddenly become greater than the space between vehicles, further exacerbated when lane changes suddenly split these spaces in half. In an emergency stopping situation it is common that the leading vehicle braked extremely hard, giving the following driver no advanced warning. Australian vehicles do not generally have “brake force display” systems where brake lights flash when drivers brake hard.
_in_the_time_gaps_(over_8_minutes)_between_cluster_of_vehicles_fo.jpg)

Adequate headways and spacings for maintaining safe driving conditions are a function of “flow”, where density and speed are dependent variables. For example, at a travel speed of 80 km/h the distance travelled during typical reaction times of 1.5 and 2.0 seconds is 33.3 m and 44.0 m respectively (Figure 6). This corresponds to densities of 26 vehicles/lane/km and 20 vehicles/lane/km respectively assuming all vehicles are homogeneously spaced (rarely the case). At higher densities, where distance between vehicles can suddenly become less than the distance travelled during a driver’s reaction time and sudden disturbances occur, there is a four- to six-fold increase in crashes. Most of the crashes (predominantly rear-end, lane change and side swipe and run off road) are symptoms of the same mechanism, yet often considered to be separate safety problems.
Analysis of clearance and headway data on Monash Freeway near Stephensons Road found that shorter clearances occur in the morning peak (6-9 am) and shorter headways occur in counter-peak direction in the afternoon (5 pm). From 7-9 am, >50% of clearances are less than 20 m and at 5 pm around 30% of headways are below 1-second with 50% below 1.5-seconds (Gaffney & Hovenden, 2023). When operational parameters are understood at the micro level, these variations in headway and clearance are expected. These parameters include origin-destination patterns (influencing lane change rates), speed, “flow”, density, geometry, and commercial vehicle content. The combined influence of these factors determines daily crash profiles (Gaffney & Hovenden, 2023). The high numbers of rear-end, lane-change and side-swipe crashes corresponds with the pattern of short clearances (Gaffney & Hovenden, 2023). These explain changes in casualty crash types over time (Figure 7).

LOS classifications imply “average density” (and clearances) between vehicles measured over a distance (a kilometre) (Gaffney & Hovenden, 2023). In operations this does not inform about the “distribution of densities” that occur within each kilometre (distribution of clearances and headways). Traffic “flow” on motorways, when observed through cameras or fine-grained traffic data, reveals a constant remixing of vehicles. Faster vehicles (lower density) catch up to slower vehicles (lower density), then cluster together (higher density), until the faster vehicles get past and move on ahead, again returning to lower density.
Higher density ranges of LOS D, E and F bring complexity to traffic “flow” dynamics. Within these ranges sudden density “spikes” are regularly observed (Gaffney & Hovenden, 2023), where “traffic state” changes occur, resulting in oscillating traffic “flow”, “flow” breakdown, nucleations and shockwaves. These phenomena cannot be easily predicted by what the driver observes immediately ahead in the traffic stream or has learnt from past driving experience. When severe forms of these phenomena suddenly appear out of relatively stable and smooth conditions, they increase the complexity of the driving task. These events are widely described in police crash records. Appreciation of these risks without available metrics has made it difficult for road safety practitioners to understand, measure and develop management strategies.
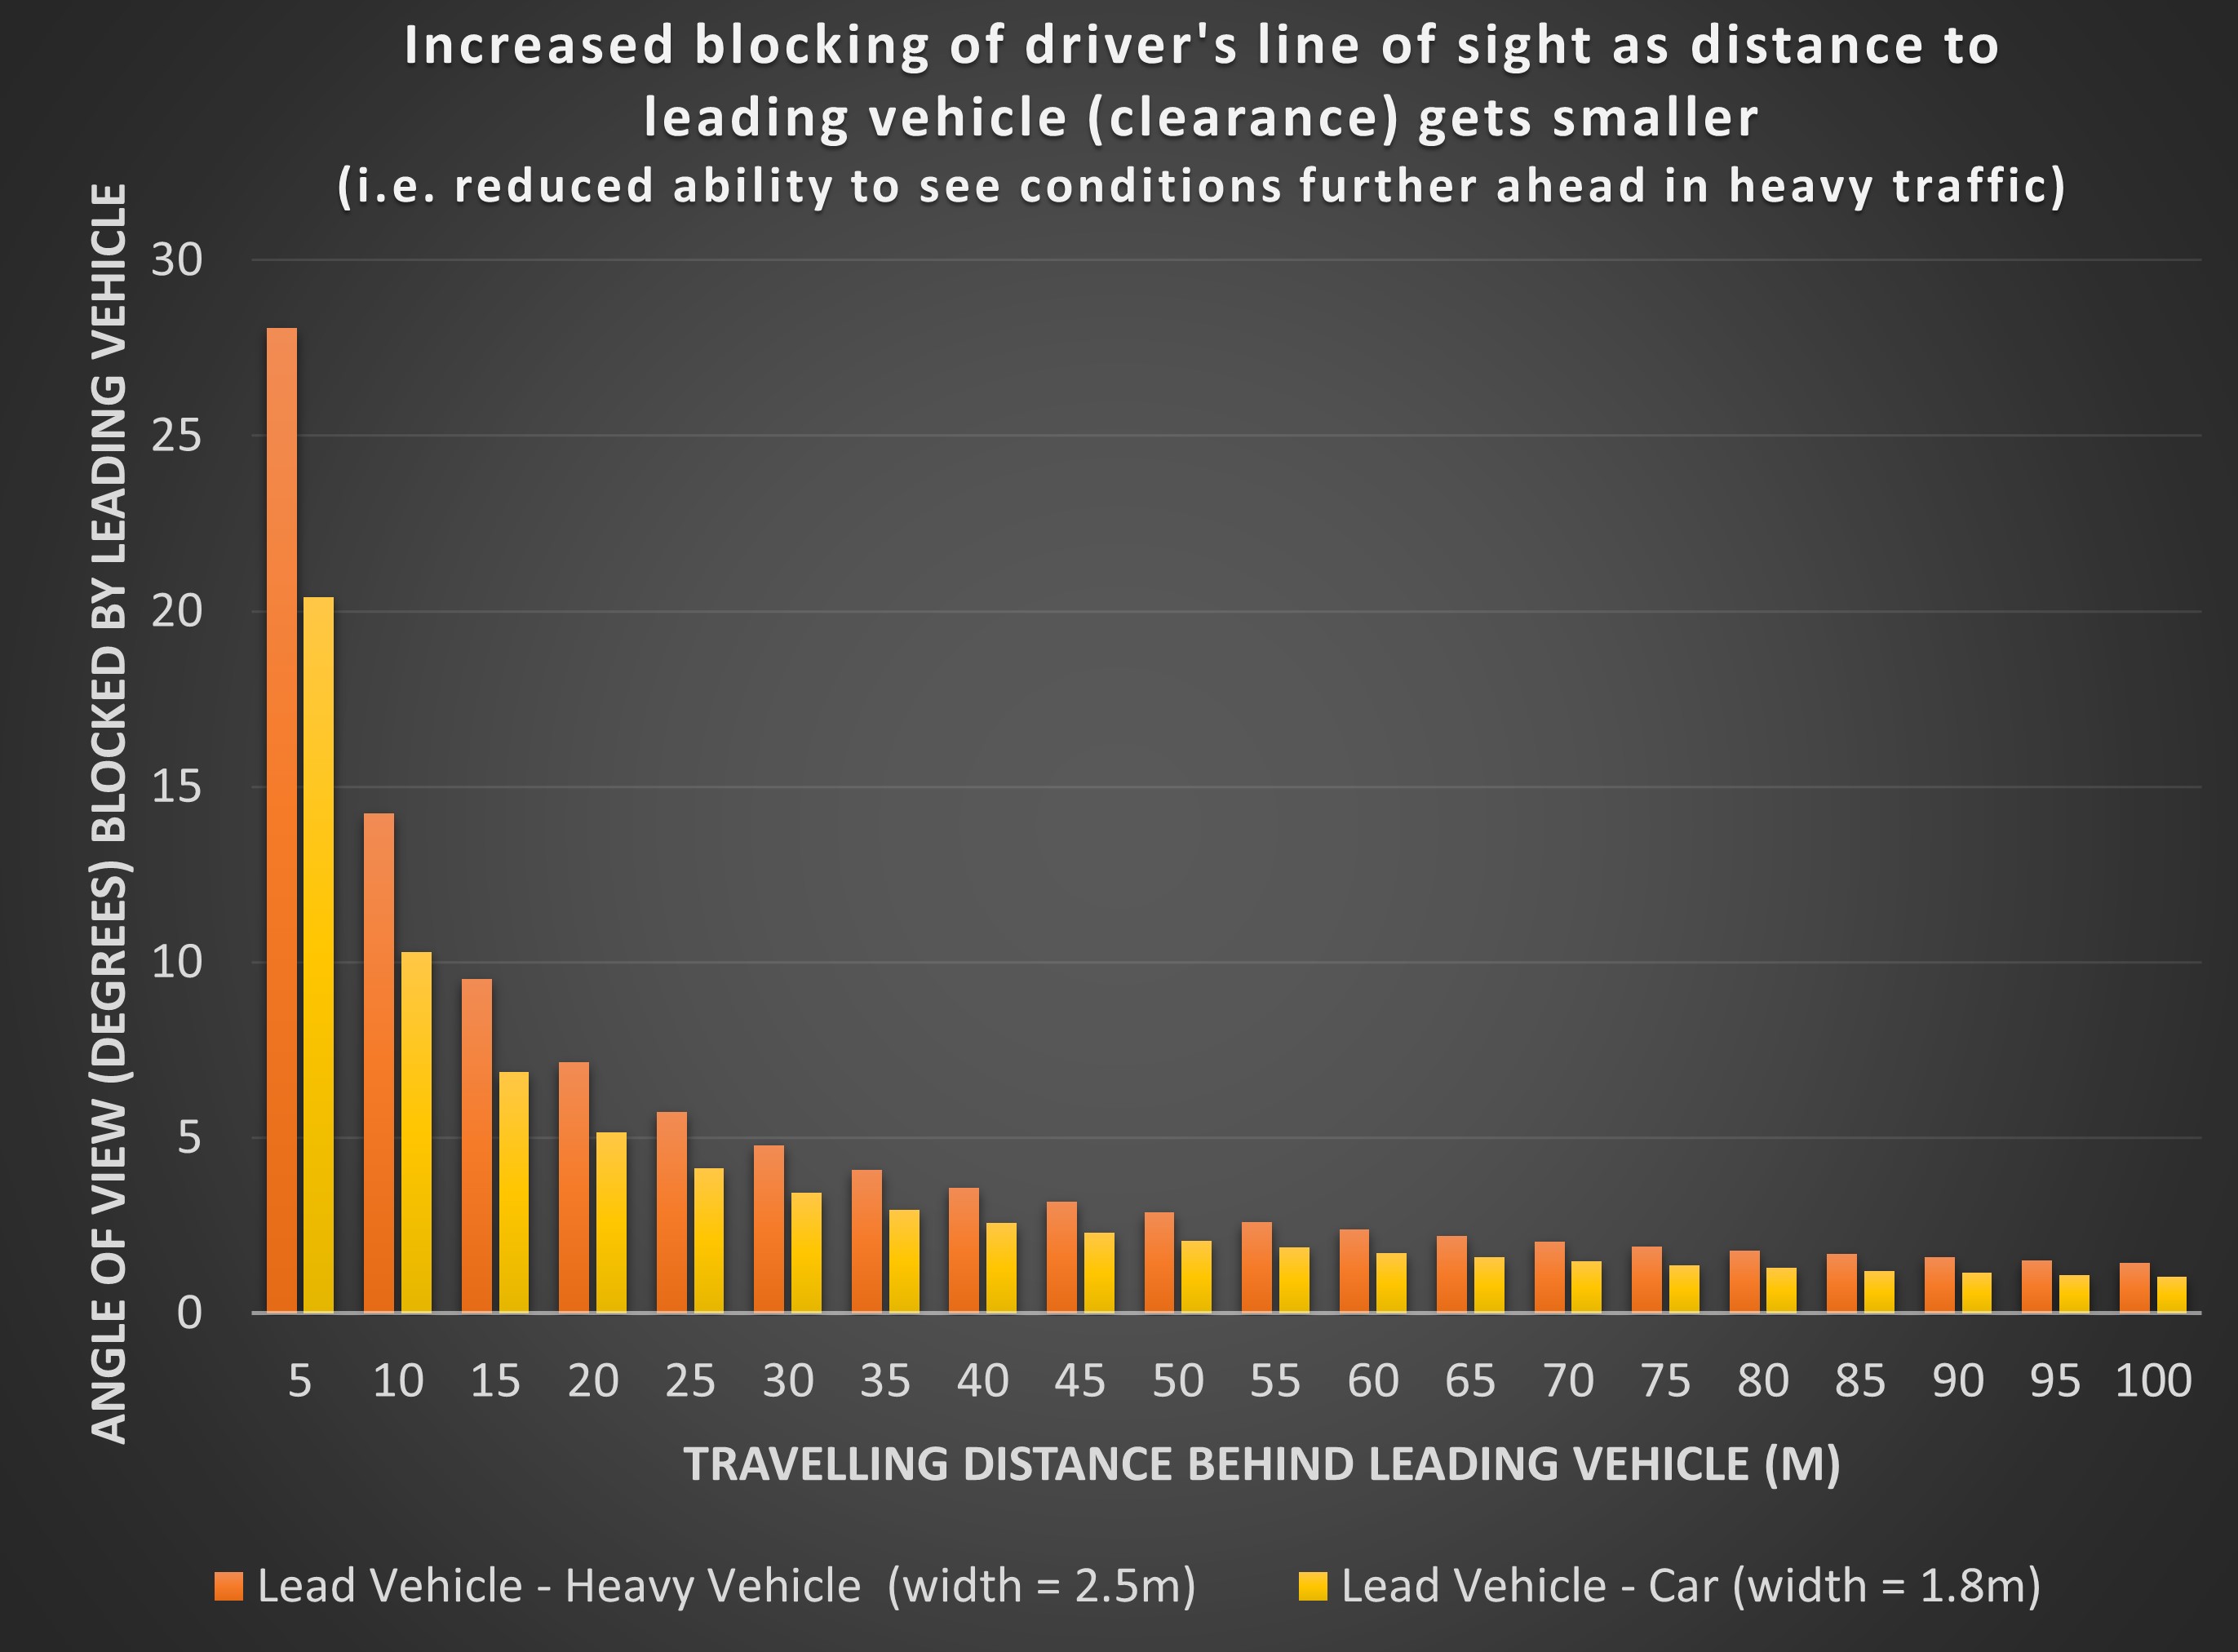
As speed increases a driver’s focus narrows whereby at 70 km/h the driver’s gaze tends to focus on a single point ahead (Palazzi et al., 2018). In heavy traffic conditions a driver’s vision is primarily focused on the rear of the vehicle immediately in front to maintain safe gap and lane position (Newell, 2002). Depending on the distance to the vehicle in front, and its size, the vehicle in front can obscure a large percentage of the information available for decision making. When vehicles travel further apart (50 m or more), the vehicle immediately in front blocks only a small angle of vision (less than two degrees) vital for decision making. As vehicle spacings decrease the blocked angle of view increases sharply (5-25 degrees of vision obscured) (Figure 8). The wider and taller the vehicle in front, the more restricted the view (especially of vehicles braking further ahead). If there are vehicles ahead in adjacent lanes the driver’s view ahead is further reduced by similar amounts.

Drivers’ views ahead are limited by the ability to see through the empty spaces between the lanes of traffic and/or above the roof of vehicles in front. Hence straight road alignments are more dangerous than curved alignments. In curved alignments vehicles ahead appear staggered (offset), opening up a driver’s view and allowing them to see disturbances unfolding, providing adequate warning of conditions ahead, allowing enough time to react. Traffic science shows disturbances usually occur 8-10 vehicles up ahead, out of view of the driver(s) who crashed, as vehicles further behind the disturbance are required to decelerate the hardest (Gaffney, 2018).
Traffic density (measured by surrogate occupancy) shows large variation and "spikes’’ in fine resolution data (Gaffney & Hovenden, 2023). At 20-second resolution, density spikes (where crash risk is highest) are seen. Spikes occur at different times in different lanes, seen clearly when "all-lanes’’ are superimposed. Analysts often use “carriageway averages” aggregated over long periods (1-hour) masking the complexity drivers face. Density spikes create “flow” disturbances, resulting in sudden emergence of localised congestion (low speed/high density), leading to sudden/hard braking. Although most crashes are avoided, some will occur.
Wider Carriageways Increase Exposure to Lane Changing
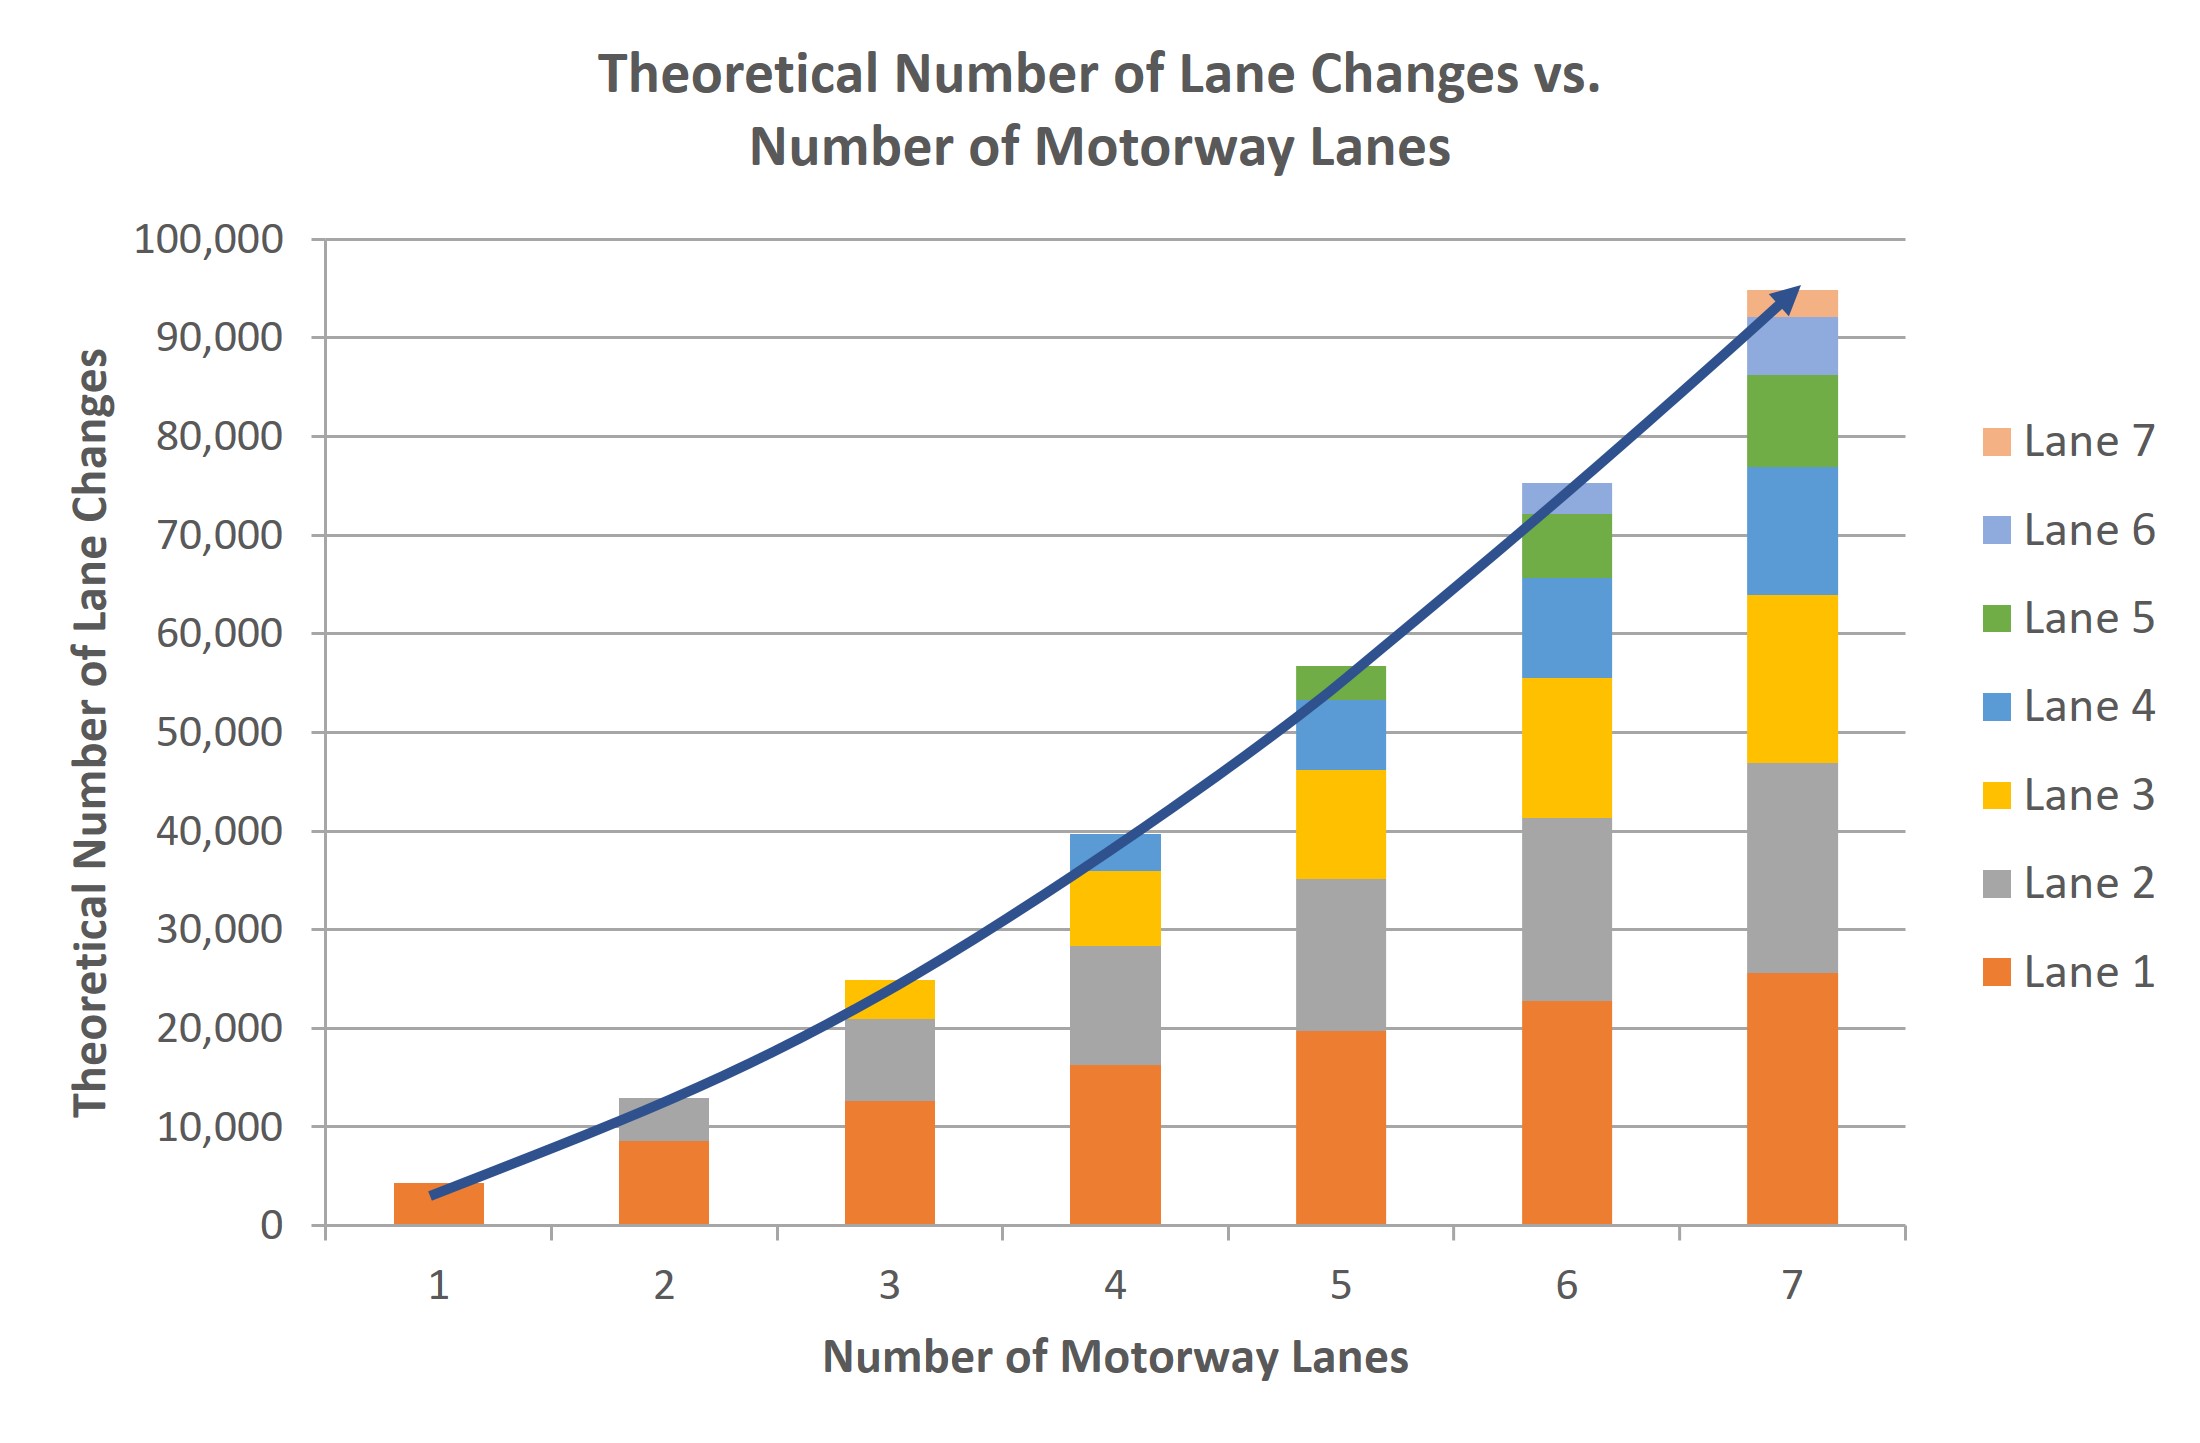
Wide carriageways generate increased turbulence requiring higher numbers of lane changes. There is a disproportionate (nonlinear) increase in lane changes as more lanes are added (required to fill all lanes to capacity) (Figure 9) (Hall et al., 2018). For an average trip length of 15 km (4-lane motorway, peak period) 40,000 LC/h (2667 LC/km/h) on average are required to service capacity “flows”.

Motorway carriageways in Australia are often upgraded by adding more lanes. However, this understanding of increased turbulence has identified new ways to design safer motorways with less internal friction. For example, two 3-lane carriageways have lower levels of induced lane changes than a 6-lane carriageway (2x 24,000 = 48,000 vs 74,000 respectively). The 3+3 lane carriageway has significantly higher sustainable capacity than 6 or 7 lane carriageways with lower crash risk (Gaffney & Hovenden, 2023). Each additional lane provides a disproportionate increase in possible conflict points (Gaffney & Hovenden, 2023).
Dynamics of Vehicle Size
Understanding vehicle length data is important for appreciating many aspects of “flow” and for understanding the complexity drivers face. Vehicle length influences traffic “flow”, with adjustment factors applied to capacity values based on heavy vehicle percentages. As Australia’s vehicle fleet is getting heavier, longer, taller, and wider, the impact on traffic “flow” stability is considerable, particularly regarding:
-
Physical road space vehicles occupy;
-
Associated gaps/spacing to maintain safe operations, and for lane changing (lane changing vehicles occupy two lanes for a considerable distance, reducing theoretical and operational capacity);
-
Longer acceleration and deceleration;
-
Swept path on a tight radius bends or when turning;
-
Restricted sight lines for following vehicles;
-
Time needed to pass or overtake, etc.
Substantial variations in commercial vehicle length occur over the day, demonstrating the high proportion of larger vehicles across the 24 hours, especially between peak periods (Gaffney & Hovenden, 2023). The resulting reduced empty space, both longitudinally and laterally, means that drivers have less room to maintain lane position or manoeuvre to other lanes and reduced stopping distance.
The average daytime (7:30 am-6:00 pm) vehicle length on urban motorways is five to seven metres. On Monash Freeway, commercial vehicles comprise around 18% of daily traffic. Vehicle mix is an additional, often overlooked, dynamic occurring within traffic “flow” affecting motorists. Heavier and longer vehicles take much longer distances to manoeuvre (lane change), accelerate, and stop.
Over a day there is a wide distribution of vehicle sizes when measured by the area of pavement a vehicle occupies (its footprint) (Gaffney & Hovenden, 2023). The low end of the vehicle area distribution comprises motor scooters, motorcycles, small cars, followed by larger cars, SUV, 4WD, utes, vans, towing vehicles, light rigid trucks up to large multi-articulated trucks (B-doubles etc). Large variances in vehicle area occur over the day (Gaffney & Hovenden, 2023). The smallest vehicle area (<8m2) occurs in the counter-peak direction around 5:15 pm-5:30 pm. The largest vehicle area (up to 15.5 m2) occurs overnight.
Dynamic Nature of Vehicle Speeds
Speeds are constantly changing, and motorists encounter a wide range which can suddenly change (Gaffney & Hovenden, 2023). Individual lane speeds compared in the same time series do not necessarily react simultaneously, nor are of the same magnitude. Sometimes the fast lane reacts first to “flow” disturbances, other times it is slow or middle lane(s). At times, lane disturbance spreads strongly from the triggering lanes to other lanes, other times the impact on other lanes is small.
Each lane shows quite different (oscillatory) patterns. A motorist in the act of changing lanes often must negotiate a “traffic state” change and a different shockwave form or strength in the lane they are moving into compared to the lane they moved from. This can be dangerous, especially when the receiving lane, at the point of the lane change, simultaneously experiences a rapid deceleration phase. In this situation, the gap in the receiving lane, which in the previous second was adequate, suddenly closes, requiring the driver to either brake hard or abort the manoeuvre.
Differential speed across the day adds another dimension to driver complexity, requiring continual speed adjustment in relation to other vehicles within the carriageway (Gaffney & Hovenden, 2023). Average differential speeds between the slow and fast lanes are typically 20 km/h or more, although temporal differential speeds are considerably higher than averages suggest. Faster lanes carry the higher “flow”, with less lane-changing friction and the slower lanes facilitate access to and from the motorway with higher lane-changing friction (Figure 9). Speed variability (oscillation) is greatest between 3:30 pm-6 pm (moving-average line) (Gaffney & Hovenden, 2023). Below 60 km/h, speeds typically become strongly oscillatory. This is where crash numbers are up to six times higher than background levels.
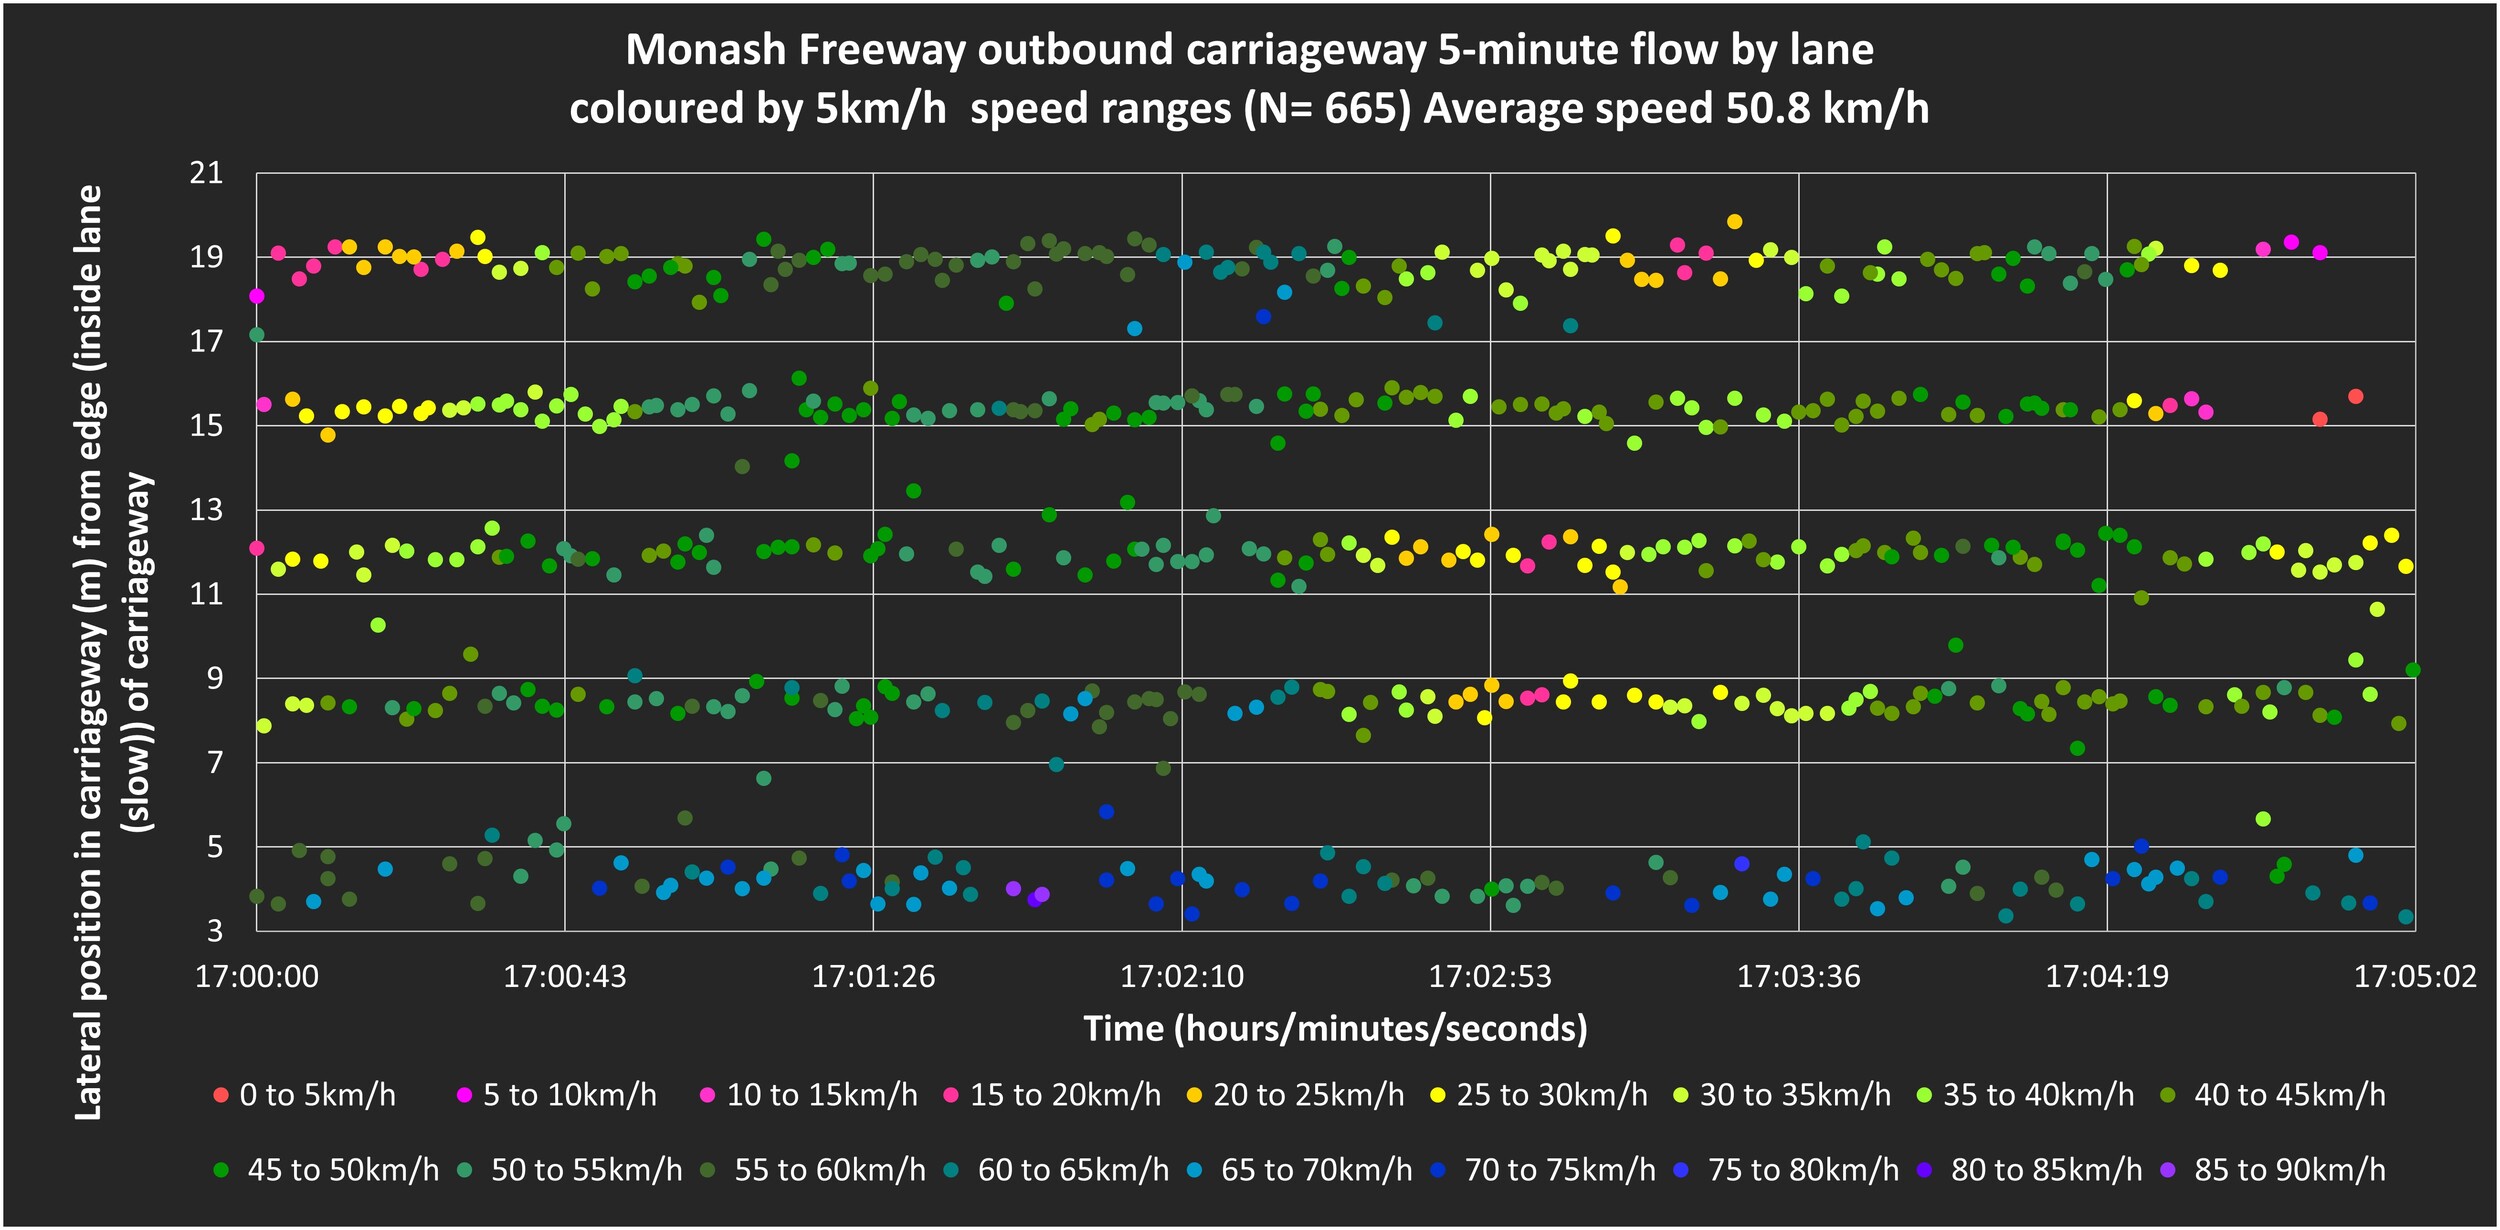
Figure 10 shows a five-minute period inside the afternoon peak, with 18 speed bins from 0-5 km to 85-90 km/h (665 vehicles/5min ~ 133 vehicles/min; average speed 50.8 km/h). This snapshot, typical of heavy traffic, shows the complexity within the traffic stream, including longitudinal and lateral spacing, vehicle clusters, and speed differentials, within and between lanes. It shows longitudinal and lateral positions of vehicles, revealing how drivers position their vehicles within lanes (zig-zag) to see further ahead, or to prepare for lane changing. It also shows nucleations (red/pink) and shockwaves, (orange/yellow/light-green). The red/pink colour shows the motorway coming to a sudden stop and this occurs three times in the fast lane (top) and once or twice in the middle three-lanes. These conditions present danger to motorists as shockwave progression can be difficult to see or anticipate occurring when the average speed is relatively low (50.8 km/h).
What Are Motorway Crashes Telling Us?
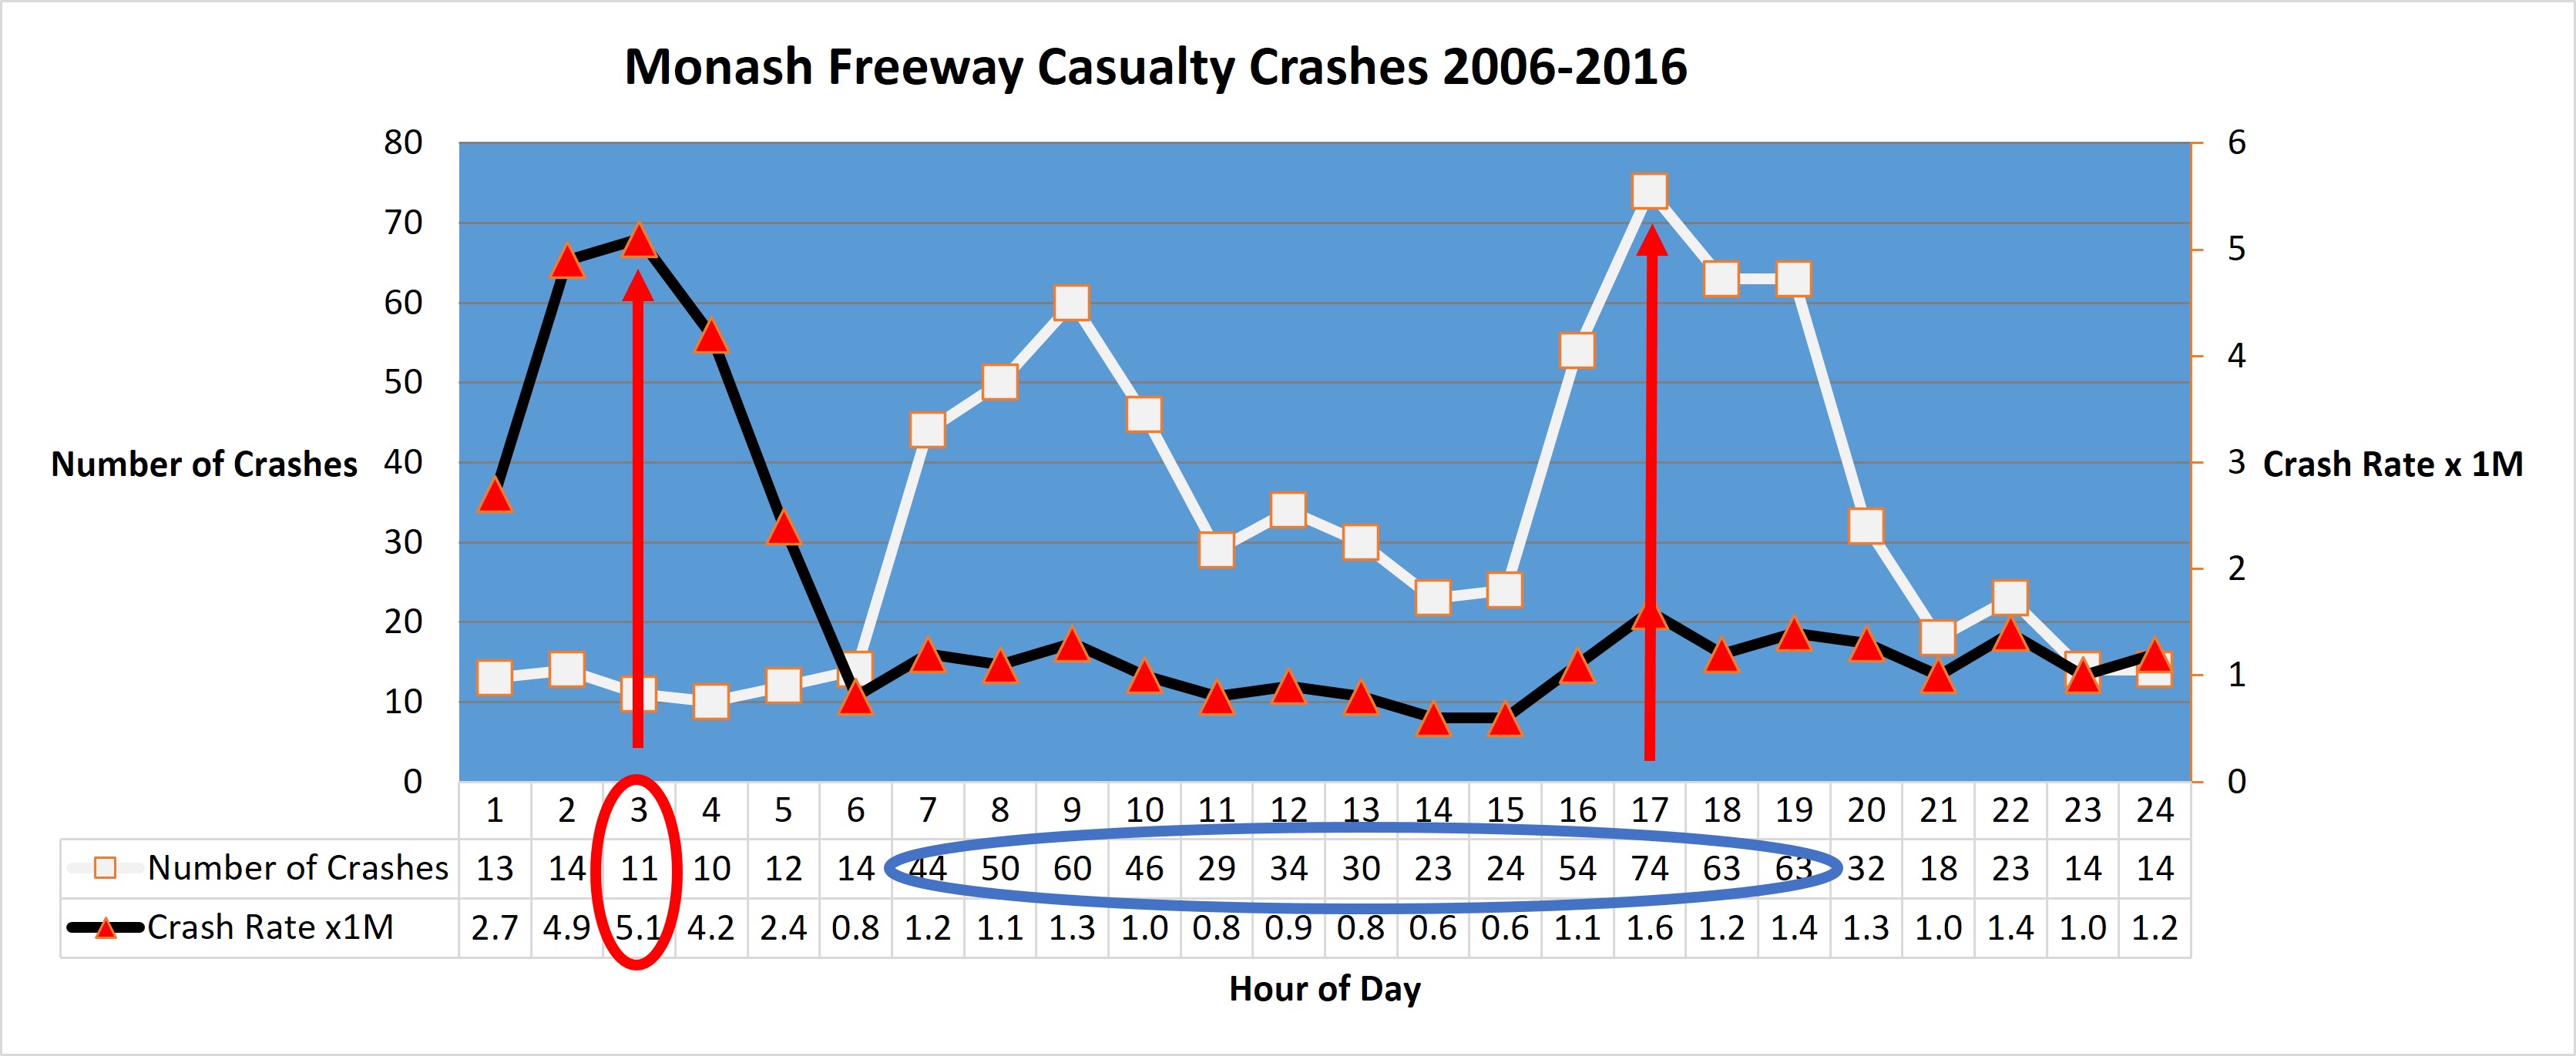
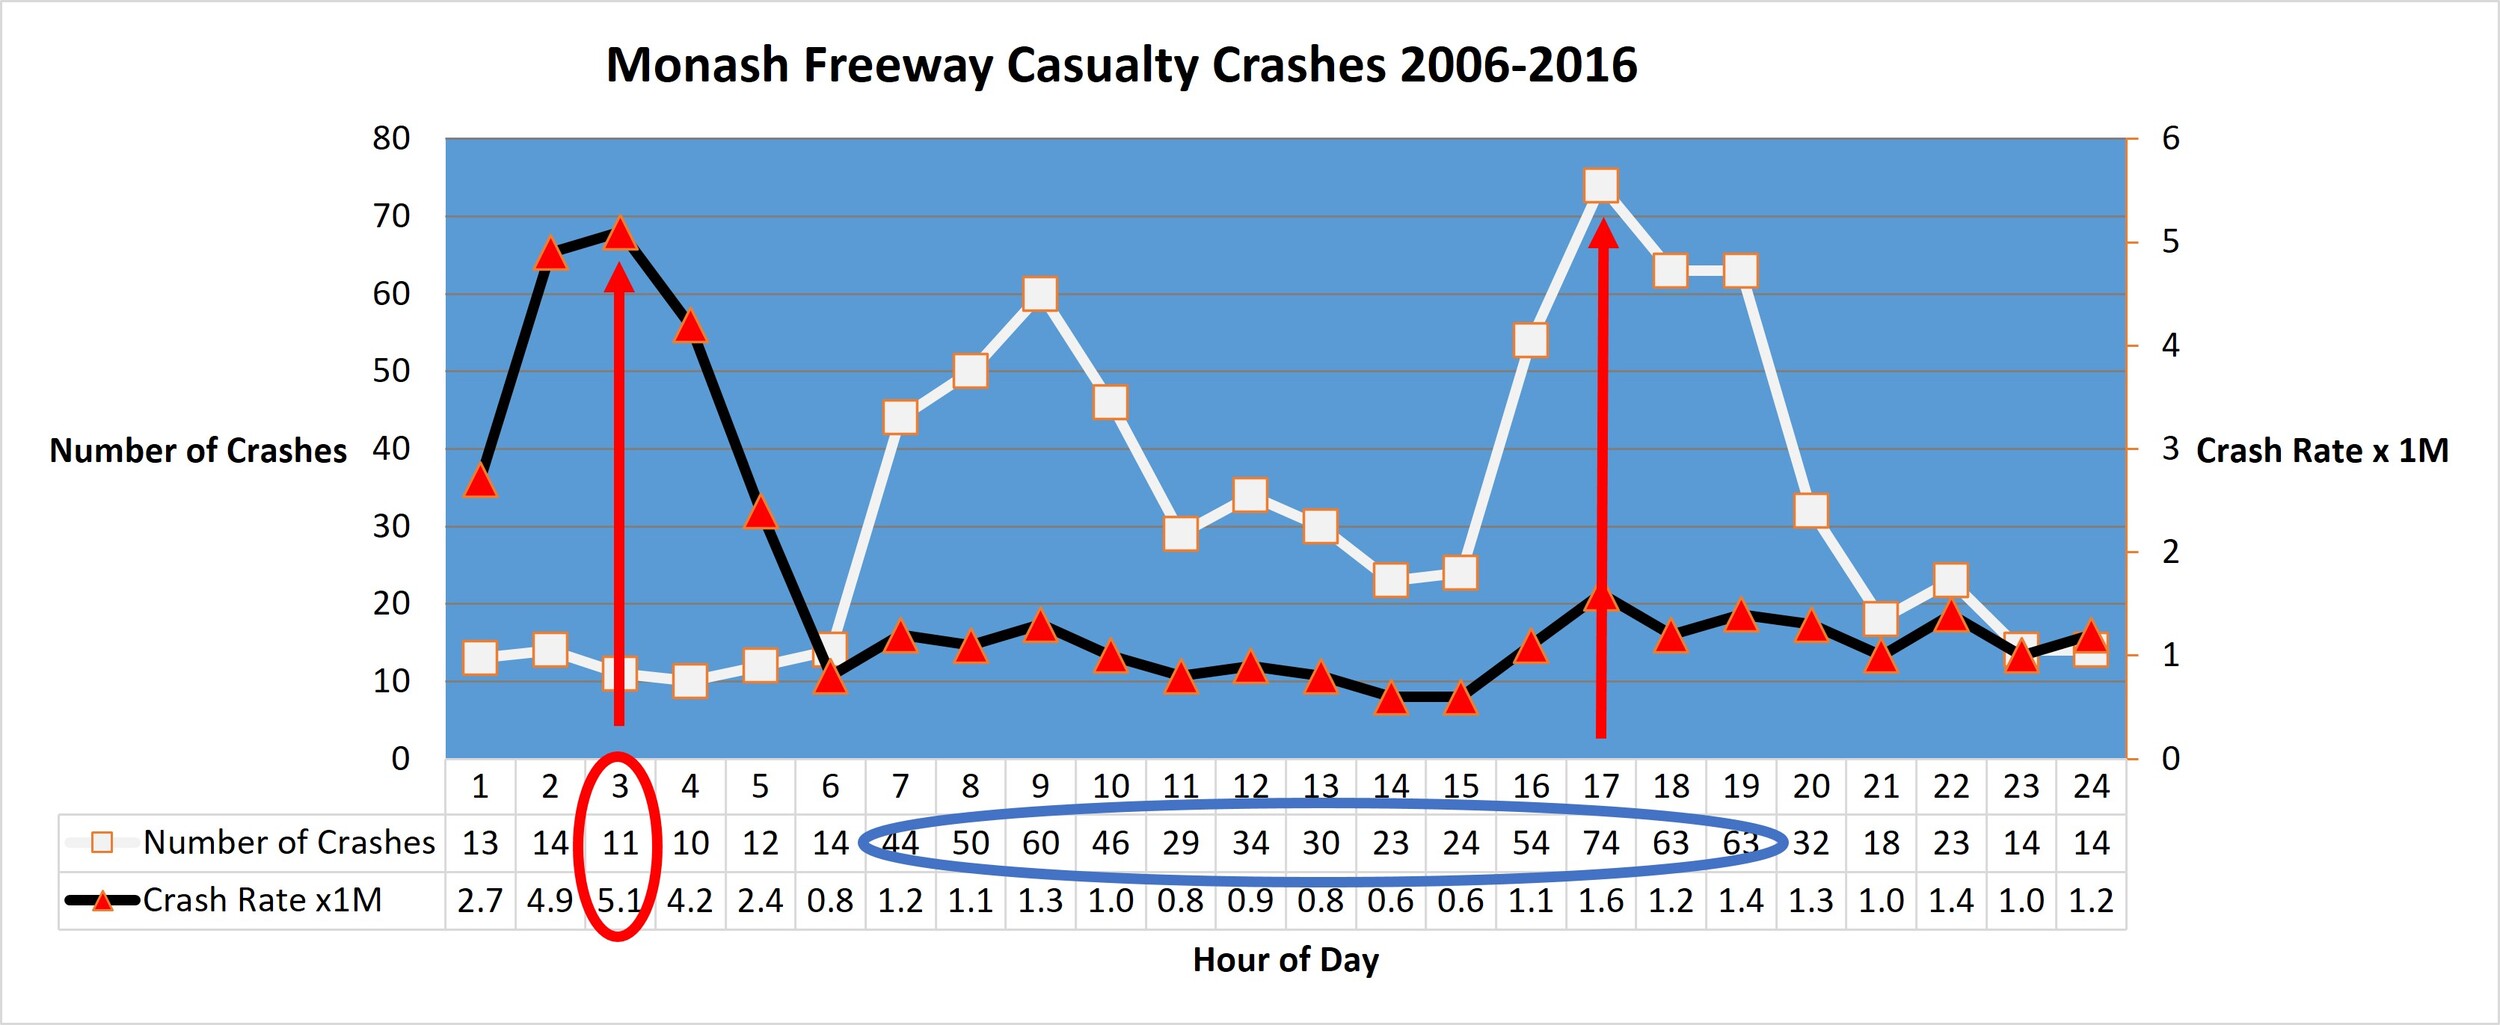
Figure 11 shows a comparison of the traditional crash rate approach to crash analysis (black line) based on vehicle kilometres travelled, together with the absolute number of crashes (white line) by hour of day for Monash Freeway. The highest crash rate (the small problem) is between 3-4 am (red ellipse) whereas the highest number of crashes (the substantial problem) occurs between 7 am-8 pm (blue ellipse). It is the area under the white line rather than the black line that reveals the crash problem. These peaks correspond with higher “flow” where headways and clearances are reduced below what is considered safe.
From detailed analysis of police crash reports, at least 53 percent of casualty crashes on Melbourne’s motorways involved contributing factors that are not always considered in traditional road safety programs (Gaffney & Hovenden, 2023). This includes factors such as adverse weather and visibility, traffic conditions (including traffic density), road surface conditions, vehicle faults and distractions.
Traffic conditions (congestion, heavy traffic, travelling too close, tailgating, blind spots) contribute to 35% of the casualty crashes on metropolitan Melbourne motorways compared to 13% of casualty crashes on all Victorian roads. Adverse weather and visibility contribute to 8.5% of the casualty crashes on Melbourne’s motorways and distractions (aside from mobile phone use) contribute to 6.4%. Many of these factors are compounded by heavy traffic conditions (e.g., drivers might state they are distracted when they did not see vehicles ahead suddenly braking hard).
When context changes (e.g., increased exposure to lane-changes, higher “flows”/densities, and heavier/larger vehicles) corresponding changes to crash types occur. Over the past three decades there has been a steady increase in multi-vehicle casualty crashes (23% increase), especially those involving three or more vehicles (60% increase) on motorways and a corresponding reduction in single-vehicle casualty crashes (53% decrease) (Figure 12). This increase is indicative of the growth in mechanisms within traffic “flow” that occur more routinely with the exposure to higher “flows” and densities (cumulative hours/year).

Two-vehicle rear-end crashes are potentially less dangerous than three-vehicle rear-end crashes. In the former, the front of the vehicle has a large crumble zone and shunts the rear of the vehicle in front. Given the low car occupancy rate in Melbourne of 1.2 people per vehicle (VicRoads, 2015), the front vehicle does not usually have rear passengers who could be injured. In 3+ vehicle crashes, impact forces may be considerably higher as vehicles have multiple impacts and some vehicles are squashed between others. The nature of these crashes for some vehicles can be like hitting a solid object (brick wall) due to the collective mass of the stopped vehicles they crashed into. In the first impact, often the vehicle’s safety features may have been fully consumed (crumble zone depleted and airbags inflated/deflated within milliseconds) before the second and subsequent impacts occur. In these situations, occupants are more exposed to serious injury from the sequence of impacts.
Summary and Considerations Moving Forward
Today motorways operate with more lanes, larger/heavier vehicles, and at higher traffic densities. Melbourne’s motorways now usually operate in high density classes (LOS D, E and F) during daytime hours (67% of vehicles on a typical Melbourne motorway travel with headways less than the two second safe reaction time and 30% travel with headways of one-second or less (6 am-7 pm).
As exposure to higher “flow” increases (higher densities), crash numbers rise sharply. Higher-density traffic reduces spaces between vehicles and introduces many dangerous traffic “flow” phenomena (shockwaves, nucleations, “traffic state” changes, lane-changing), creating additional complexities for drivers. In emergency situations, drivers make split-second decisions in a context where margins-for-errors (factors of safety) are compromised (manoeuvre space and stopping distance). This subtle and slowly changing context has caught many countries by surprise, with an associated increase in serious injuries. These phenomena can occur on all heavily trafficked roads, not just motorways.
Traffic “flow” is heterogenous, with many attributes simultaneously contributing to crash risk. Whilst crash risk is related to “flow” and its dependent variables (speed, density), many other confounding attributes are involved. Emerging detection technologies provide new metrics, giving new insights into vehicle fleet composition, vehicle interactions and the complexities drivers face.
Many drivers cannot perceive the temporal increased risk when headways suddenly reduce and the available gap (space and time) ahead (temporal) is less than the reaction time. This complexity is often described as “driver error” (addressing symptoms, blaming, assigning fault based on road rules only) without attempting to understand and quantify why (tackling causes). Commonly seen in police crash descriptions are statements like “did not see” or “congestion”. There are quantifiable characteristics of traffic “flow” that can now be addressed operationally, and of which drivers should be made aware. Consideration and understanding of traffic “flow” conditions at the time of the crash is necessary, both by police (capturing details and images of traffic conditions) and by analysts (using micro-traffic “flow” data at the time of the crash).
Although providing drivers with relevant information and education can be of some help, a more effective solution is to address operations as this reduces the actual cognitive load on the driver. The connection between roadside (static and electronic) information, education, and real-world traffic conditions is not always apparent to drivers as many driving tasks are made instinctively because of their repetitive nature. The key to managing motorways well is to actively change conditions which the driver reacts to subconsciously, thus reducing the driver’s cognitive demands. Reducing direct information and cognitive load provides space for drivers to make safe decisions.
Despite perceptions to the contrary, motorways can operate at high average speeds (between 90 and 100 km/h) achieving efficient and stable traffic “flow” with a low crash risk, provided “flow” and density are managed to provide adequate headways and clearances for drivers to manoeuvre and stop in emergency situations (this is critically important and is the operational objective of Managed Motorways). It is when “flows” increase and speeds collapse, such that density rises to critical levels, that crash risk increases (up to six-fold).
Keeping densities below certain thresholds (Hovenden et al., 2020) can reduce crash likelihood and is achievable with a city-wide approach to ramp metering, fully integrated with dynamic variable speed limit management. Such control systems need to activate when “flows” exceed certain limits, further intervening when density rises beyond certain limits, to prevent fast-moving traffic suddenly arriving unknowingly at the back of slow-moving queues or stopped traffic conditions. These dangerous situations can explain the large increase in multi-vehicle crashes.
Motorway design, such as separated carriageways with fewer lanes, can improve both safety and operations by reducing friction within carriageways. Wider carriageways require considerably more lane changes, and when combined with reduced empty road space (less room for human error), necessitate more precise driving skills. Sometimes gaps are too small to lane change smoothly, requiring drivers to force their way into the limited space available (Hall et al., 2018). This creates the necessary conditions to trigger dangerous shockwave or nucleation events, which can affect many kilometres (10-20 km) of motorway often lingering for several hours.
Certain vehicle technologies can also be of assistance such as “brake force display” systems. These give drivers an earlier indication of hard/emergency braking by the vehicle ahead and Australian design rules need to consider this.
In summary, motorway safety can be improved by appropriate design and real-time operation and intervention. With increased exposure to higher “flows”, likelihood of collision is greater, even with advances in vehicle technologies. Reducing lane changing needs and conflict points, and greater use of dynamic speed management when traffic conditions reach certain density thresholds or where there are inclement weather and temporal conditions will help improve safety.
Areas for further research include:
-
Deeper analysis of naturalistic driving studies to understand cognitive load on drivers due to heavy traffic conditions, and its effect on driver fatigue;
-
Analysis of the comprehensive Melbourne motorway data, beyond the metrics analysed in this paper, to further understand the dynamic complexities drivers face;
-
Similar analyses can be done on arterial roads where many TIRTLs are installed and as the “flow”-density problem is not the domain of motorways only but occurs on the broader road networks as road usage increases.
Conclusion
Numerous context changes to road traffic “flow” have occurred over the past two decades which affect driver workloads and hence road safety. It is important to recognise that such context changes will continue to occur as road networks are placed under increasingly higher traffic demands, requiring a different lens to understand crash causation.
Newly (readily) available finer-grained traffic “flow” data generally show short cycles of vehicles clustered together (shorter headways/clearances), followed by short periods of vehicles more dispersed (longer headways/clearances). Many assumptions around speeds, headways and clearances have often been devoid of real-world vehicle-event measurement. Commonly used aggregated volume and speed data (aggregated by hours, days, years or even speed-limits) is simplistic and provides little understanding of crash causation mechanisms and driving complexity. The variances revealed in sub-one-minute or vehicle-event data can be measured, counted, and used to derive the relationship between exposure and risk. Vehicles are constantly mixing and remixing in a traffic stream with continually changing longitudinal and lateral lane speeds and clearances. Exposure to crash risk is a complex domain, requiring multi-variant (holistic) understanding of traffic “flow” phenomena. Although outcomes of crashes at various speeds have stochastic distributions (rarely calibrated for actual exposure to vehicle speeds), the outcome of any crash cannot be guaranteed, hence crashes must be avoided. Contemporary knowledge of traffic “flow” science is essential for understanding crash risk but has not been adequately addressed in current road safety strategies.
To advance road safety, traffic “flow” dynamics must be quantified and understood as they help explain many crash causations, the rise in serious injuries, and why the crash problem is getting harder to solve. Due to its subtle emergence over the past two decades, its implication in crash causation has been overlooked. These dynamics provide important clues, necessary for developing greater understanding of the driving task, leading to more effective solutions and programs with a view to avoiding crashes occurring.
Acknowledgements
The authors would like to thank Matthew Hall for his feedback.
Author Contributions
John Gaffney and Elizabeth Hovenden conceived this manuscript, undertook the data collection, data analysis and manuscript writing. Both authors revised the manuscript critically for intellectual content and have read and agreed to the published version of the manuscript.
Funding
This research did not receive any specific grant from funding agencies in the public, commercial, or not-for-profit sectors. It resulted from an extension of work relating to a study of crashes on urban motorways.
Human Research Ethics Review
This study did not require Human Research Ethics Review.
Conflicts of interest
The authors declare that there is no conflict of interest.
Data Availability Statement
The authors have included all relevant materials, data, and protocols associated with the publication in the text. Readers may request additional information.
Article History
Received: 30/6/2022; Received in revised form: 27/10/2022; Accepted: 19/04/2023; Available online: 17/05/2023