


Introduction
Road users often experience construction or maintenance works along their routes. Although trailer mounted mobile Variable Message Sign (VMS) usage is increasingly common, temporary road signs are still regularly used to warn drivers of hazards due to changes in the road environment and to direct and regulate traffic flow, particularly in regional locations. Although temporary road signs offer an efficient way to warn road users, their inability to remain stable against wind and vehicle-induced loading has been a significant issue and poses severe risks to road users and site workers. As such, it is vital to stabilise temporary road signs to enable them to serve their function without compromising safety. The fact that fallen signs can lead to safety hazards on roads, especially in rural and regional areas where there is less capacity for workers to assess if a sign has fallen over, is an issue that needs to be investigated. Research conducted by Main Roads Western Australia in 2019 (Main Roads Western Australia, 2019) was successful in assessing the stability of different signboards and legs of temporary road signs with and without stabilisers. However, a limitation of this research was its consideration of weight as the only parameter to help stabilise temporary road signs. The results from this previous research showed that the multi-message sign with bi-pod round legs and 15 kg sandbags were the most stable. It was also evident that the wind generated from road trains was the primary cause of instability of road signs although the road train effect was not quantified.
Apart from weight, other factors such as the centre of pressure, the frontal area of the sign, wind loading, road train aerodynamics, road sign position from the road edge line, and different road surfaces are also important factors to consider when analysing the stability of temporary road signs.
The primary objective of this paper is to identify the factors that cause sign instability arising from wind and vehicle induced loads. The study further proposes modification to the current legs of temporary road signs to improve their stability. The results from the current study are anticipated to assist in increasing public safety and the safety of traffic controllers and other road workers.
Previous Research
Previous studies described in research literature, where computational fluid modelling (CFM) (or computational fluid dynamics, CFD) was used for modelling wind loading effects, were considered appropriate for the current research. Although it appeared no previous studies had investigated the interaction of road trains and temporary road signage in a simulated environment, there was relevant literature which could be utilised for this study.
CFM/CFD is a method of discretising basic equations involving fluid flows such as wind and solving them numerically using dedicated computing software (Kataoka et al., 2020). It has been widely used in the engineering industry to simulate real-world wind dynamics problems (Wei, 2017) in a timely and cost-effective manner, thus minimising the number of experiments required. For example, Palmer et al. (2003) and Kataoka et al. (2020), have shown that CFD is well suited for analysing the effects of wind speed on static and dynamic structures and describe the wide range of applications and use of CFD in wind engineering analysis.
Bodies subjected to fluid flow can be divided into streamlined and blunt bodies. Understanding blunt bodies and their flow separation is essential to this study. A blunt body is a body that, due to its shape, experiences separated flow over a substantial part of its body (Flay, 2013). A study by Irwin (2008) reviews certain blunt-body phenomena and their effect on structures and people, including the analysis of highway signs. A road sign may be treated as a blunt body and can be assumed as a 2D flat plate. Castelli et al. (2012) presented the numerical simulation of a flow field around a thin flat plate placed perpendicular to the fluid flow, providing insight into the flow field.
Turbulent flows are classified as highly unsteady and random flows. Several studies, such as Murakami (1993) and Murakami and Mochida (1988), have been available where a selection of turbulent flows and flow fields around 3D blunt bodies have been analysed. Murakami (1993) compared various turbulence models suited for blunt bodies, and the standard K-ε turbulence model was found to be the most effective for blunt-body aerodynamics simulation. Castelli et al. (2012) also noted K-ε as an effective turbulence model for flat plate simulation for external flows.
Coleman & Baker (1994) analysed the aerodynamic behaviour of high-sided trucks experimentally to determine wake characteristics and vorticity generation. The turbulence and wake characteristics are discussed from the perspective of a yaw angle with the sign positioned relative to the truck’s direction. It was concluded that as the yaw angle increases, the turbulence and vorticity also rise. These results were similar to the work done by Larsson (2020), where the dependence of yaw angle on turbulence and drag coefficient of heavy haulage truck is presented. The drag coefficient was seen to increase with an increasing yaw angle.
A combined experiment of a road train passing a road sign has also been studied by Quinn et al. (2001a, 2001b). They analysed wind-induced and vehicle-induced effects on a road sign using atmospheric boundary layer theory. From the field measurements, it was concluded that wind direction appeared to have a significant effect on the measured load values, and sign shape is not a dominating factor in wind loading. Insight into horizontal loads on overhead sign structures, due to vehicle-induced wind gusts, were also discussed by Cali et al. (2000). Tests with varying vehicle speed, vehicle length, vehicle shape, and sign height were analysed.
To understand the various factors that cause temporary road signage instability and to find ways to stabilise signage, this research utilises both CFM and experimental approaches to investigate temporary road sign stability and wind effects arising from passing road trains.
Method
The methodology adopted to investigate the stability of temporary road sign is discussed in five sub-sections: preliminary investigation, assumptions, analytical method, computational fluid modelling, and experimental analysis. A brief description of each sub-section is given below.
Preliminary investigation
The main aim of the preliminary investigation was to obtain information for the CFM simulation process. This involved choosing the wind speed based on available weather data and designing a representative road train.
Step 1: Wind Profile
Wind speed is one of the critical parameters that can affect the accuracy of results obtained in this study. With a planned field experiment to be conducted in the Port Hedland region as part of this study, the wind speeds for Port Hedland were retrieved from the Bureau of Meteorology (BoM). The BoM wind speed data shows a typical maximum wind speed value in the Port Hedland region to be 10 m/s. It must be noted that BoM measures wind speed at the height of 10 m from the ground using an anemometer. The temporary road sign used in this project has a maximum height of 1.33 m.
Wind speed varies with respect to height according to the law of the wall (Kent et al., 2018). The vertical profile of horizontal wind, commonly called wind profile, refers to the variation of the horizontal wind vector as a function of height. The surface roughness and different atmospheric stability conditions greatly influence wind profile and need to be accounted for in estimating wind speed (Konow, 2015). A log law wind profile is chosen to represent the velocity in the vicinity of the road sign and is considered valid to a height of 100 m (surface layer and atmospheric boundary layer). Equation 1 is used to find the mean wind speed at a height
\[ u\left(z_2\right)=u\left(z_1\right) \frac{\ln \left(\frac{z_2-d}{z_0}\right)}{\ln \left(\frac{z_1-d}{z_0}\right)} \tag{1} \]
Assuming the surface on which the sign is positioned to be open flat shrubland terrain, a representative roughness length, z0, of 0.05 m and the zero plane displacement d = 0 (Geerts & Linacre, 1997) enables wind speeds above the surface to be estimated based on the 10 m BoM value.
Figure 1a represents the wind profile at different heights of the road sign. The maximum wind speed at the top of the road sign is calculated to be 6.2 m/s.
_wind_profile_above_the_ground_in_the_vicinity_of_sign._b)_road_train_simulated_in_solid.jpeg)
Step 2: Heavy Haulage Vehicles
Port Hedland Traffic volume road data from the heavy vehicles access strategy report released by the Town of Port Hedland (Kleyweg, 2020) were assessed to understand the presence of heavy vehicles in the region. Twenty per cent of total traffic volume per day on Port Hedland roads is comprised of heavy haulage vehicles with the daily average being close to 1,000 and the maximum approximately 1,500 road trains per day.
SolidWorks was used to simulate a 60 m road train in accordance with Main Roads Western Australia specifications (Main Roads Western Australia, 2021) (see Figure 1b).
This geometry falls under the Restricted Access Vehicle (RAV) category and is the longest road train permitted in Western Australia. Several road train models are available in Australia corresponding to different prime mover and trailer designs, varying gaps between the trailers, etc. These changes are likely to alter the results, though likely in the high-frequency content with the lower frequency phenomena governed primarily by the main (large) features (Larsson, 2020). Thus, these feature details were considered not critical to the fundamental understanding of when a sign falls.
Assumptions
The speed limit on Western Australian roads was a relevant factor taken into consideration for road train simulation. The maximum speed permitted for a 60 m road train is 90 km/h. But considering the maximum speed limit of 100 km/h for standard heavy haulage vehicles in Western Australia (Regulator, 2020), the simulation was run with a 100 km/h input velocity.
The standard temporary road sign design has yaw axis leg mobility (Figure 2a). Initially this degree-of-freedom was removed and the whole assembly assumed to be a rigid body (Figure 2b).
_sign_leg_mobility__non-rigid_sign_with_yaw_degree_of_freedom_(left)_and_rigid_sign_with.jpeg)
Roads in Australia have a slight cross fall to avoid flooding. This research assumed the road pavement surface to be horizontal across the width. Figure 2b depicts the geometry of rural roads and the proportions/ dimensions of a typical road train in Western Australia. Also displayed is the typical location and size of a temporary road sign with respect to the lane edge line.
In all cases, it was assumed the wind direction was perpendicular to the sign. It is important to note that symmetry is used for the sign structure as it only has the mean wind force acting perpendicular (i.e., parallel to the road centreline). Due to the constrained legs, the rotational moment is absent in the XZ plane.
Analytical Method
The maximum permissible load that a rigid sign can withstand, assuming it falls over without sliding, can be determined using the force and moment free body diagram (FBD) in Figure 2c.
This analysis is performed by assuming the road sign is a rigid body on a horizontal road surface. In addition, it is assumed that a uniform wind velocity at standard atmospheric conditions acts on the sign. Table 1 lists the weight of the temporary road signs, both the body and the legs.
Equation 2 expresses the drag force on the sign generated by a uniform wind profile. Where is the density of the air, is the frontal area, the drag coefficient and V the velocity of the wind perpendicular to the sign.
\[F_{D} = \frac{1}{2}\ \rho AC_{d}V^{2}\tag{2}\]
From Figure 2c, it can be seen that the weight balances the combined reaction forces from the front and rear legs. This yields Equation 3.
\[R_{1} + \ R_{2}\ = \ W\tag{3}\]
Accounting for the sign geometry, the moment on rear points on the legs equates to:
\[R_{2}(1.10) - W(0.55) + F_{D}(0.855) = 0\tag{4}\]
The condition of instability of road sign is given by:
\[R_{2} = 0\tag{5}\]
Equations (3), (4), and (5) are used to find the drag force which in turn gives the maximum wind velocity according to Equation (2) for which the sign can remain stable. This method is performed for the road sign with and without sandbags by substituting the weights into Equation (4).
Computational Fluid Modelling
All the relevant parameters such as drag coefficient, vehicle and wind-induced velocities, and flow field around the road sign and a passing road train were analysed using Ansys Fluent CFD software (ANSYS, 2021). The road sign and road train were simulated separately, and their interaction was inferred from individual models due to computational limitations. It is important to remember that the velocity in the vicinity of road sign is calculated as the difference between input velocity and vehicle induced velocity. It is noted that the road sign CFD is supplemented with the force analysis discussed in the preliminary investigation section to determine the drag coefficient
Blockage Ratio and Effect of Clearance from the ground surface
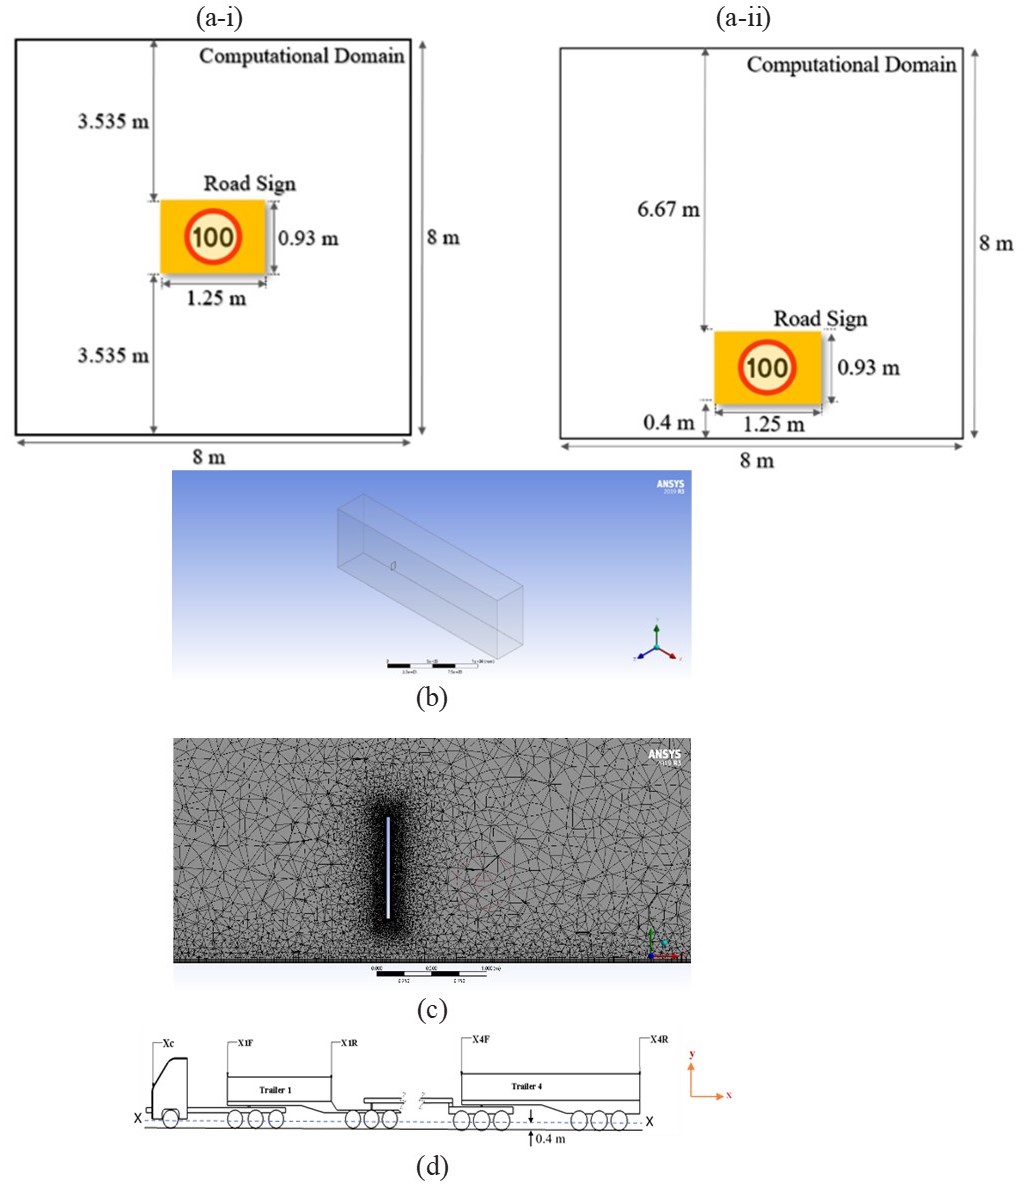
The Blockage Ratio, BR, is defined by Equation (6) and refers to the ratio of projected area of the object in the flow direction to the cross-sectional area of domain around the object. In accordance with standard practice, a blockage ratio value of less than or equal to 3% was chosen for both the road sign and road train CFD as this value minimises the introduction of error into the results (Altinisik et al., 2015).
\[BR = \ \ \frac{(Frontal\ Area\ of\ Sign)}{(Frontal\ Area\ of\ Domain)}\tag{6}\]
Figure 3a-i represents the theoretical value of 1.28 for 3D flow around a flat plate (National Aeronautics and Space Administration, 2021). As can be seen, there are equal distances from the top and bottom of the domain to the sign. In reality, temporary road signs are placed with the bottom of the sign 0.4 m from the ground, (Figure 3a-ii). This reduced clearance makes the wind exert an unequal force on the top and bottom of the sign, which is likely to increase the apparent drag coefficient.
_normal_clearance_(a-ii)_reduced_clearance_b)_geomet.jpg)
CFD – Road Sign
Initially, the signboard was assumed to be a 2D flat plate, and the simulation was performed without legs. The leg’s small cylindrical profile is thought to contribute negligible resistance and drag to the incoming wind velocity, thereby not causing a considerable change in the result.
The simulation can be separated into onsite road sign CFD and wind tunnel CFD.
Onsite Road Sign CFD
Pre-Processing Stage
After conducting the blockage ratio calculations, the computational domain and model were generated in Ansys Fluent. The dimensions of the domain were 25 m × 8 m × 8 m (L × W × H). The boundary conditions of the domain included a velocity inlet, pressure outlet, walls, and ground. The road sign was located close to the inlet boundary of the domain with an upstream length of 5 m and a downstream length of 20 m. This enabled the fluid to develop a fully developed flow. The geometry of the domain is represented in Figure 3b. To reduce the computational time, symmetry was applied to the domain.
The next step in pre-processing was the mesh generation, which discretises the domain into smaller elements. Both volume mesh and surface mesh were used for mesh generation, together with tetrahedral elements. The ‘Body of Influence’ property was applied around the road sign geometry generating a finer mesh in the road sign vicinity. Also, inflation was utilised to understand the effects in the boundary layer (region close to the sign).
To find the optimum mesh size for maximum accuracy and optimised computational time, a mesh convergence study was conducted. This was performed by doubling the number of elements until the resulting drag coefficient reached a constant value. Four million elements were required for convergence, accounting for the second-highest number of elements giving the required result with optimised computational time. The mesh near the sign is shown in Figure 3c.
Simulation Stage
The flow was assumed steady, and the calculation of Reynolds number indicated that the flow was turbulent. To model the turbulence in the flow characteristics, the Realisable K- Epsilon turbulence model was used as it provides better performance on flows involving flow separation, adverse pressure gradients, etc. (Murakami, 1993).
A perpendicular uniform wind velocity of 10 m/s was supplied at the inlet of computational domain to determine the drag coefficient and drag force. This value corresponds to the maximum wind velocity in the Port Hedland region measured at the height of 10 m (World Weather Online, 2021). The value obtained from the simulation is complemented with the values from the analytical method to find the maximum permissible velocity.
Wind Tunnel Road Sign CFD
The process was similar for the wind tunnel simulation except for the dimensions used for the computational domain and mesh convergence. Because the wind tunnel simulation was validated using results from the wind tunnel experiment, the actual wind tunnel dimensions of 2.86 m × 2.23 m × 5 m (W × H × L) were used for the Ansys simulation. The same mesh convergence study was conducted and, as expected, the mesh converged at a smaller number of elements equal to 1 million.
CFD – Road Train
The aim of the road train simulation was to identify the wind induced from a passing road train along the sign. The road train model was designed ignoring certain geometric features, which likely have negligible influence on road sign stability. The design has certain assumptions included to reduce the computational time whilst aligning with practical experiments. In this study, the yaw angle is assumed as zero since experiments were to be conducted on straight stretches of road. Additionally, non-rotating tyres were simulated so as to reduce computational time and avoid the complexities present in dynamic meshing.
The SolidWorks model was imported into Ansys for assigning domain and boundary conditions. The mesh convergence process for the road train simulation itself was a time-consuming process due to it being a bigger computational domain. The computational domain has an upstream length of 60 m, and 120 m was chosen for the downstream length for a fully developed flow. A blockage value of less than 3% was selected (Altinisik et al., 2015). Even with mesh convergence achieved at 5 million mesh elements, the computational time took longer than the road sign simulation likely due to the complex geometry, boundary conditions and ensuing wind profile.
To simplify the simulation, the road train was assumed stationary, and the walls and ground were made to move with a velocity similar to the inlet velocity. A uniform inlet velocity of 100 km/h was used. The ground surface was considered rough to account for the roughness of the testing site.
Figure 3d shows trailers on a road train and the naming convention. is the section at the cabin, and the sections of the trailer at the beginning and rear are denoted by and respectively, where is the number of trailers from the prime mover. These regions were selected as these changes in geometry in relation to the road sign may coincide with fluctuations in wind velocity.
Experimental Analysis
The experiments were divided into Stability Test and Wind Tunnel Test. Both performed the function of validating the analytical and CFD results.
Stability Tests
Physical stability tests were conducted at the Centre for Engineering Innovation at The University of Western Australia (UWA)'s Shenton Park Research Facility. They were conducted to analyse and compare the stability of both rigid and non-rigid signs on different surfaces: smooth concrete, gravel, and asphalt. Table 2 depicts the coefficient of friction between mild steel and the different surfaces.
Nine points were chosen on the signboard as shown in Figure 4a, at which separate push forces were applied with a 100 N digital force gauge, made by Starr Instruments (2021) (Figure 4b), to understand the stability failure points of the sign. The force was noted when instability (movement/sliding or lift) occurred.
_points_on_sign_where_forces_were_applied_(left)_and_the_digital_force_gauge_used_for_t.jpeg)
The tests were initially performed with a non-rigid sign followed by a rigid sign, and were repeated three times to verify repeatability. To remove leg mobility/rotation and produce a rigid sign, a tie wire was used. Figure 4b shows the different experimental setups.
Wind Tunnel Experiment
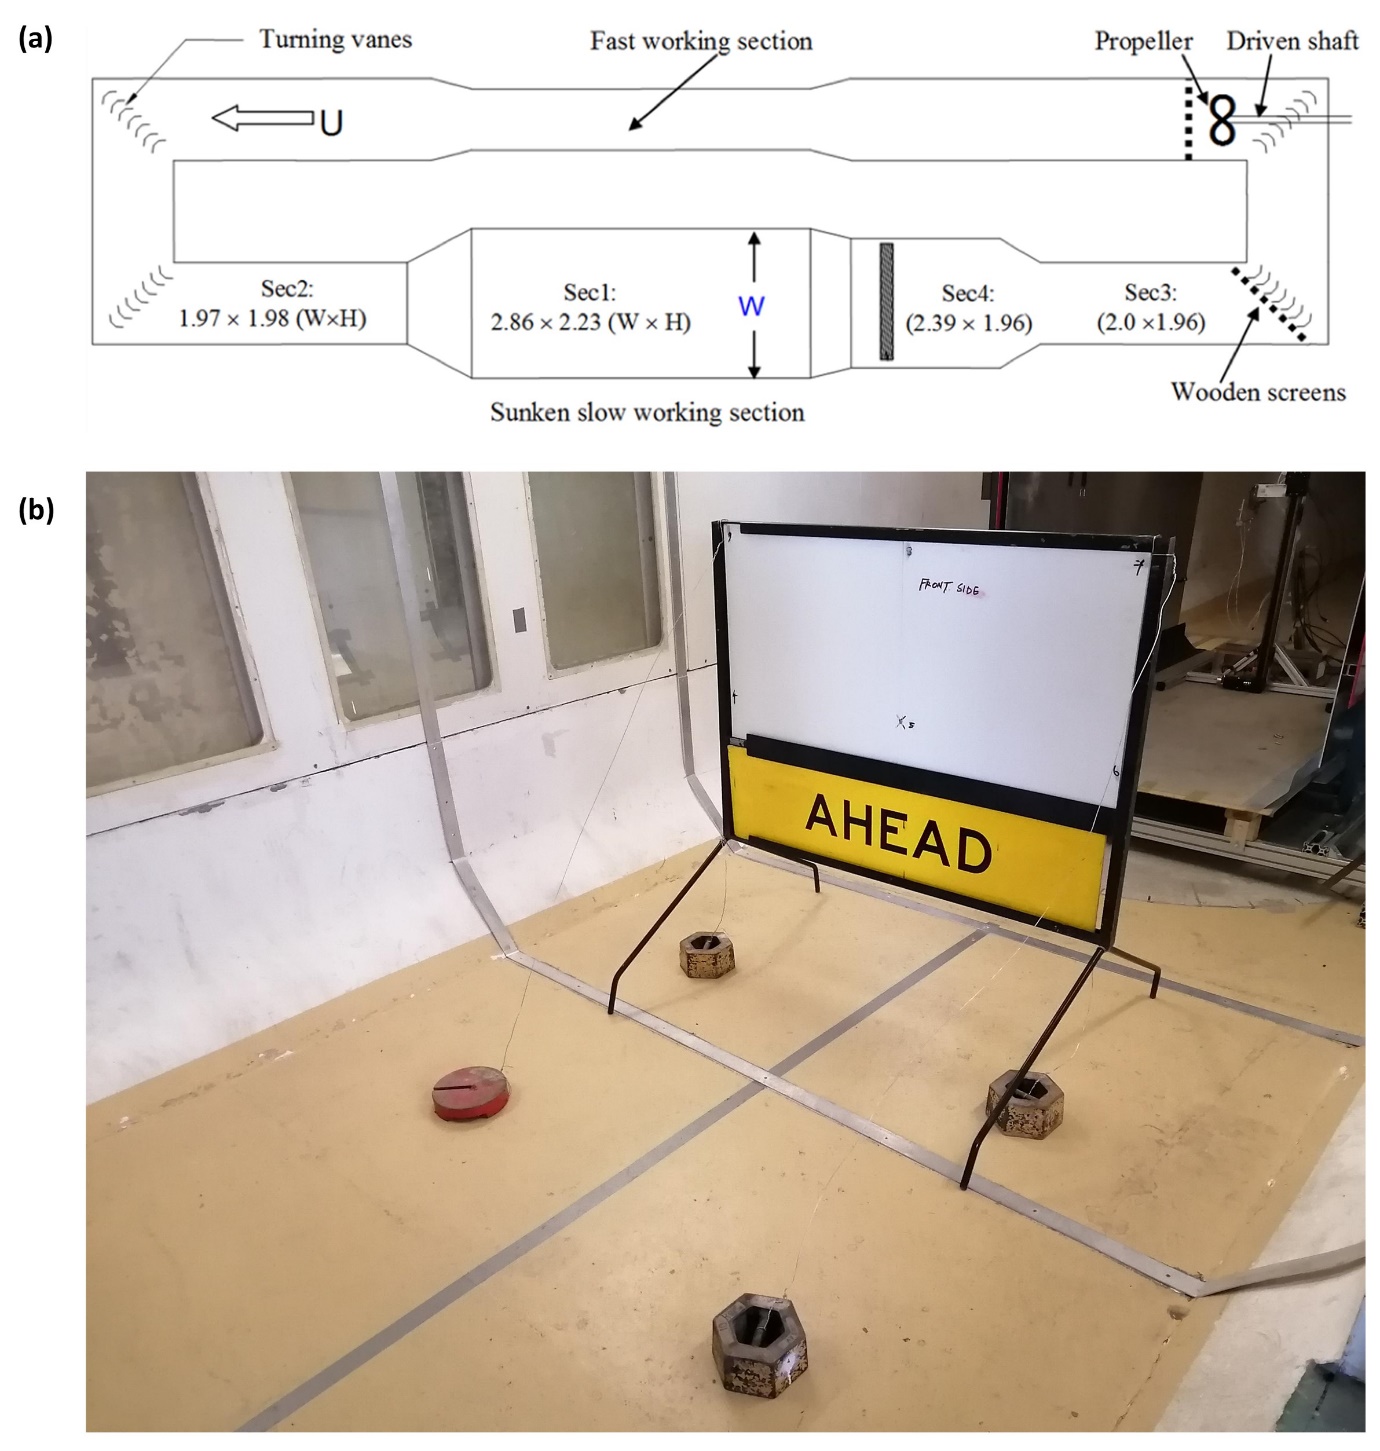
The wind tunnel experiment was used to validate the wind tunnel simulation. The experiment was conducted in the wind tunnel at UWA’s Structural Laboratory and resembled the wind tunnel simulation. The wind tunnel schematic is represented in Figure 5a.
_uwa_wind_tunnel_schematic___173934__(b)_temporary_road_sign_with_weights.jpeg)
The risks associated with the testing were analysed, and necessary risk mitigation measures were adopted to avoid hazards to operators and the wind tunnel. The experimental methodology commenced with placing the road sign in the middle of Section 1 of the wind tunnel, as this section provided the required velocity (Figure 5b). Initial tests were conducted for the non-rigid sign followed by the rigid sign. To prevent the road sign from falling and/or blowing into the honeycomb flow straightener structure, four 10 kg weights were attached to the sign by guide wires without affecting the aerodynamics. Once the setup was completed, the velocity was gradually increased from 0 m/s until a continuous movement in the sign was noticed. The experiment was repeated three times and results recorded to ensure repeatability in measurements.
Design Modification
In order to avoid an entirely new road sign design, a simple design modification to the bi-pod round legs was proposed to make the sign behave rigidly up until a threshold load (i.e., from the wind) and then behave like one with leg (yaw) mobility above that. The latter attribute ensures the sign falls flat into the ground plane, minimising the hazard. This was achieved by welding washers to either side of the sign legs where they join as shown in Figure 6a and accompanying sketch in Figure 6b.
_modified_legs_with_washers_welded_(b)_schematic_representation_of_modification.jpeg)
Field Trial
Field trials were conducted using the modified ‘rigid’ sign shown in Figure 6a, to validate simulation results with on-site conditions. The experiment was conducted on Great Northern Highway (1.3 km North of Bindoon-Moora Road) on 17 November 2021. The trial was conducted under proper care and safety guidance as approved by Main Roads Western Australia. Photos as well as a video recording of the experiment were taken to facilitate analysis of the sign’s behaviour when subjected to wind and vehicle-induced loads. The experiment was done in two phases: 1) the temporary road sign was placed 1.2 m away from the edge line of the pavement and 2) the sign was placed 1 m from the edge line. The stability of the road sign, subjected to ten heavy haulage vehicle drive-by tests, was analysed after both phases 1 and 2 were completed.
Results and Discussion
The results and discussion are divided into the following subsections: analytical and CFD for a road sign, CFD for a road train, and experimental results.
Analytical and CFD – Road Sign
By identifying the maximum safe force acting on the road sign, the maximum permissible velocity that the sign can withstand was estimated. This was done by substituting the estimated drag coefficient from the road sign simulation into Equation 2. The velocities are determined for a sign with and without sandbags for the onsite CFD. Table 3 gives the maximum force and velocity values for the estimated value for the rigid sign. The magnitude of maximum permissible load is verified using the stability test, whereas the results from the wind tunnel simulation are validated using the wind tunnel experiment.
As expected, the drag coefficient estimated was greater than the theoretical drag coefficient value of 1.28 (National Aeronautics and Space Administration, 2021) for a 2D flat plate experiencing 3D flow. This is likely due to the reduced clearance between the ground and bottom of the road sign, and resultant asymmetrical flow. In the wind tunnel simulation, a higher value of is obtained, equal to 2.28. The increased blockage ratio of 18% is anticipated to be the cause of this larger value.
CFD – Road Train
The effect of induced wind can be represented with the velocity streamlines, which provide the magnitude and direction of wind flowing down the stream of the road train. The streamlines, illustrated in Figure 7a, are generated in the plane at the height of 0.4 m, representing one of the planes passing through the sign. It is noted that the results presented are only the ‘x’ component of induced velocity.
_velocity_magnitude_around_the_road_train_in_the_xz_plane_at_0.4m_height_b)_representati.jpeg)
Flow separation is visible near the prime mover in the vicinity of the sign and is responsible for the sign’s stability. Additionally, the turbulence from road train motion, the gap between the trailers, and the gap between the trailer and prime mover are likely to affect sign stability.
Though the wind velocity induced by the road train appeared to be opposite the road train motion initially, its direction tends to reverse after the passage of the first trailer of the road train. Eventually, the velocity reaches the maximum value that tips the sign to the ground when the rear of the third trailer was in line with the road sign.
Asymmetrical wind loading on the sign panel may cause failure earlier than expected as the current road sign leg yaw mobility cannot transmit a moment in the XZ plane. The effect of passing road trains on sign stability at different positions along the trailers of the road train is shown in Figure 7b. The values not circled represent vehicle induced velocities in the direction opposite to the movement of the road train, while circled values represent velocities in the direction of road train motion.
Stability Test
The force values measured to move the sign for a load in direction parallel to the road centreline are given in Table 4 for the non-rigid sign and Table 5 for the rigid sign on all three surfaces: concrete, gravel, and asphalt (upper, middle, lower).
The measured values show that the non-rigid sign tends to slide when force is supplied with the force gauge, where Fmax represents sliding. It was clear from the experiment that the rotational moment translates into rotary motion for the non-rigid sign, and the continuous supply of these forces will make the sign collapse to the ground on all three surfaces. The same sliding motion was seen for the rigid sign on concrete surfaces. Irrespective of the leg mobility, the sign on an asphalt surface was observed to be the most stable, followed by gravel and concrete. The friction coefficient between the steel legs and different surfaces is likely to have affected the stability.
The results of the rigid sign from the analytical method can be compared with the findings of the stability test. The force values estimated for instability analytically at centre point ‘5’ was 73 N, whereas a higher force value was measured for the rigid sign at point 5 on gravel and asphalt.
Wind Tunnel Test
The average velocity values of the three measurements taken during the experiment at which the sign visibly moved or changed position are presented.
With the non-rigid sign, a slight movement was recorded on the left leg at a wind velocity of 4.45 m/s. A further rise in wind velocity to 5.65 m/s resulted in the left leg moving uniformly in the direction of wind velocity. In comparison, the rigid sign undergoes slight movement at a higher wind velocity of 5.3 m/s as expected and a significant movement at 5.9 m/s. Both the legs moved uniformly at the same time during the experiment.
The surface in the wind tunnel can be contrasted with the concrete surface for comparing stability and wind tunnel results. The measured average force value from the stability test for the non-rigid sign to undergo sliding was 75 N, at a wind velocity of 6.74 m/s. This was found to be 5.65 m/s in the wind tunnel experiment, where a high blockage ratio was present in the wind tunnel test.
Onsite Field Trial
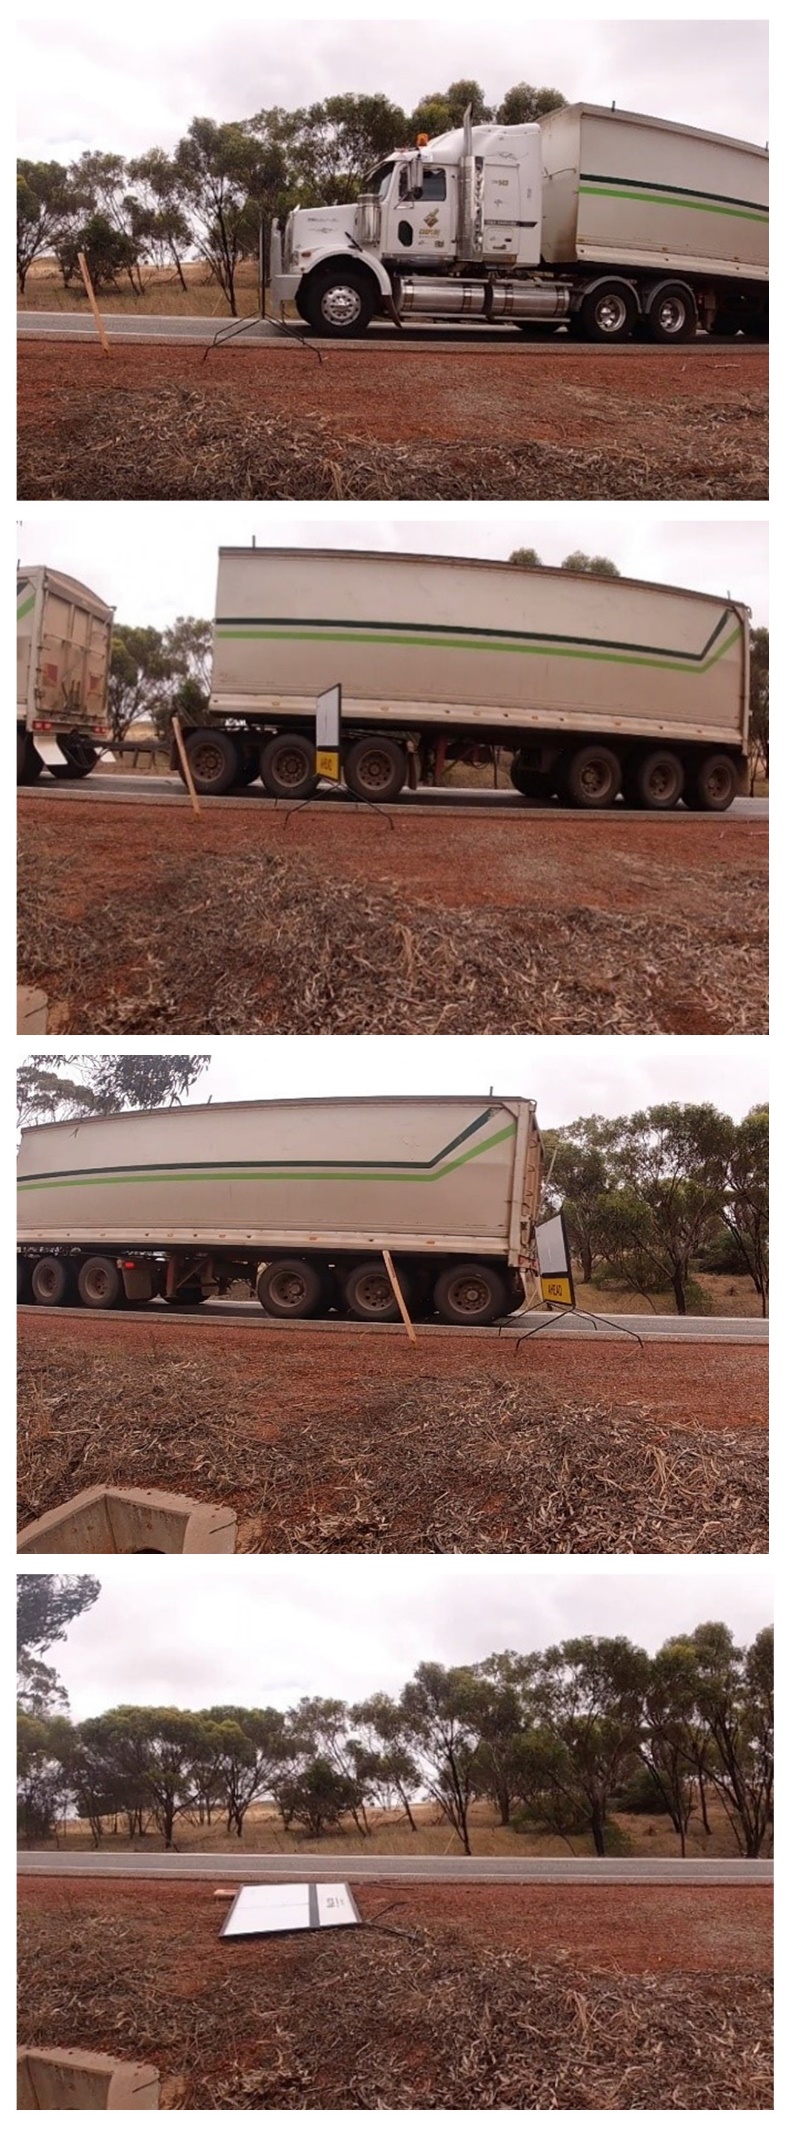
The transition of the modified sign from being stable to falling under the 4-trailer road train is shown in Figure 8.

The onsite trial started at 8:22 am, and the stability was tested ten times during the passage of a heavy haulage vehicle/road train. For Phase 1, the sign was placed 1.2 m from the edge line. The sign remained stable throughout phase 1 of the trial. The test was terminated at 8:53 am. In comparison with the previous study by Main Roads WA, the bi-pod round legs collapsed at the same spot when tested 1.2 m from the edge line (see Table 6 for comparison). Phase 2 began at 8:56 am, with the sign being moved closer to the edge line, 1 m from the edge line. A fall was recorded after the passage of the first road train (road train with two trailers). The trial was terminated after the first fall, and the end time was noted to be 9:05 am. It is also noted that no tests were conducted by Main Roads WA in the previous field trial where the sign was placed at 1 m from the edge line. The results are summarised in Table 6.
Study Limitations
Whilst attempts have been made to identify explicit assumptions when deriving the models, and conducting the simulations and experiments, this study still has many limitations. The practical applications of the findings presented in this study need to be further explored to translate the simulation and wind tunnel testing to real world environments. Whilst some in-field testing was conducted, it was limited. It would have been beneficial to test with a larger number of passing trucks. There also needs to be some effort to ensure passing vehicles are traveling at the same distance from the edge line within their lane. To make further recommendations, more testing with direct control comparisons is recommended. This may be facilitated with two signs in the same camera frame/view close to each other, a sign with normal legs and one with the modification.
Conclusions
Analytical and simulation results suggest that a rigid road sign remains stable until an induced velocity of 8.5 m/s acts on it due to wind loading arising from ambient conditions and/or the passage of heavy haulage vehicles comprising different numbers of trailers.
From CFD, 8.7 m/s was the maximum velocity generated by the passage of a truck, which is greater than the maximum permissible velocity that the sign can withstand. It was evident from the simulation that the sign with four sandbags remains stable even at the combined wind velocity of approximately 15 m/s which may be expected onsite (6.2 m/s from log law and 8.7 m/s from road train). This corroborates well with the results of the previous Main Roads Western Australia study. A non-rigid sign is more unstable due to leg mobility and is highly likely to collapse at lower velocities.
A simple retrofit modification was made to the bi-pod legs to enable the sign to behave as a rigid sign up until a threshold and then behave like a sign with leg (yaw) mobility. The configuration remained stable at 1.2 m from the edge line, but collapsed at a closer distance of 1 m. The observations from the field trial for the modified sign was consistent with the results obtained from simulations and analytical approach which suggested that a fully rigid sign is expected to fall in the presence of the wind generated from a typical road train.
Acknowledgements
The authors are thankful to Professor Tongming and Senior Technician Stephen Naulls of The University of Western Australia (UWA) for providing all the necessary help and support for the wind tunnel experiment. The authors are also grateful to Gareth Peers of Main Roads Western Australia for industry insight and support to the authors. Finally, the authors would like to acknowledge the role of Co-operative Education for Enterprise Development (CEEDWA) for awarding the first author a CEED scholarship to pursue his Master’s studies on this topic.
Author Contributions
Anandanarayanan Nanda Kumar wrote the original Master’s thesis, on which co-authors provided feedback and from which Richard Amoh-Gyimah prepared the original manuscript draft.
Andrew Louis Guzzomi was the academic supervisor and conceived the initial set-ups for the CFD, wind tunnel and signboard tests on the different surfaces and the design modification.
Anandanarayanan Nanda Kumar personally conducted all the experiments and simulations. All set-ups and tests were discussed and advanced with all co-authors.
Richard Amoh-Gyimah, Peter Ellis, and Brendon Wiseman were the Main Roads Western Australia (MRWA) sponsors for the project.
Peter Ellis, Richard Amoh-Gyimah and Brendon Wiseman provided access to and advice on previous studies conducted by MRWA.
Brendon Wiseman and Peter Ellis provided knowledge on local Pilbara Road conditions, road train information, reference material and historical on-site data.
All authors have read and agreed to the published version of the manuscript.
Funding
This research was funded by the Co-operative Education for Enterprise Development (CEEDWA).
Human Research Ethics Review
This study did not require Human Research Ethics Review.
Conflicts of interest
The authors declare that there is no conflict of interest.
Data Availability Statement
The authors have included all relevant materials, data, and protocols associated with the publication in the text. Readers may request additional information.
Article History
This peer-reviewed paper was first submitted as an Extended Abstract and an Oral Presentation was recommended by two reviewers at the 2022 Australasian Road Safety Conference (ARSC2022) held in Christchurch, New Zealand 28-30 September 2022. The two reviewers also recommended that the Extended Abstract be expanded into a ‘Full Paper’ and undergo further peer-review as a journal submission by three independent experts in the field. The Extended Abstract is published in the ARSC2022 Proceedings. This ‘Full Paper’ version is being reproduced here with the kind permission of the authors and will only be available in this edition of the JRS.
Received: 27/07/2022; Received in revised form: 05/09/2022; Accepted: 23/01/2022; Available online: 08/02/2023