Introduction
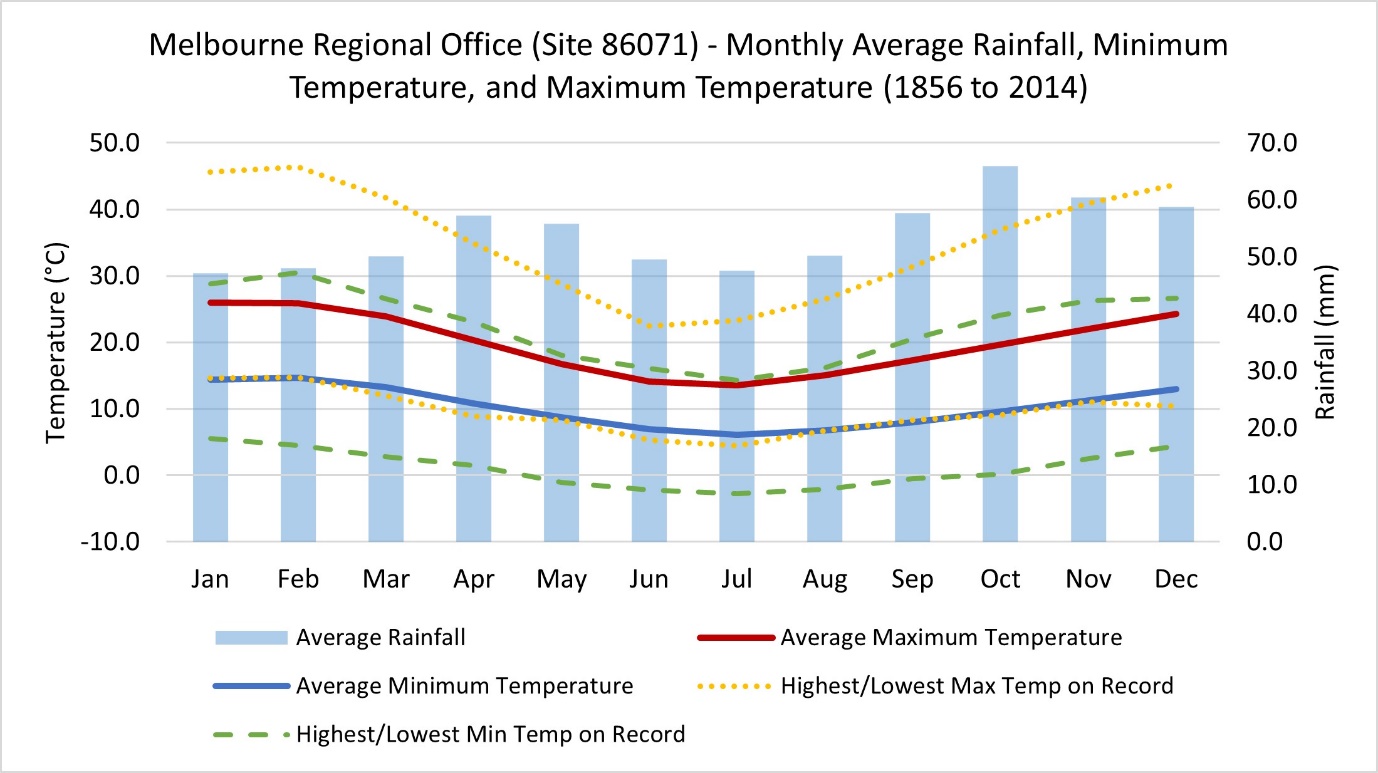
Weather patterns span weeks, months, seasons, and years and do not follow the artificial constraints of years and months used commonly in analysis. Historically, Australian Aboriginal and Torres Strait Islander people recognised up to six seasons based on physical changes observed in nature (such as blossoming plants) rather than following a fixed date-based cycle (Australian Government Bureau of Meteorology, 2016). Climate and weather operate on a continuum (see Figure 1), hence analysis of crashes in relation to climate and weather is not straightforward. The causes of weather-related crashes are not the same in January as in July and crashes need to be analysed temporally, using comparable time periods or preferably comparable climate sequences. Longer-term climate trends, such as the El Nino – Neutral – La Nina cycle (typically four years), provide another layer of complexity and make annual and monthly comparisons problematic.
.jpeg)
In the previous papers, it was found that a range of weather metrics in combination with other metrics, such as slope of road, road geometry and road condition, were essential to understand crash risk in relation to weather (Gaffney & Hovenden, 2022b). For Victoria, the two-week cycle of the Southern Annular Mode (SAM) climate driver, during which sequences of both high- and low-pressure systems move across the state, was shown to align with the patterns of fatal crashes (Gaffney & Hovenden, 2022c). This study focuses on high and low casualty crash days and long and short sequences of days with or without fatal crashes in order to further investigate the relationship between climate, weather, and crashes. It examines these crash days in relation to commonly available weather metrics to identify the likely contribution of weather in crash occurrence and to identify meteorological associations between weather and crashes. It explores the association between low-pressure sequences (cold fronts and troughs) by examining their path and intensity in relation to population and activity areas and timing of events.
Methods
Details of data sources and analysis tools were described in Gaffney & Hovenden, 2022c. To explore underlying patterns of crashes over the decade (2010-2019), days with above or below average casualty crashes, and long sequences of days with and without fatal crashes were identified. Daily weather metrics were then extracted and associations between weather and crash occurrence were examined. Crash characteristics (vehicle type, road user and age) were also analysed for the days with a high number of fatal crashes and for the longer sequences of days with fatal crashes. The weather metrics included maximum temperature, minimum temperature, rainfall, solar radiation, water vapour pressure (9am and 3pm) and 6-hourly synoptic charts.
For the period 2010 to 2019 days that had the most casualty crashes (top 2% and top 10%) were identified as high crash days and those that had the least casualty crashes (bottom 2% and bottom 10%) were identified as low crash days. Crash locations were compared against synoptic charts and the other five meteorological metrics for these days to see if there were marked differences in weather patterns between high and low crash days. Seven high and seven low crash days were compared and analysed.
Results and Discussion
Temporal (Yearly, Monthly, Daily and Hourly) Variations in Crashes
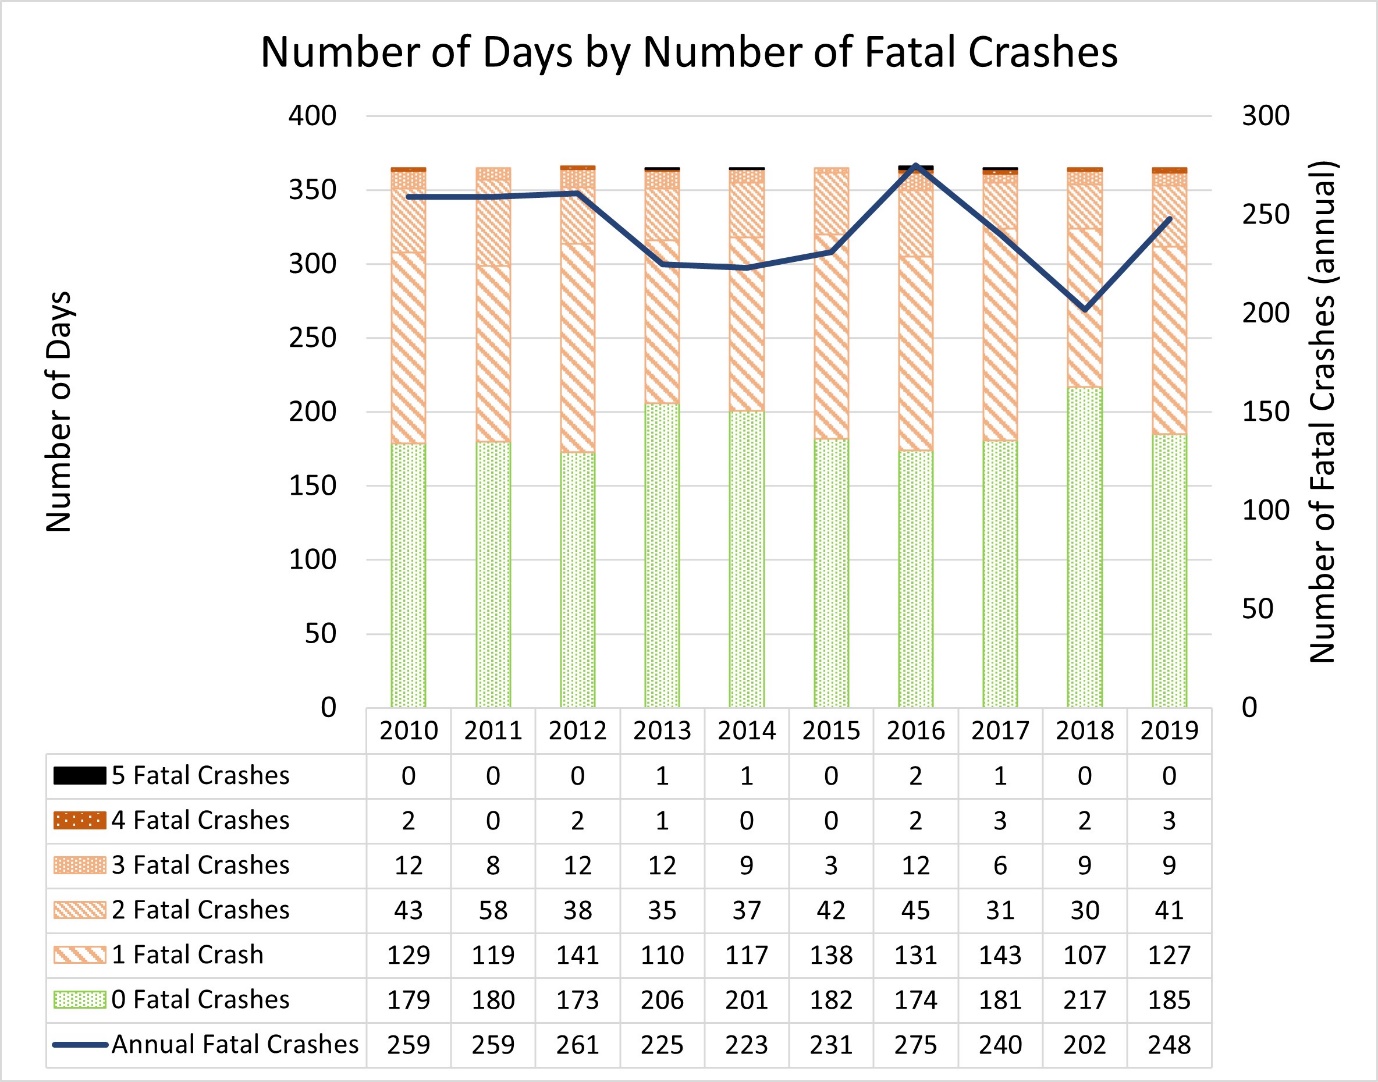
Figure 2 shows how the number of days with and without fatal crashes varies between years in Victoria (2010-2019). It also shows variation in the number of days each year that have one or more fatal crashes.

Table 1 shows a breakdown of fatal crashes each year highlighting that there are considerable differences when each year is broken down, showing how fatal crashes vary within each year. The data showed that on average 51% of days in a year have no fatal crashes.
Due to a range of factors that influence the incidence of crashes, including infrastructure and behavioural aspects, cyclic nature and random variations, there can be many periods within a year with low crash numbers and/or zero fatal crashes and, conversely, many periods with high crash numbers and/or high fatal crash numbers or consecutive days of fatal crashes. These periods may in part be explained by weather phenomena which influence daily road usage, affecting crash rates (Keay & Simmonds, 2005).
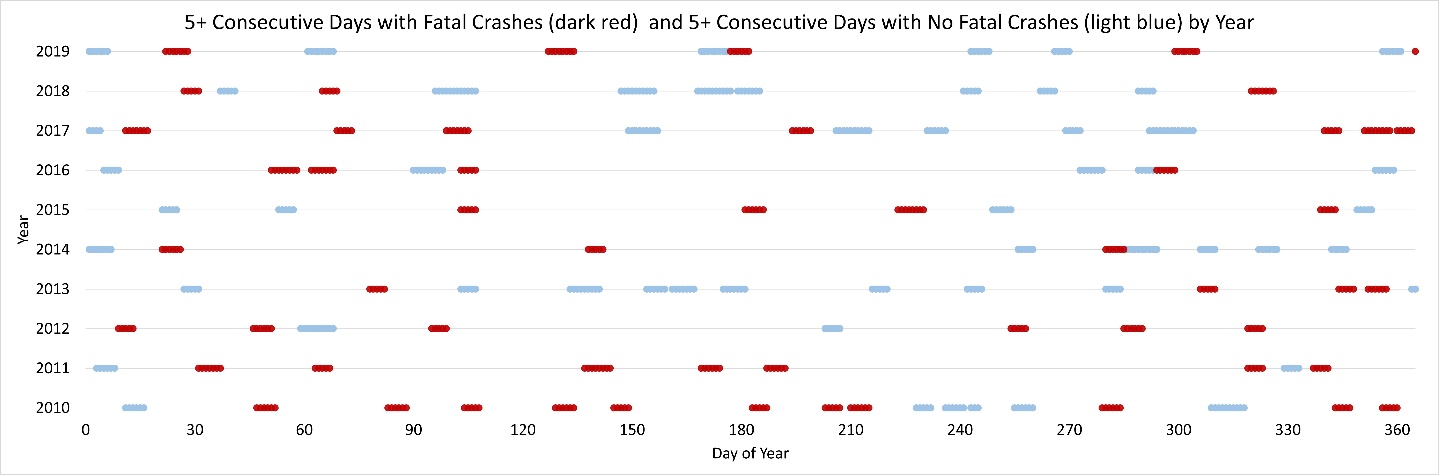
Figure 3 shows a breakdown of each year (2010-2019) highlighting the sequences with five or more consecutive days with fatal crashes and the sequences with five or more consecutive days without fatal crashes. Further charts with a finer breakdown can be found in Gaffney & Hovenden (2022a). The longest period with no fatal crashes was 13 days and occurred in 2017. The second longest period with no fatal crashes was 12 days and occurred in 2018. The longest period of consecutive days with fatal crashes was 8 days and occurred five times in the 10-year period. These five periods occurred in 2011 (14 fatal crashes), 2015 (12 fatal crashes), 2016 (13 fatal crashes), 2017 (10 fatal crashes) and 2019 (9 fatal crashes). It only takes a few additional shorter and longer sequences of days with fatal crashes and/or days with nil fatal crashes within a calendar year to vary the annual road death numbers substantially.
_and_with_no_fatal_crashes_(lig.jpeg)
A comparison of 2016 (high fatal crash year) and 2018 (low fatal crash year) is shown in Table 2. The year 2016 had more (and longer) consecutive periods with fatal crashes and less (and shorter) consecutive periods with nil fatal crashes than 2018. In 2016, there were also two days that had five fatal crashes per day whereas there were no days with five fatal crashes per day in 2018. Importantly, the differences observed in fatal crash numbers are consistent with the variations (and extremes) of weather which occurred in those years as discussed in Gaffney & Hovenden, 2022c.
Detailed examination of high fatal crash days
Weather metrics on the five days with five fatal crashes per day (see Figure 2) were examined. These five days experienced weather extremes (well above or well below average/normal), including high variability of temperatures, low visibility (high cloud cover), heavy rain and variable wind speeds and direction (which occur regularly across Victoria). Importantly four out of the five days each occurred in consecutive days with fatal crashes. This coincided with the movement of weather patterns as shown by synoptic charts. The weather conditions during these five days included three patterns.
The first pattern was characterised by heat waves of five to eight consecutive days, with well above-average conditions (e.g., 35-42℃ in November) before arrival of a sudden cold front and trough system bringing heavy rain and heavy cloud cover with rapidly falling daytime temperatures (to around 12 ℃), and night-time temperatures near zero or below across most of Victoria. Long periods of warm weather and heat waves are likely to fatigue populations generally, whether they are driving long distances or not. When this is suddenly followed by the other extreme (cold weather), the changes in weather, pavement friction and visibility are likely to catch motorists out.
The second pattern was characterised by a sequence of three or more consecutive cold wet wintery days with low daytime temperatures, heavy cloud and heavy rain and freezing inland night-time conditions. Under these conditions daytime visibility is low, and in all these cases the weather systems lingered (moved slowly), likely bringing unseasonal snow in the Victorian alps. Long periods of cold, damp, frosty and icy conditions with overcast conditions, low pavement friction and poor visibility, occurs every year but is well outside normal driving conditions for most Victorians.
The third pattern was characterised by still air combined with damp conditions, and air that is unable to hold moisture (low vapour pressure measured in hPa) combined with the lack of sunshine (with low solar radiation being a surrogate for high cloud cover) affecting visibility.
Further examination of these 25 fatal crashes over the five days found 80% of the crashes involved younger drivers/riders <=25 years (11 fatal crashes) and/or older drivers/riders >=55 years (10 fatal crashes). These younger and older road users were over-represented in these crashes compared to their general involvement in fatal crashes (57%) over the same time period. Of the older drivers, four were aged 70 or above. Three of the fatal crashes involved pedestrians, all of whom were older (64-, 83- and 90-year-old). Police crash reports mentioned rain and visibility as factors in these three crashes. Motorcycles were involved in 28% (seven) of the 25 fatal crashes, compared to 17% of overall fatal crashes. Motorcycles can become unstable when encountering slippery and wet roads, and motorcyclists have increased exposure to the elements (e.g., rain and wind, extreme temperatures, etc.).
Detailed examination of long sequences of consecutive days with and without fatal crashes
As shown in Table 1, fatal crashes typically come in clusters, ranging from two to eight or more days. In these longer periods, several shorter sequences of adverse weather conditions sometimes join to form longer sequences. For example, an extreme heat wave sequence of days can suddenly transition to a severe cold, wet and cloudy sequence, catching road users by surprise.
The analysis of the five periods between 2010 and 2019 that had the longest number of consecutive days (eight consecutive days) of fatal crashes, plus the unusually long 14-day consecutive period of fatal crashes in December 2009 (six sequences in total) found combinations of extremes in weather (see Table 3). The analysis of the seven periods between 2010 and 2019 that had the longest number of consecutive days (10 or more consecutive days) with no fatal crashes found they were generally associated with good weather days (not too hot and not too cold for the season, moderate cloud cover and stable weather), although some had considerable periods of rain. The marked differences in weather patterns between the longer sequences of high and low fatal crashes (see Table 3) can inform road users and road safety practitioners of likely risks of crashes due to weather conditions.
Like the high fatal crash days, motorcycles were involved in a larger percentage 24% (19 of the 79) of fatal crashes on these long sequences of days with fatal crashes, compared to their 17% involvement in overall fatal crashes. The proportion of younger and older driver/rider involvement (58%) was similar to that for all fatal crashes (57%).
Looking closer at individual days with low and high casualty crashes
Analysis of individual days found that there was an average of 39 casualty crashes per day over the 2010 to 2019 10-year period (see Table 4 and Table 5). The analysis identified days with very high (top 2%) and high (top 10%) casualty crashes and days with very low (bottom 2%) and low (bottom 10%) casualty crashes.
For the very high and high crash days:
-
65 fell into the “top 2%” with daily casualty crashes ranging from 59-80 (Table 4). This represents 1.8% of all the days, 3.3% of all fatal crashes and 2.9% of all casualty crashes (Table 5);
-
344 fell into the “top 10%” with daily casualty crashes ranging from 51-80 (Table 4). This represents 9.4% of all the days, 12.8% of all fatal crashes and 13.4% of all casualty crashes (Table 5).
For the very low and low crash days:
-
60 fell into the “bottom 2%” with daily casualty crashes ranging from 15-21 (Table 4). This represents 1.6% of all the days, 1.0% of all fatal crashes and 0.8% of all casualty crashes. Many of the low crash days were Sundays, school holidays and/or public holidays (Table 5);
-
355 fell into the “bottom 10%” with daily casualty crashes ranging from 15-27 (Table 4). This represents 9.7% of all the days, 7.5% of all fatal crashes and 6.0% of all casualty crashes (Table 5).
On a very high casualty crash day (top 2%) there is a 3.2 times higher likelihood of a fatal crash compared to a very low crash day (bottom 2%). Some years had a different mix of lower and higher crash days which were below or above the 10-year mean. Notably 2016 (high crash year, wetter than average) had 110 days below the mean and 2018 (low crash year, drier than average) had 249 days below the mean.
In-Depth Investigation of a Sample of High and Low Crash Days
An analysis of weather metrics for individual high and low crash days was undertaken to investigate whether there were markers that could distinguish crash risk based on weather. Seven high casualty crash days and seven low casualty crash days were examined against the Bureau of Meteorology (BOM) data for that day. The BOM data were maximum and minimum daily temperature, daily rainfall, 6-hour synoptic charts, daily solar radiation, and water vapour pressure (for 9am and 3pm). Spatial and temporal attributes of both crashes and weather were investigated. Detailed results, maps and commentary for all 14 days can be found in Gaffney & Hovenden (2022a). The findings from the analysis align with the findings from the literature review that the timing of weather events in relation to human activity (e.g., peak hour versus early hours of the morning) determines how much of an impact the event has on crash occurrence (Gaffney & Hovenden, 2022b).
Based on the current analysis in combination with the results from Gaffney & Hovenden (2022b), weather and climate conditions associated with increased crash risk were found to be:
-
Falling atmospheric pressure and/or a low-pressure system combined with a trough (unstable weather);
-
Air carrying high moisture content (high apparent humidity);
-
Moist air in still wind conditions (can result in wet pavements staying damp for long periods);
-
The presence of unusually warm or extreme heat (particularly for extended periods) in summer or the periods either side of summer;
-
Very cold days or nights, particularly with extended periods of below average temperatures;
-
Amount of cloud cover (expressed by variations in solar radiation);
-
Heavy cloud cover during the daytime (e.g., a dull grey sky, low solar radiation) can reduce visibility – the effect of heavy cloud cover during twilight hours on crashes (causing low light and low contrast) needs further investigation;
-
The absence of cloud on a bright sunny day (e.g., high solar radiation) can cause eye strain from constant squinting and accelerate driver fatigue;
-
Absence of cloud cover at night can result in cold temperature and when the air is relatively still, pavements can become damp due to the temperature change between daytime and night-time (delta T) resulting in dew, frost, fog and mist affecting visibility (internal and external to the vehicle);
-
Warm and sunny days with clear skies on a low crash day can result in a disproportionate night-time crashes when there are clear skies combined with a large delta T as this increases the likelihood of dew and frost forming at night.
-
-
Warmer days with cooler nights (can result in a high dew point or frost, making roads slippery at night especially when unexpected in warmer months);
-
Extreme heat, often in combination with high humidity (can lead to fatigue or increased reaction times);
-
Extreme heat softening pavements (increasing braking distance, particularly in the hottest part of the day);
-
Light rain events, including thunderstorms and intermittent rain (however steady rain does not necessarily increase crash risk);
-
The combination of various weather events such as damp pavements and strong wind gust;
-
The time sequence of adverse weather events coinciding with high travel demand periods (e.g., am peak, pm peak).
Furthermore, weather and climate conditions associated with decreased crash risk were found to be:
-
Rising atmospheric pressure, with stable weather, and/or a high-pressure system;
-
Drier air or low water vapour pressure;
-
Dry air and the presence of moderate wind speed, even in the presence of rain events (likely due to rapid drying of pavements after a rain or dew event);
-
Cooler temperatures (below average conditions for the summer);
-
Above average daytime temperatures in winter (and either side of winter);
-
Cloud cover (expressed by variations in solar radiation);
- At night, cloud cover can keep temperatures warm and when combined with moderate wind speed (pavements will remain dry);
-
The time sequence of adverse weather events coinciding with low travel demand periods (e.g., middle of the night, public holidays, Sundays).
The geographic (spatial) location, timing of the movement of the weather, wind direction and wind strength generally correspond with the distribution of crashes over the 24 hours both on low and high crash days, however to differing extents. Cold nights inland can result in crashes after a very sunny winter’s day. Crashes follow the spatial and temporal movement of cold fronts, troughs, wind, and clouds.
In summary, stable weather conditions with small hour-to-hour and day-to-day variations, and which are consistent with the season, are favourable to low crash occurrence whereas high variability, over the day or with respect to what is normal for the season (day and night), or high and low extremes of temperature increase crash risk. There are certain combinations of weather metrics, such as strong winds combined with rain, and hot weather combined with high humidity, that increase crash risk as they affect the environment and can degrade human and vehicle performance (Gaffney & Hovenden, 2022b). Some can be subtle and short-lived, catching road users by surprise. A broader range of factors, other than deficiencies at the crash location, therefore, need to be considered in crash analyses.
The spatiotemporal nature of these events also needs to be considered in crash analyses, with the capture of more micro details about the weather leading up to the crash event and the use of Global Positioning System (GPS) coordinates to link the crash record to the BOM data from the nearest weather station. Capturing the light intensity levels (which affect visibility) at the time of the crash using a standard metric (e.g., lux) is also recommended. All seven metrics mentioned above are required as a minimum to differentiate adverse weather events for road users and need to be captured and collectively analysed for the time when the crash occurred.
Limitations
There are limitations to these analyses as no statistical testing has been undertaken on the underlying data. To undertake this requires the involvement of meteorologists due to the spatial and temporal nature of climate and weather. It also requires a long-term analysis period as many (rarer) events (combinations of factors) occur only a few times each decade (e.g., Cyclone Laurence). This is an area recommended for further research. It involves understanding and fitting of appropriate statistical models, and should include additional variables, such as traffic demand/exposure data to examine the direct versus indirect effects of weather patterns on crashes.
Considerations Moving Forward
This section has been provided to redress a sometimes common belief that when it comes to weather, there is not a lot that can be achieved via road safety programs. It identifies practical opportunities to develop and implement ameliorative measures and areas for further research. Improvements can be made in the following areas:
-
In addition to BOM data linkage, other relevant data could be collected at the crash scene (for crashes attended by Police), such as standardised visibility measurements and light levels, and pavement dampness levels;
-
Greater use could be made of existing real-time and automated variable messages in the roadside to communicate weather-related and traffic conditions together with dynamic speed limits to support the need to reduce speed;
-
Likely periods of high crashes can be predicted by the five- and seven-day weather forecasts thus warnings and advice (e.g., regular road weather alerts via various media and channels) can be provided to road users in a timely manner with relevant geographical and temporal context;
-
Targeting road safety campaigns to the weeks in the year when crashes are higher rather than solely focused on holiday periods, many of which have historically low crash risk;
-
Raising road users’ awareness for the need to avoid travelling, reduce travel speed (e.g., wipe off by 10 to 20 km/h), reduce distance travelled, and take more breaks under certain inclement and high-risk conditions (especially for motorcyclists);
-
Modelling the “norm” (e.g., that it is acceptable to drive below the speed limit) through long-term sustained campaigns (like the 0.05 campaign).
Further research, literature review and data linkage are required in the following areas:
-
Single one-off days and extended periods of high temperatures and/or high relative humidity in relation to its impact on human factors (e.g., fatigue, comfort levels, reaction time, heat stress), including the combined impact on long distance driving;
-
Single one-off days and extended periods of cold temperatures, including wind-chill effects, in relation to human factors and its effect on specific road user types (pedestrians, cyclists and motorcyclists) and on vehicles (cold tyres and cold brakes);
-
The contribution of road dampness, dew, and frost to road crashes;
-
Detailed crash analysis of twilight conditions (dawn and dusk) in relation to visibility;
-
The development of a practical visibility scale (seeing less than 100m is often reported as zero visibility) for direct measurement at the crash scene, leading to the development of road weather warnings provided to road users on days with poor visibility (including the compulsory use of head lights);
-
Further understanding of the factors associated with the cycles of high and low crash days, including the sequences of crash days, using multivariate analysis to take into consideration the influence of other factors that also affect crash occurrence;
-
Detailed analysis of weather metrics for more high and low crash days to provide a sufficient sample size to allow disaggregation of data into other key variables (e.g., time of year which affects travel patterns);
-
Development and application of appropriate statistical models to the data with input from meteorologists (variables such as traffic demand/exposure data should be included in the model);
-
Development of a model (like the Finnish one, see Gaffney & Hovenden, 2022b) for Victoria’s road network to predict, measure and report conditions such as road surface temperature and driving conditions and used as a basis for informing roads users;
-
Behavioural change methods to maximise benefits of greater messaging (adaptation and modification of behaviours when risks are higher).
Conclusions
Analysis of weather metrics on very high crash days and very low crash days revealed markedly different patterns. The high crash days were associated with active low-pressure systems (falling air pressures and troughs), bringing unstable weather which can catch drivers by surprise, reducing margins of safety and leading to errors and increased crash risk. The low crash days, on the other hand, were associated with high-pressure systems (rising air pressures) and more stable weather. On days with a high number of fatal crashes, a higher-than-average proportion of fatal crashes involved younger drivers, older drivers, and motorcycles. On the extended periods with fatal crashes, there was a higher-than-average proportion of motorcycles involved. Much can also be learned by looking at the weather conditions on days where there are low crashes and/or no fatal crashes. On these days, the weather was stable, there was moderate cloud cover, and it was neither too hot nor too cold for the season. Whilst fatal crashes were associated with cold fronts and troughs, when these occurred outside of peak-periods they tended to have less effect. When the direct path of the cold front bypassed Victoria, or its relative strength was low, the fatal crash risk was also reduced.
The three-part series of papers identified the breadth and complexity of the many interacting weather elements and their capacity to modify the physical environment, the vehicle performance and human behaviours, and provided greater understanding of the need to “drive to conditions” in relation to crash risk. These studies examined the crash problem through different lenses (macro and micro), identifying new patterns and revealing new insights into crash causation to further assist reaching the goal of zero road deaths and serious injuries. It has opened up many new lines of research and enquiry. The findings can also be used to provide a threshold of weather conditions above which specific control measures may be required to manage the increased crash risk, and including increasing awareness and target messaging when certain weather conditions are forecast or arise. The approaches in these studies are applicable to other jurisdictions. Other jurisdictions are encouraged to conduct similar studies in their own context (latitude, longitude and geography) as climate and weather patterns vary from place to place and some variations in the findings would be anticipated.
Acknowledgements
The authors would like to thank Dr. Hendrik Zurlinden and Matthew Hall for their feedback.
Author Contributions
John Gaffney and Elizabeth Hovenden conceived this manuscript, undertook the data collection, data analysis and manuscript writing.
Both authors revised the manuscript critically for intellectual content and have read and agreed to the published version of the manuscript.
Funding
This research did not receive any specific grant from funding agencies in the public, commercial, or not-for-profit sectors. It resulted from an extension of work relating to a study of crashes on urban motorways.
Human Research Ethics Review
This study did not require Human Research Ethics Review.
Conflicts of interest
The authors declare that there is no conflict of interest.
Data Availability Statement
The authors have included all relevant materials, data, and protocols associated with the publication in the text. Readers may request additional information.
Article History
This peer-reviewed paper was first submitted as an Extended Abstract and an Oral Presentation was recommended by two reviewers at the 2021 Australasian Road Safety Conference (ARSC2021) held in Melbourne, Australia 28-30 September 2021. The two Reviewers also recommended that the Extended Abstract be expanded into a ‘Full Paper’ and undergo further peer-review as a journal submission by three independent experts in the field. The Extended Abstract is published in the ARSC2021 Proceedings. This ‘Full Paper’ version is being reproduced here with the kind permission of the authors and will only be available in this edition of the JRS.
Received: 08/09/2021; Received in revised form: 05/08/2022; Accepted: 15/01/2023; Available online: 08/02/2023