
Introduction
Excessive or inappropriate speeds represent a serious road safety problem and were determined by police to be a contributory factor in 26.8% of fatal crashes on Queensland roads in 2021 (Department of Transport and Main Roads – Queensland, 2021b).
However, the contribution of speeding to casualty crashes has been argued as being widely underestimated, with estimates of the role of speeding in fatal crashes as high as 60% when combining data from multiple sources (Job & Brodie, 2022).
Indeed, many crashes involve multiple factors or more salient contributors, such as impaired driving or not wearing an appropriate restraint. Such factors may overshadow speeding, the extent of which can be notoriously difficult to determine post-crash (Doecke & Kloeden, 2013).
As an alternative to determining the proportion of police-reported crashes where speed was deemed to be a factor, several attempts have been made by researchers, with varying degrees of success, to quantify the relationships between travel speed and crash risk, and impact speed and injury risk.
Research has consistently demonstrated that vehicles travelling at faster speeds have a heightened risk of crash involvement (Aarts & van Schagen, 2006; Cameron et al., 2013; Elvik et al., 2019; Kloeden et al., 2001, 2002) and more severe consequences in the event of a crash (Kröyer, 2015; Rosén et al., 2011; Stigson et al., 2012; Tefft, 2013).
Within these studies, those using case-control methodologies to investigate the relationship between crash risk and travel speed are generally perceived as the most robust. In such studies, the estimated pre-crash travel speeds of vehicles involved in crashes (i.e., ‘case vehicles’) are compared to speeds of vehicles which were not involved in a crash (i.e., ‘control vehicles’), but were driven under comparable conditions. Using data collected mainly from 1995-1996, Kloeden et al. (1997, 2002) linked 151 crashed vehicle cases (on metropolitan South Australian roads with a 60 km/h speed limit) to 604 control vehicles. Using these data, speed-risk curves were developed to quantify the relationship between free-travelling speed and the risk of being involved in a casualty crash. The researchers estimated that the risk of involvement in a casualty crash doubles for every 5 km/h increase in travelling speed above the speed limit in urban 60 km/h zones. In a similar study, Kloeden and colleagues (2001) also developed crash-risk relationships for rural roads (80-120 km/h speed zones), using data collected from 1998 to 2000. The study linked 83 crash cases with 830 control vehicles and found that the increase in casualty crash rates related to increases in speed was greater on urban roads than the increase in serious casualty crash rates on rural roads.
The crash risk curves generated by Kloeden (1997, 2001, 2002) can be used to estimate the attribution of speeding to casualty crashes in a specified geographic location, using speed survey data that demonstrate the prevalence of speeding in that specified location. In Queensland, speed survey data have typically involved either objective speed observations, such as data from pneumatic tubes located at a representative number of sites across the state (Department of Transport and Main Roads – Queensland, 2018), or from large self-report surveys with a representative sample of Queensland drivers (Department of Transport and Main Roads – Queensland, 2021a). However more recently, network-wide Global Positioning System (GPS) probe data have been utilised to conduct speed surveys in Queensland, using data collected from in-vehicle telematics (Kemp et al., 2021).
This paper sought to examine the feasibility of using network-wide GPS probe speed data, along with existing crash risk curves, to estimate the proportion of casualty crashes attributable to driving at various speeds above the posted speed limit on Queensland roads. The objective of the research was to assess the reliability of using these data to inform speed management strategies, using GPS probe speed data from Queensland as a case study.
Methods
The current project involved two main tasks: (i) using GPS speed probe data to estimate the prevalence of different levels of speeding across speed zones in Queensland, and (ii) applying existing risk curves to the data to estimate the proportion of casualty crashes attributable to driving at different speeds above the posted speed limit. The methods associated with each of these tasks are outlined in the following sections.
Estimation of the prevalence of speeding
The quantification of crash attribution associated with speeding requires estimates of the proportion of vehicles travelling at various speeds above the posted limit across different speed zones. For this study, the prevalence of speeding was measured using network-wide GPS probe data provided by HERE technologies (https://www.here.com/), which is sourced from select in-vehicle systems, such as navigation systems. It is important to note that, at the time this study was conducted, the GPS probe data did not include data from personal mobile devices, such as smartphones.
GPS probe data were provided at a road link level across almost the entire Queensland road network, inclusive of highways, arterial roads, and local roads (approximately 900,000 road links across the state). A road link is typically defined as the length of road between any two intersections, and so link lengths vary and depend on the specific topography of the road network. In the current research, data involve average speeds for each individual road link in 60-minute intervals, for each direction of traffic flow of the link.
Average speeds were calculated across specific speed limit zones using the road network data for Queensland provided by HERE. In addition, spatial aggregation for urban and regional areas used the Accessibility and Remoteness Index from the Australian Bureau of Statistics (ABS; Queensland Government Statistician’s Office, 2019). When calculating overall average speeds, data were weighted by the number of GPS probes contributing to the data, to account for the effect of low probe counts in more rural areas. Speed observations were binned to provide estimates of the proportion of vehicles travelling in specific speed ranges, including at or below the speed limit, as well as between 1-5 km/h, 6-10 km/h, 11-20 km/h and more than 20 km/h above the speed limit.
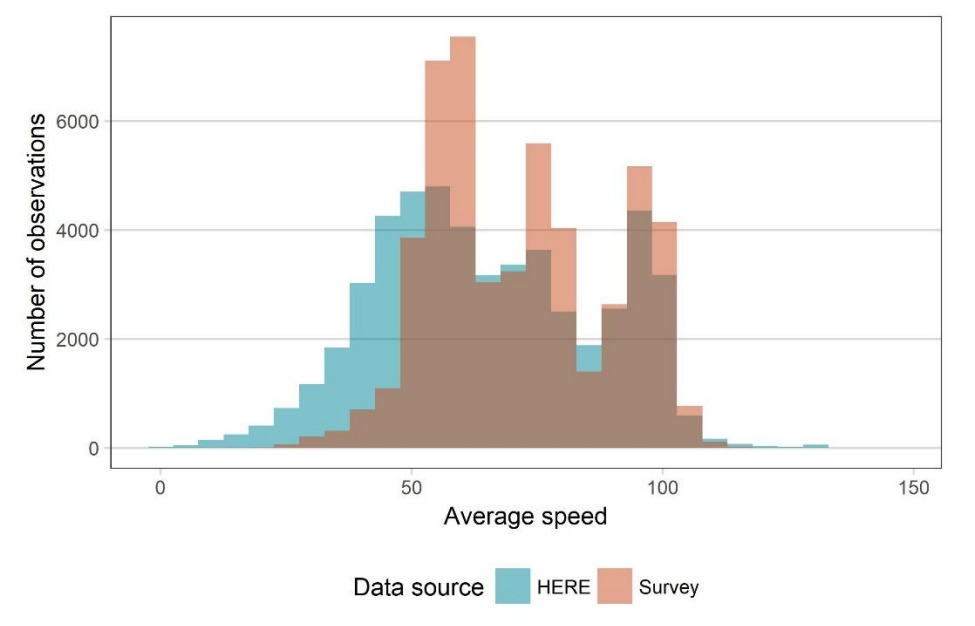
A number of important distinctions must be made when interpreting GPS probe speed data, particularly when comparing it to other speed survey data sources. Specifically, Queensland network-wide GPS probe speed data have been evidenced as detecting significantly lower average vehicle speeds compared to the previous speed survey measurement approach, namely pneumatic tubes deployed for multiple weeks at representative locations across the state (Kemp et al., 2019). Given the nature of the two types of data however, these differences are intuitive. For example, the network-wide nature of GPS probe speed data means that measurements of average vehicle speeds include deceleration and stopping (e.g., when merging; at lights, road signs or pedestrian crossings; in congestion and so on). Conversely, pneumatic tube speed surveys are designed to measure vehicle speeds at a single mid-block location and to filter out speeds which are deemed not to be free-flow speeds (i.e., speeds not constrained by a proceeding vehicle). Despite the GPS probe speed data being typically lower on average than comparable pneumatic tube survey data, previous analyses of the two data sources have shown that the distributions of speeds are relatively consistent with one another (see Figure 1).
Another important distinction associated with GPS probe speed data is the fact that it reflects multiple observations of the same vehicle. For example, if a vehicle travels along a specific route that includes a series of connected road links from which data are collected, this single vehicle will contribute to the data for each road link. Thus, prevalence estimates from GPS probe speed data do not necessarily reflect individual-level data representative of the proportion of motorists who drive at particular speeds at a given point – as is the case for speed survey data collected using pneumatic tubes. Instead, the data are more reflective of the proportional frequency at which motorists travel at various speeds across the road network. In this sense, GPS probe speed data provide much more comprehensive and rich data that capture the heterogeneity of each individual motorist’s speeding behaviour over time and space. Accordingly, prevalence data will refer to the proportion of ‘observations’ at various speeds above or below the speed limit, as opposed to the more typical reference to the proportion of ‘motorists’ or ‘vehicles’.
A preliminary analysis of a large sample of the GPS probe speed data identified that there was little variation in travel speeds across weekdays, and similarly across weekend days. Therefore, to reduce the volume of data, data collected on each Wednesday (to represent a weekday) and each Saturday (to represent a weekend day) over a 12-month period across the Queensland road network were used in the analysis. Data analysed in this paper relate to GPS probes collected from passenger vehicles during 2018 and consisted of 43,060,497 probe recordings.
For the purposes of this paper, low-level speeding was defined as travelling between 1-10km/h above the speed limit. However, analyses also examined the differential impact of travelling 1-5 km/h over and 6-10 km/h over the speed limit to provide a more comprehensive and nuanced examination of low-level speeding. Moderate speeding was defined as exceeding the speed limit by 11-20 km/h, while high-level speeding was defined as exceeding the speed limit by more than 20 km/h, consistent with the definitions used by Cameron (2015).
Estimation of the attribution of speeding to casualty crashes
To examine the impact of speeding on crashes, Population Attributable Risk Fractions (PARF) were used (Holman, 2011; Walter, 1976). PARF represents the proportion of casualty crashes that can be expected due to the increased risk associated with driving at a certain speed over the speed limit, compared to when driving at the speed limit.
Calculation of the PARFs were based on relative risk (RR) functions outlined in Kloeden et al (2002) for urban travel speeds (up to and including 70 km/h) and Kloeden et al (2001) for rural travel speeds (80 km/h and above). The urban function connecting the relative risk of a casualty crash with the free-speed (v) of individual vehicles travelling in urban speed zones is:
\[ \small{ RR(v)\ = \ exp( - 0.822957835\ –\ 0.083680149.v\ + \ 0.001623269.v2) } \]
The rural function connecting relative risk with the difference (D) between free-speed (v) and the mean speed (m) at crash locations in rural speed zones from 80 to 110 km/h is:
\[ RR(v)\ = \ exp(0.07039.D\ + \ 0.0008617.D2) \]
The RR functions were rescaled to a risk of one at each of the speed limits analysed, substituting the limit for the mean speed in the rural function. To avoid extreme estimates of RR at high speeds, each urban function was capped at 30 km/h above the limit, as per the methodology utilised by Cameron (2013), while each rural function was capped at 40 km/h above the limit. To avoid very low speeds distorting the PARF analysis, especially where a RR function suggested increased risk when travel speeds decreased, the RR was replaced by a linear decrease to zero from the lowest RR suggested by the function.
The PARF was calculated from the percentage of total passenger vehicles monitored at each individual travel speed and the appropriate RR function. The individual PARFs were subsequently grouped into ranges of low-level, moderate or high-level speeding, and represent the percentage of casualty crashes attributable to speeding in each of those ranges, respectively. Negative PARF values indicate a protective effect of travel speeds in that range (compared to vehicles travelling at the speed limit), while positive PARF values indicate crashes attributable to the increased casualty crash risk related to travel speeds in that range (again compared to vehicles travelling at the speed limit). These estimations of the attribution of speeding to casualty crashes refer to passenger vehicles only.
Results
The following sections provide an overview of the main findings of the research examining the feasibility of using GPS probe speed data to estimate the attribution of speeding to casualty crashes in Queensland. The findings regarding the prevalence of speeding and compliant behaviour are discussed first, followed by estimates of the attribution of driving at various levels over the speed limit to casualty crashes across the various speed zones.
Prevalence of speeding and compliant behaviour
Table 1 shows the proportion of passenger vehicle observations at various speeds above or below the posted speed limit, across a variety of speed limit zones. The reader is reminded that the prevalence data reflect the proportional frequency at which motorists travel at various speeds across the road network and can include multiple data points from an individual vehicle. In this sense, it differs from typical individual-level prevalence data which are representative of the proportion of motorists who drive at particular speeds at a given point. Overall, the findings demonstrate a high level of speed compliance across the Queensland road network, with the vast majority of observations at or below the posted limit across all speed zones. Compliance was particularly high in 50 km/h and 60 km/h speed zones (91.0% and 88.3%, respectively), with lower levels of compliance observed in 40 km/h, 100 km/h and 110 km/h zones (82.1%, 82.0% and 83.9%, respectively). The lowest levels of compliance were observed in 80 km/h zones (79.5%).
Notwithstanding the high levels of compliance across the speed zones, between 9.0% and 20.5% of speed observations were in excess of the posted speed limit within each zone. The prevalence of speeding was typically greater in higher speed limit zones, including 80 km/h, 100 km/h and 110 km/h zones (20.5%, 18.0% and 16.1%, respectively), however speeding was also relatively prevalent in 40 km/h zones (17.9%). Consistent with findings regarding compliance, speeding was least prevalent in 50 km/h and 60 km/h speed zones (9.0% and 11.7%, respectively).
Low-level speeding (i.e., 1-5 and 6-10 km/h over the limit) was relatively prevalent, representing between 7.6% and 17.0% of all observations across the speed limit zones, and was particularly prevalent in higher speed zones. Encouragingly, fewer than 3% of all observations were in the moderate speeding range (i.e., 11-20 km/h over the limit), while fewer than 1% of all observations were in the high-level speeding range (i.e., more than 20 km/h over the limit), in any speed zones. Moderate and high-level speeding were also found to be more prevalent in lower speed zones.
Considering only those observations in excess of the speed limit, low-level speeding was the most common behaviour, representing between 82.9% and 95.0% of all speeding observations. Conversely, between 5.0% and 16.2% of observations were in the moderate speeding range, while only 0.1% to 3.4% of observations were in the high-level speeding range. Examining low-level speeding even further, over half of all observations in excess of the speed limit were at speeds 1-5 km/h over the limit (between 53.6% and 80.1%), compared to between 14.9% and 27.4% of observations at speeds 6-10 km/h over the limit.
Estimated impact of speed on casualty crashes
Table 2 shows the PARFs for urban travel speeds, up to and including 60 km/h. Negative fractions were observed in relation to travelling speeds at or below the speed limit, representing estimated reductions in attributable casualty crashes when travelling between 1-10 km/h under the speed limit. That is, 10.9% fewer casualty crashes are estimated to occur when travelling at or below the speed limit in 40 km/h zones, with similarly fewer casualty crashes found in other speed zones, including 15.3% fewer in 50 km/h zones and 16.0% fewer in 60 km/h zones.
Conversely, positive PARF values were observed in relation to speeding vehicles, across all speed zones, reflecting that increased vehicle speeds are associated with increased casualty crashes. Perhaps not surprisingly, attributable casualty crashes rose exponentially with increased speeding level, partly reflecting the form of the RR functions used to derive PARFs. Specifically, travelling at 11-20 km/h over the limit was estimated to be associated with 15.0% of casualty crashes in 40 km/h zones, 12.3% in 50 km/h zones and 10.8% in 60 km/h zones. An even more substantial proportion of crashes was associated with high-level speeding, with travelling at more than 20 km/h over the limit estimated to be associated with 32.5% of casualty crashes in 40 km/h zones, 17.1% in 50 km/h zones and 25.5% in 60 km/h zones.
While the largest proportions of attributable crashes were associated with exceeding the speed limit by moderate to high amounts, substantial proportions of casualty crashes were also found to be associated with low-level speeding. Specifically, travelling at 1-10 km/h over the speed limit was estimated to be associated with 19.2% of casualty crashes in 40 km/h zones, 9.6% in 50 km/h zones and 9.0% in 60 km/h zones. It should be noted that the proportion of attributable casualty crashes was almost double when travelling at 6-10 km/h over the limit, compared to travelling 1-5 km/h over the limit, across all speed zones.
Table 3 shows the PARFs for rural travel speeds (80 km/h and above). Somewhat similar results to urban travel speeds are observed, with negative fractions found in relation to travelling at or below the posted speed limit across the rural speed zones investigated. This represents an estimated 11.8% fewer casualty crashes occurring due to travelling at or below the speed limit in 80 km/h zones, with similarly fewer casualty crashes found in other speed zones, including 14.7% fewer in 100 km/h zones and 16.7% fewer in 110 km/h zones.
Conversely, travelling above the posted speed limit in rural areas was found to be associated with positive PARF values, across all speed zones, again reflecting the positive relationship between vehicle speeds and casualty crashes. While the proportion of attributable casualty crashes increased with even higher speeds above the posted limit in 80 km/h zones, an interesting downward trend was found in 100 km/h and 110 km/h zones. Specifically, moderate and high-level speeding in 80km/h zones was estimated to be associated with 8.1% and 10.8% of all casualty crashes, respectively. However, the associations with crashes were comparably lower in 100 km/h and 110 km/h speed limit zones, with only 2.9% of casualty crashes in 100 km/h zones and 2.5% in 110 km/h zones being associated with moderate speeding, and correspondingly, only 2.5% of casualty crashes in 100 km/h zones and 0.4% in 110 km/h zones being associated with high-level speeding.
Once again, substantial proportions of casualty crashes were also found to be associated with low-level speeding in rural speed zones. Indeed, travelling at 1-10 km/h over the speed limit was estimated to be associated with 7.9% of casualty crashes in 80 km/h zones, 6.9% in 100 km/h zones and 5.9% in 110 km/h zones. However, unlike results in urban speed limit zones, the proportion of attributable casualty crashes were far more comparable for exceeding the speed limit by 1-5 km/h or 6-10 km/h.
Discussion
While media reports and public discourse often focus on absolute numbers of drivers exceeding the speed limit, particularly by excessive amounts, it is important to highlight the high levels of motorist compliance with speed limits across the speed limit zones examined in this research. While it is acknowledged that GPS speed probe data are reflective of network-wide speeds, rather than free-flow speeds, and thus susceptible to the impacts of congestion and other road and traffic characteristics that may reduce overall vehicle speed estimates, the high rates of compliance observed in this study are nonetheless encouraging.
Of those observations in excess of the speed limit, the majority were in the low-level speeding range. This finding is consistent with previous self-report and observational studies conducted in Queensland showing that most speeding motorists engage in low-level speeding (Department of Transport and Main Roads – Queensland, 2021a; Kemp et al., 2021). Moreover, when examining the nuances in low-level speeding, this study highlighted that most observations were for speeds of 1-5 km/h over the limit, as opposed to 6-10 km/h over, highlighting the potential influence of the social acceptability of low-level speeding, as well as perceived enforcement tolerances. It might also suggest that this behaviour may be inadvertent for some motorists and that there is a need to encourage improved speed monitoring and, when available, to utilise in-vehicle technologies, such as cruise control or intelligent speed advisory systems, to assist with speed monitoring and compliance.
The largest proportions of attributable casualty crashes were generally associated with exceeding the speed limit by moderate and high amounts. This is unsurprising given the exponential increase in crash risk as vehicle speeds exceed the posted limit by greater amounts. Nonetheless, substantial increases in attributable risk were also found in relation to low-level speeding, highlighting the dangers and total trauma burden associated with this behaviour. Indeed, even exceeding the speed limit by 1-5 km/h was associated with a notable increase in attributable risk, reflecting both the increase in crash risk and the relatively high prevalence of the behaviour, implying that the concept of ‘safe’ speeding fails to exist.
Taken together with data showing the relative prevalence of different levels of speeding, the findings demonstrate the need to develop various strategies to combat not only high-level speeding, but also low-level speeding. While high-level speeding is much more infrequent, the exponential risks associated with this behaviour means it has a much more significant association with road trauma, and particularly with more serious crash outcomes. That said, while the risk associated with low-level speeding is lower than moderate or high-level speeding, a far greater number of drivers engage in this behaviour, highlighting the collective risk associated with low-level speeding and its substantial contribution to road trauma.
The data also show the protective effect of travelling 1-10 km/h under the speed limit, suggesting evidence of potential road safety benefits associated with reducing speed limits. However, the relative risk curves used for this study are formulated to reflect risk for travel speeds relative to the speed limit so this study does not provide definitive assessment on the benefits of speed limit reductions per se.
Overall, the proportion of casualty crashes attributable to speeding tended to be greater in lower speed zones. This is likely to occur for a range of reasons, including specific characteristics of lower speed zones. Specifically, speed zones signed at 60 km/h or less are typically not designed to accommodate higher speeds, with less forgiving roadside environments that influence the severity of the consequences when a crash occurs (Department of Transport and Main Roads – Queensland, 2019). In addition, such zones often have a greater presence of vulnerable road users who are more susceptible to injury when involved in a collision.
As a result, interventions which target both high-level and low-level speeding should be a priority if greater speed compliance across the road network is to be achieved and the full potential benefits of risk reductions due to speed compliance are to be realised. Increased enforcement and lower speed enforcement tolerances may help to reduce the prevalence of speeding, and in particular low-level speeding. Innovative sanctions, such as mandatory Intelligent Speed Adaptation may be required to achieve changes in the typically resistant cohort of high-level and repeat speeding offenders.
Conversely, public campaigns, such as the previous Victorian ‘Wipe-Off-5’ road safety message, may improve community awareness regarding the risks associated with low-level speeding. In low-speed environments there may also be the potential to implement traffic calming measures to encourage speed compliance. This appears to be particularly warranted in 40km/h speed environments where the prevalence of low-level speeding was typically greatest, but casualty crashes attributable to high-level speeding was the highest of all speed zones.
Study Limitations
Notwithstanding the quality and quantity of the GPS probe data, there are some noted limitations that must be considered when interpreting the findings discussed in this paper. As previously stated, vehicle travel speeds estimated using GPS probe data are typically lower than estimates captured using other site-specific measurement approaches, such as pneumatic tubes (Kemp et al., 2019). Overall, these observed differences make intuitive sense, given that the network-wide nature of probe data makes it susceptible to the effects of congestion, deceleration and other effects associated with the geometry of the road (e.g., it does not reflect free-flow speeds). In addition, probe speed data include multiple data points from any single vehicle, associated with the series of road links through which a vehicle travels on any given route. As such, GPS probe speed data more accurately reflect the proportional frequency of speed behaviour of motorists across time and space. Despite these differences, the distribution of GPS probe speed data is relatively comparable to data sourced from pneumatic tubes, with the exception of a greater proportion of observations in the lower speed tail of the distribution associated with GPS probe data.
Given the above, the speeding prevalence estimates noted in this research may appear to suggest the data underestimate the prevalence of speeding. For example, the prevalence of moderate and high-level speeding observations in higher speed zones estimated in this study is very low. However, caution must be exercised in how these data are interpreted. The data do not suggest that fewer than 2% of motorists engage in this behaviour. Indeed, it is highly likely that a substantially higher number of motorists engage in this behaviour, but many do so for only very brief moments of their journey, and thus, in terms of the proportional frequency of this behaviour, it is relatively uncommon.
Perhaps the greatest current limitation of GPS probe speed data relate to its relative infancy as a data source. While the data provide coverage across the majority of the Queensland road network, only a small fraction of vehicles from the overall vehicle fleet (i.e., fewer than 5%) are estimated to contribute to the data. Moreover, the data are sourced from in-vehicle telematics, which are more prevalent in newer and commercial vehicles, increasing the likelihood that such vehicles are overrepresented in the data and limiting the ability of the data to represent the overall vehicle fleet. However, it is possible that this impact may produce data that represent a conservative estimate of the true prevalence of speeding, and therefore an underestimate of the overall attribution of speed to casualty crashes. Future research should aim to replicate the current study as more representative data become available.
Finally, while the research by Kloeden et al. (2001, 2002) has heavily influenced speed policy throughout Australia, the validity of these relative risk functions to accurately predict crash or injury risk, and their applicability to vehicles today, are not without question. Criticisms include different definitions of ‘casualty crashes’ used in the urban versus rural studies, wide confidence limits associated with the urban crash risk curves at high speeds, a lack of accounting for confounding variables, and significant safety improvements to vehicle fleets since when the data were originally collected (Cameron et al., 2013). Nonetheless, the crash risk estimates developed by Kloeden and colleagues remain among the most reliable and frequently used functions for predicting the contribution of low and high-level speeding to crash casualty. It is understood that a similar study of the relationships between travel speeds and serious crash risk, carried out as part of MUARC’s Enhanced Crash Investigation Study (Fitzharris et al., 2022) in recent years, will complement Kloeden et al.'s (2001, 2002) relationships by covering more modern vehicles with improved safety features affecting crash risks and injury outcomes.
Conclusions
Research has consistently demonstrated the relationship between vehicle speeds and both the risk of crash involvement and the severity of crash consequences. Nonetheless, there continues to be public debate regarding the risks associated with speeding, and in particular, low-level speeding. Precisely quantifying the attribution of speeding to casualty crashes is an inherently difficult task, due in part to the lack of reliable network-wide speed survey data. This paper has examined the feasibility of using network-wide GPS probe speed data, along with existing speed risk curves, to estimate the proportion of casualty crashes attributable to driving at various speeds above the posted speed limit on Queensland roads.
Encouragingly, analyses showed that the vast majority of speed observations were compliant with speed limits. Of those observations in excess of the speed limit, the majority were in the low-level speeding range (i.e., 1-10 km/h over the limit), and particularly 1-5 km/h over the limit. This behaviour was found to be associated with an increased attributable risk of involvement in casualty crashes, particularly in lower speed limit zones, with analyses indicating that up to 19.2% of all casualty crashes were estimated to be attributable to low-level speeding. However, the same analysis also showed the clear dangers associated with high-level speeding (i.e., more than 20 km/h over the limit), with up to 32.5% of casualty crashes estimated to be attributable to such behaviour.
Notwithstanding the limitations of speed probe data and current relative risk function estimates, the findings suggest that policies aimed at reducing both high and low-level speeding would have substantial impacts on greater speed compliance and reducing road trauma. Efforts need to be made to improve the reliability of GPS probe speed data, both in terms of the number of vehicles contributing to the data and the representativeness of those vehicles to the overall fleet. A considerable step in achieving this goal would be to identify a way to utilise GPS probes from personal mobile devices, such as smartphones, which are far more readily available. However, the difficulties associated with this – such as accuracy and multiple recordings from a single vehicle – have been noted (Bessler & Paulin, 2013; Ustun & Cetin, 2019). Future research should extend upon the current study by recalculating relative risk functions, utilising more representative data to calculate speeding prevalence and expand the scope of the research to look at other vehicle types, including heavy vehicles and motorcycles.
Author Contributions
David W. Soole: project conception, assisted with revision of report on which article is based, drafted the article, interpretation of the reported study, critical revision for intellectual contents.
Steve O’Hern: development and execution of methodology, conducted analyses, interpretation of the reported study, drafted the report from which the article is based, and critical revision for intellectual contents.
Max Cameron: development and execution of methodology, conducted analyses, interpretation of the reported study, drafted the report from which the article is based, and critical revision for intellectual contents.
Sujanie Peiris: development and execution of methodology, conducted analyses, interpretation of the reported study, drafted the report from which the article is based, and critical revision for intellectual contents.
Stuart Newstead: development and execution of methodology, conducted analyses, interpretation of the reported study, drafted the report from which the article is based, and critical revision for intellectual contents.
Warren Anderson: project conception and design, interpretation of reported study, and critical revision for intellectual contents.
Tracey Smith: project conception and design, interpretation of the reported study, and critical revision for intellectual contents.
All authors have read and agreed to the published version of the manuscript.
Funding
This work was funded by the Camera Detected Offence Program (CDOP) in Queensland. Legislation mandates that revenue generated from the CDOP, in excess of the costs of administering the program, be spent on improving state-controlled roads through road safety research, education and awareness, and supporting trauma services.
Human Research Ethics Review
For this research Human Research Ethics Review and approval was not required, as only mass de-identified data were used for all analyses. These data were principally the proportions of vehicles travelling at various speeds, as collected and provided by HERE technologies. No data were provided on the speed of an individual driver and the data provided by HERE technologies could not be reverse engineered to identify any driver.
Conflicts of interest
The authors declare that there are no conflicts of interest.
Data Availability Statement
The data that support the findings of this study is from HERE Technologies. Restrictions apply to the availability of these data, due to contractual arrangements. The data were used under licence and were provided commercial in confidence for this study. The full dataset is not able to be made publicly available. Contact the author to discuss what high-level or aggregated data could be made available.
Article History
This peer-reviewed paper was first submitted as an Extended Abstract and an Oral Presentation was recommended by two reviewers at the 2021 Australasian Road Safety Conference (ARSC2021) held in Melbourne, Australia 28-30 September 2021. The two Reviewers also recommended that the Extended Abstract be expanded into a ‘Full Paper’ and undergo further peer-review as a journal submission by three independent experts in the field. The Extended Abstract is published in the ARSC2021 Proceedings. This ‘Full Paper’ version is being reproduced here with the kind permission of the authors and will only be available in this edition of the JRS.
Received: 7/2/2022; Received in revised form: 18/8/2022; Accepted: 13/01/2023; Available online: 08/02/2023