Introduction
Injury from crashes on the road is a major health problem worldwide. It is the leading cause of death for people between the ages of 5 and 29 years and the 12th leading cause for all ages. Low- and middle-income countries are the most affected, accounting for over 90 percent of the global deaths (WHO, 2026) with speeding a key risk factor that contributes to both crash occurrence and injury severity (WHO, 2023). Studies show that, globally, more than half of crash-related deaths are attributed to speeding (Fondzenyuy et al., 2024). A 5 percent increase in speed could result in a 20 percent increase in fatal crashes (WHO, 2026). The impact of speed on vulnerable road users is disproportionate. A 1 km/h increase in impact speed can increase the probability of pedestrian death by 11 percent (Hussain et al., 2019). The Global Plan for the Decade of Action (2021-2030) emphasises speed management to achieve a 50 percent reduction in fatalities and serious injuries within ten years (WHO, 2021).
A speed hump is a category of traffic-calming measure that reduces speed through vertical deflection of the road surface. It usually has a circular, parabolic, trapezoidal or sinusoidal shape (Welle et al., 2015) and dimensions vary by length (3.7 m to 6.7 m) and height (7.5 cm to 10 cm). Danish planning and design procedures for traffic calming recommend a 10cm height and different lengths determined by speed (30 km/h: 4 m; 40 km/h: 6.5 m; 50 km/h: 9.5 m) (Djurhuus, 1999). Vertical deflections that are less than 1 m in length and more than 10 cm in height are usually called speed bumps. The Institute of Transport Engineers (ITE) Guidelines for the Design and Application of Speed Humps recommend spacing between 79 m and 152 m to limit the 85th percentile speed to 40 km/h to 48 km/h (FHWA, 2017).
The effectiveness of a speed hump to reduce speed depends on its height, length and spacing. Area-wide urban traffic-calming measures, including speed humps, have been shown to reduce injury crashes by approximately 15 percent, with reductions of 24 percent on residential streets (Elvik, 2001). At the locations of the speed humps, the speed reduction can be substantial, with reported decreases in the range of 24 to 32 km/h. Speeds between humps may also be reduced when humps are appropriately spaced, with guidance suggesting reductions of 20 to 25 per cent using well-implemented designs (City of Capitola, 2018). Evidence from Norway shows that speed humps can substantially reduce injury crashes, with reductions of up to 50 per cent reported in some evaluations (Welle et al., 2015). Before-after evaluations in Ghana across six speed hump locations identified a 37.5 percent reduction in injury crashes (Afukaar & Damsere-Derry, 2010).
The implementation of speed humps in the United Kingdom is generally restricted to roads with speed limits of 48.2 km/h (30 mph) or less, under the enabling provision in the Transport Act 1981 and detailed requirements specified in Highways (Road humps) Regulations 1999 (United Kingdom, 1981, 1999). The implementation of speed humps on bus routes is discouraged due to passenger discomfort and increased maintenance costs. If speed humps are installed on bus routes, they should be designed with a greater length and a reduced height.
Guidelines in the United States of America recommend speed humps on residential and collector streets with traffic volumes typically less than 10,000 vehicles/day, grades of less than 8 percent and no more than one lane in each direction (Los Angeles Department of Transportation, 2022). The roads should have speed limits of less than 48 km/h and the operating speed should be more than 8 km/h above the critical speed. Speed humps are not recommended on truck or transit routes.
Study setting, Addis Ababa, Ethiopia
In Addis Ababa, pedestrians account for more than 80 percent of fatalities from crashes on the road (Vital Strategies, 2017). Although disaggregated data on the causes of crashes is limited, Hirpa (2016) reported that approximately 73 percent of fatal crashes occurred at midblock sections of major asphalt roads during manoeuvres such as moving forward in traffic or overtaking. This suggests that fatal crashes often involve pedestrians and occur in high-speed environments with limited conflict points.
The city has taken several actions, including speed management measures guided by the Road Safety Strategy launched in 2017. In addition to setting a maximum speed of 50 km/h and strengthening enforcement, the city introduced infrastructure-based traffic calming to improve pedestrian safety. Overall, more than 550 round-top speed humps from asphalt concrete have been installed, primarily on major roads where fatal crashes were concentrated. The city adopted design dimensions consistent with the World Resources Institute Cities Safer by Design Guidelines, with a recommended height of approximately 10 cm and hump lengths that vary by speed (30 km/h: 4.9 m; 40 km/h, 7.4 m; 50 km/h: 10.8 m) (Welle et al., 2015).
This major undertaking by the city of Addis Ababa to improve road safety may have contributed to the substantial reduction in fatalities from crashes on the road observed since the launch of the city’s strategy (Johns Hopkins International Injury Research Unit, 2025). However, the specific contribution of speed humps to this reduction has not been extensively evaluated. Tulu et al. (2025) conducted a before-and-after study on 13 roads and reported that speed humps reduced pedestrian injury crashes by 24.45 percent. However, this study focused on selected roads and road users and did not assess the citywide impacts. It also did not fully account for potential confounding factors, such as enforcement, awareness campaigns and other infrastructure interventions.
The current study examined the citywide impact of speed humps in Addis Ababa in relation to their primary objective of reducing fatalities. It also assessed the proportion of the speed humps installed on the major roads and estimated the spacing between the speed humps using GIS tools. This study provides evidence on the effectiveness of speed humps as a road safety intervention, particularly for cities in low- and middle-income countries where technological and operational traffic management capacity is limited.
Method
Data used for this study
In June 2024, the government collected geospatial data on 557 speed humps utilising KoboToolbox. The city also had geographic coordinates for 1,118 fatal crashes that occurred for three consecutive years, from 2013/2014 to 2015/2016 (2006 to 2008 Ethiopian Calendar (E.C.)), before the construction of the speed hump began. In addition, there were georeferenced data for 862 fatal crashes that occurred over another three-year period, from 2020/2021 to 2022/2023 (2013 to 2015 E.C.), after most of the speed humps had been constructed. These data were used for spatial and statistical analyses to evaluate the citywide impacts of the speed humps.
Road type identification and speed hump spacing estimation
Road type
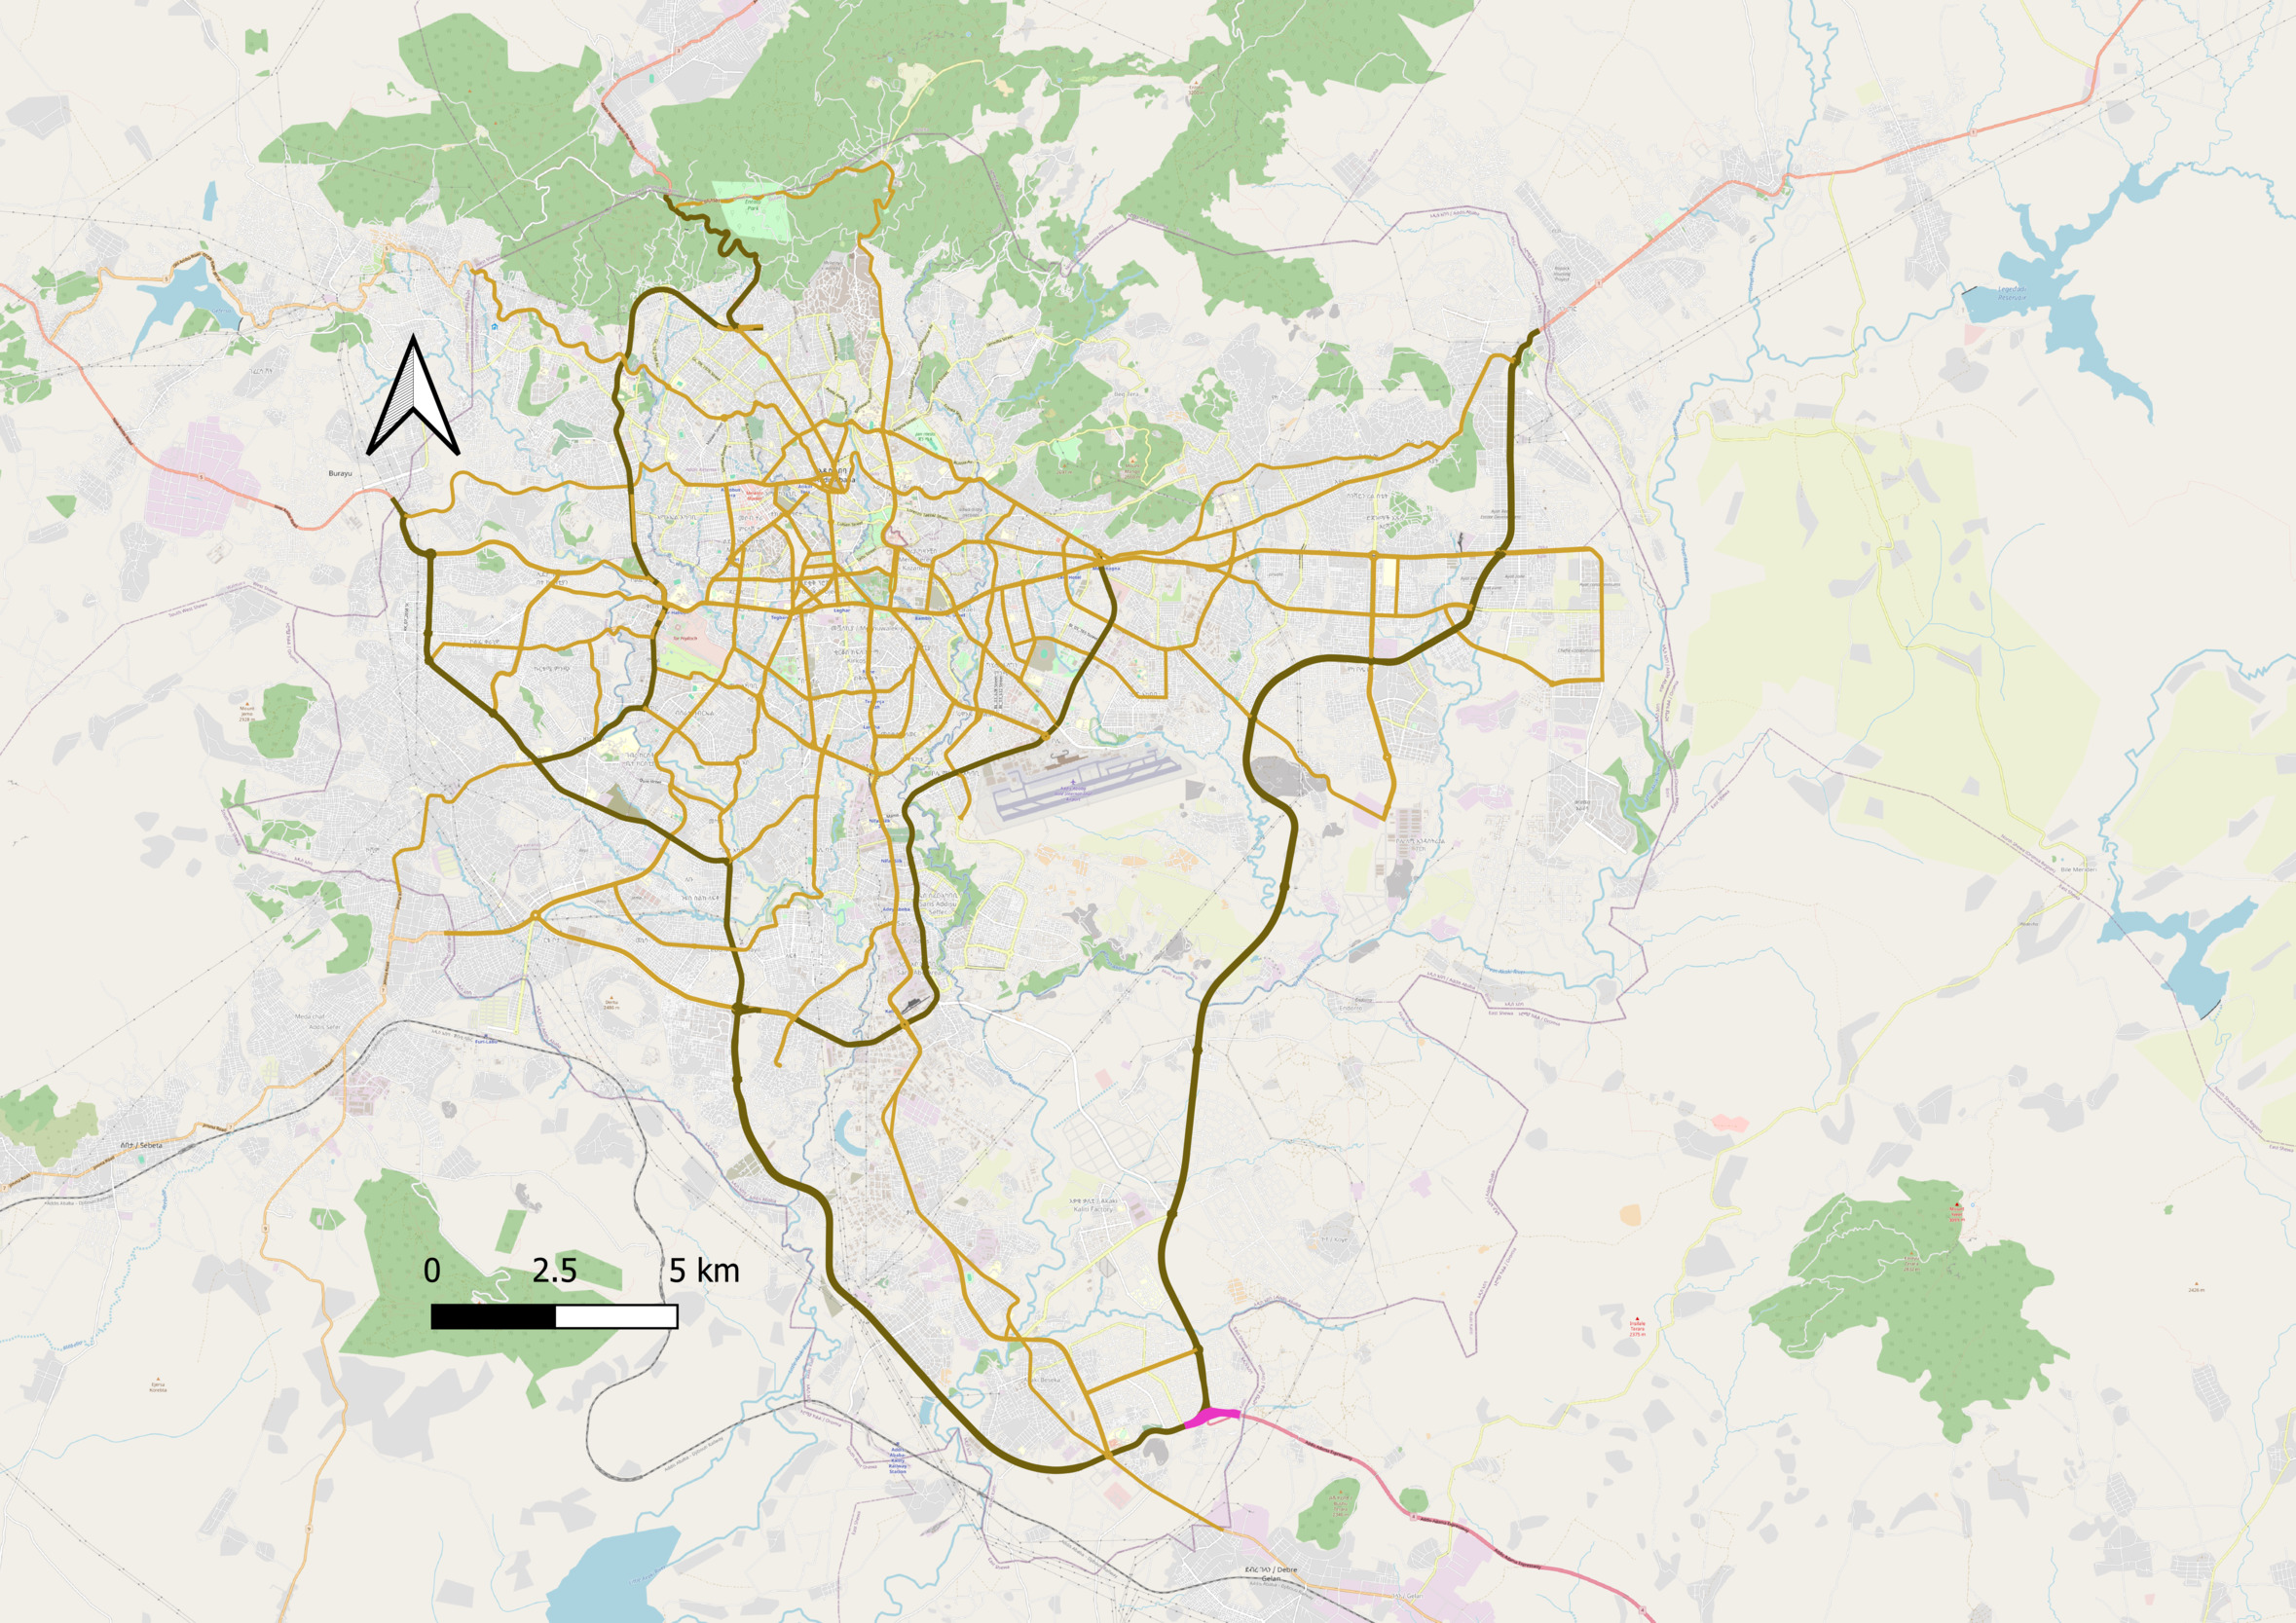
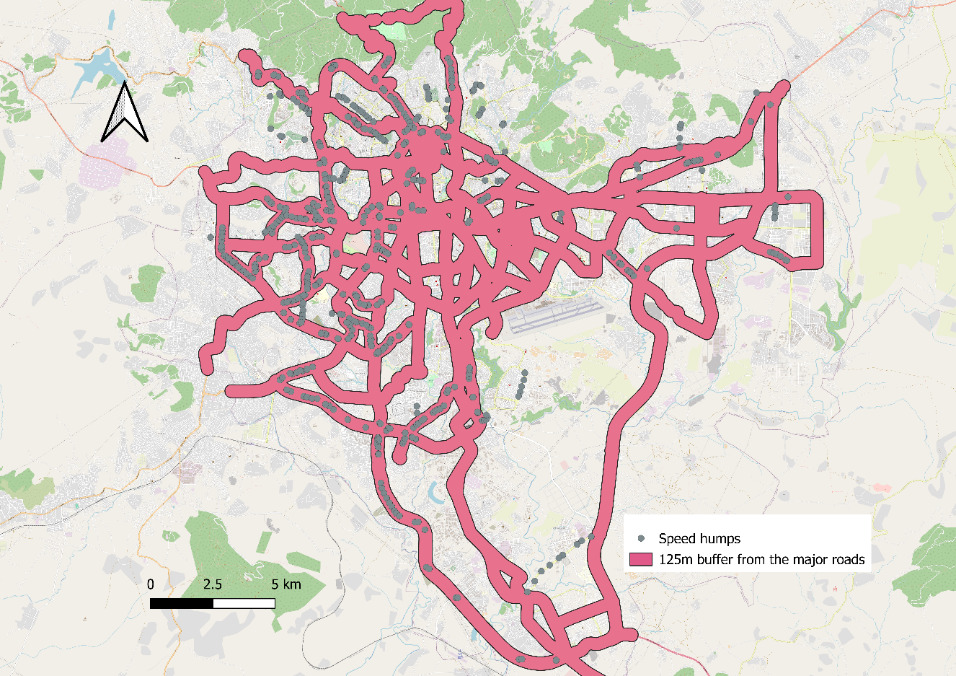
The road types on which the speed humps were constructed are identified based on the OpenStreetMap (OSM) road classification. OSM classifies roads into Motorway, Trunk, Primary, Secondary, Tertiary, Residential, Living Street, Service and Unclassified. Motorway, Trunk and Primary roads are considered major roads. Figure 1 shows the major road network in Addis Ababa. A 125 m buffer was created around the primary roads and the number of speed humps within the buffer was counted using QGIS’s Join attributes by location (summary) tool to determine the extent to which speed humps were located on major roads. Additionally, the number of crashes within the buffers created for each road category was counted to determine which road type benefited most from the speed humps.
_in_addis_ababa_based_on_osm_category.png)
Estimation of spacing between consecutive speed humps
The QGIS Distance Matrix tool was used to calculate the nearest speed hump for each speed hump and the Euclidean distance between them. For this, the speed hump layer was selected both as an input and target point layer and the unique identifier field (ID) was then selected. The k value of 1 was entered to ensure the identification of a single nearest speed hump for each speed hump. The output of the computation was a matrix that provides the nearest speed hump for each speed hump and the distance between them.
Estimation of city-wide speed hump impact on fatal crashes
Spatial analysis
A QGIS tool was used to determine the difference in the number of road traffic crashes during the two periods (before and after citywide speed hump implementation). The evaluation was conducted in six stages.
-
Prepare important georeferenced data including:
-
3 years’ crash data before 2015-2016
-
3 years’ crash data after 2020-2021
-
Speed hump location
-
-
Create a project in QGIS with layers for each data above and project them to a common CRS (EPSG: 32637)
-
Create a 250m buffer around the speed humps
- The buffer areas were dissolved to create a single feature and avoid overlapping
-
Count the number of crashes within the buffers for two periods using the “Join attributes by location (summary)” processing tool that provides an option to sum intersecting features
-
Modify the values by multiplying by the number of total reported crashes to the georeferenced crashes ratio to compensate for undercounting due to missing georeferenced crash data
-
Compare the results of the two periods
The Join Attributes by Location (summary) tool in QGIS joins features based on specific spatial criteria. For this analysis, the dissolved buffer of the speed hump was spatially joined with the crash datasets for the two periods listed above. The tool has the option to select attribute fields and a method for summarising. The crash count field was selected and the sum option was selected to obtain the total number of crashes in the speed hump buffer zone.
Comparative evaluation methods
Several methods are used in road safety practice to evaluate the impacts of interventions. The choice of the methods depends on the study purpose and the availability of the required data and analytical tools. Robust methods, such as the empirical Bayes approach, improve estimation accuracy and minimise biases due to confounding factors and regression to the mean (Hauer et al., 2002). However, these methods require pre-developed models that estimate crashes based on roads with similar characteristics and historical crash data.
For this study, the unpaired site (comparator) method was used, based on the recommendation of the Road Safety Manual for Africa, prepared by the African Development Bank (AfDB, 2014). This approach does not require the control site to be identical to the intervention sites in every respect, making it preferable to the yoked site (comparator) method. However, it does require the control area to be larger than the intervention area. Although it does not address bias due to regression to the mean, it is an improvement over naïve before-after evaluation as it accounts for confounding factors.
The unpaired site (comparator) method, including the Tanner test and the chi-squared test, was used to evaluate the city-wide impact of speed humps in Addis Ababa. Speed hump buffer zones are considered intervention areas, while the remaining areas served as unpaired control sites. The chi-squared test was used to determine whether the observed changes are statistically significant.
The Tanner Test
The Tanner k value estimates the size of the change in crash numbers, expressed as a proportion or percentage, compared to any change observed at the control site between the before and after periods.
The Tanner k formula is:
\[k = \frac{\frac{b}{a}}{\frac{d}{c}}\tag{1}\]
where,
a = number of crashes before the intervention at the intervention site
b = number of crashes after the intervention at the intervention site
c = number of crashes before the intervention at the control site
d = number of crashes after the intervention at the control site
If k<1, there has been a decrease in crashes relative to the control
If k=1, there has been no change relative to the control
If k>1, there has been an increase in crashes relative to the control
The percentage change can be calculated using Equation 2.
\[(k - 1)*100 \tag{2}\]
For the city-wide evaluation of speed hump impacts, areas where speed humps were constructed (speed hump influence areas) were considered as intervention sites whereas areas outside these influence areas were considered control sites.
Chi-Squared Test
The chi-squared test assesses where observed differences are statistically significant and provides confidence that the observed differences are unlikely to have occurred by chance. The chi-squared statistic is used to determine a significance level, which is then compared with the pre-specified significance level to decide whether there is a difference between the two populations from which the samples are drawn. A significance level of 5 percent is commonly used, which provides a 95 percent confidence level.
Equation 3 represents the chi-squared (X2) test formula in terms of the before-after crash number matrix presented in Table 1.
\[X^{2} = \frac{\left( (ad - bc) - \frac{n}{2} \right)^{2}n}{efgh} \tag{3}\]
The representation of the symbols used in the chi-squared (X2) is provided in Table 1.
The resulting statistic is compared with the critical value from the chi-squared distribution with one degree of freedom (df = 1), as the test is based on a 2 x 2 contingency table. Here, n represents the total number of crashes, calculated as the sum of the before and after crashes in both the intervention and control locations.
Results
Road type and speed hump spacing
The road type on which the speed humps were constructed
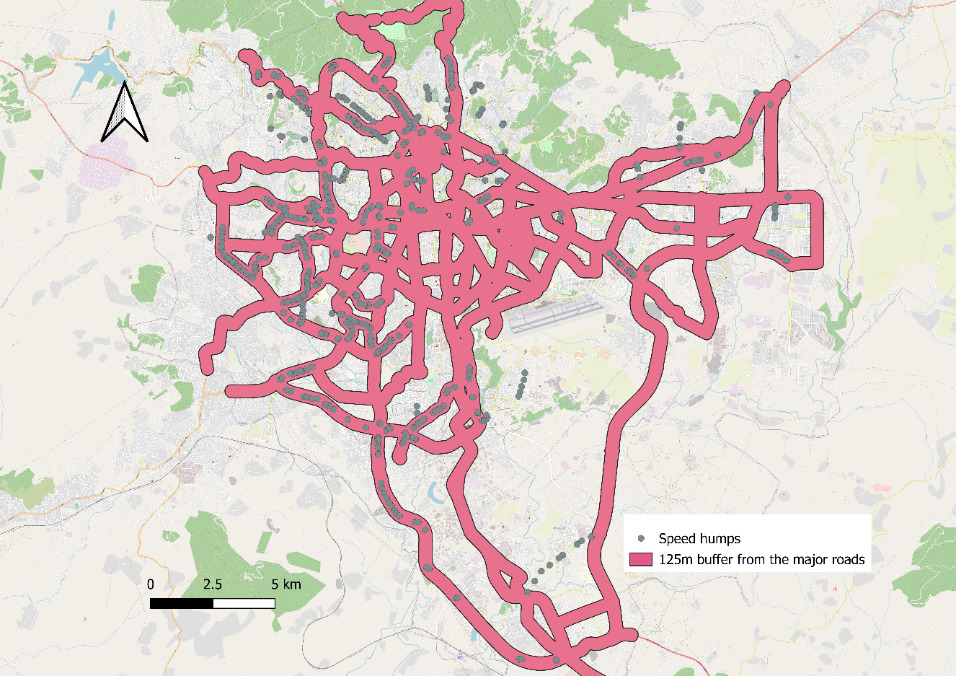
The speed hump count, conducted in QGIS by creating a 125 m buffer around the major roads (Motorway, Trunk and Primary roads according to the OSM classification), revealed that 74 percent of the speed humps fall within the buffer zone. This indicates that approximately three-quarters of the speed humps were constructed on major roads. The major road buffer areas and speed hump locations are shown in Figure 2.
Spacing
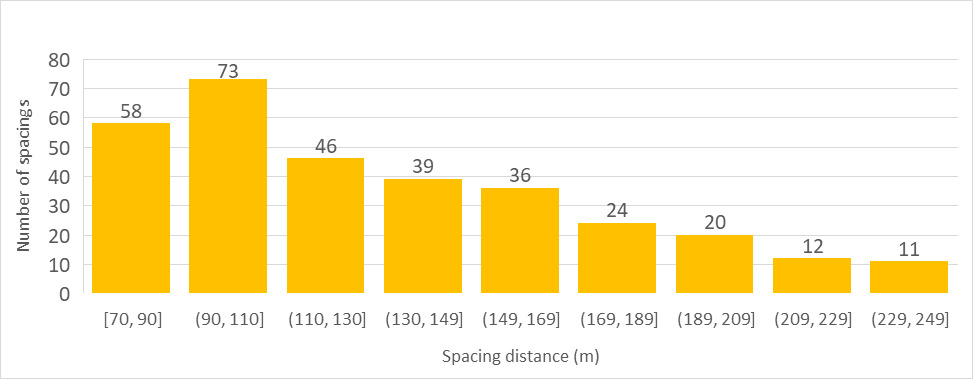
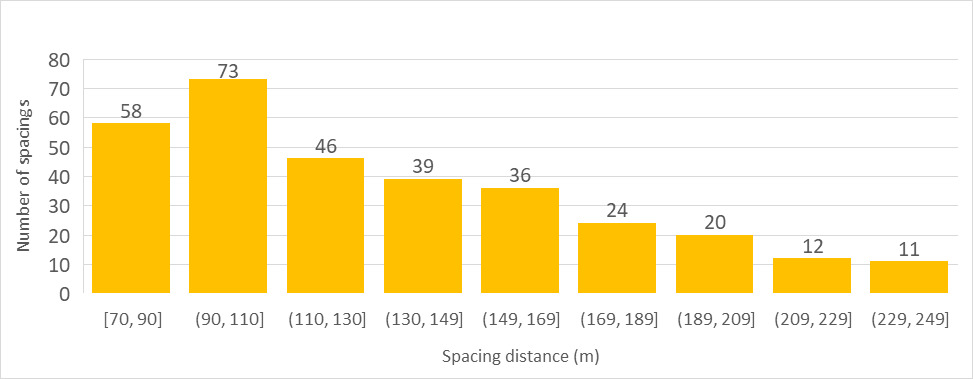
Figure 3 presents the results of the spacing analysis conducted using the QGIS Distance Matrix tool. Distances less than 70 m were excluded based on knowledge of the local context, as the city does not construct speed humps less than 70 m apart. Spacings greater than 250 m were also excluded on the assumption that speed humps separated by more than this distance function as isolated speed humps. The result shows that 31 percent of the spacings between the speed humps exceed 150 m.
Fatal crashes reduction impact
Spatial analysis result
Table 2 presents the estimated change in the number of fatalities between the two time periods based on the methodology discussed.
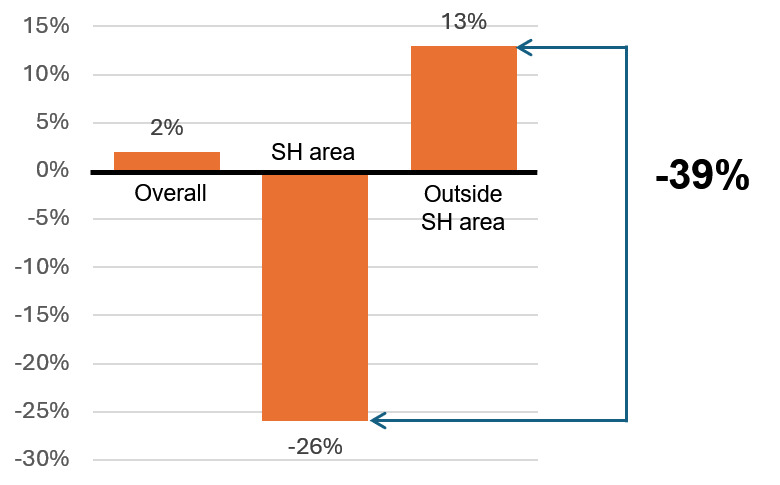
The results showed that in areas with speed humps, the number of road traffic fatal crashes decreased by 26 percent, while outside the speed hump influence areas it increased by 13 percent. Overall, fatal crashes increased by 2 percent between the two time periods.
This estimate assumes that the missing geocoded data are uniformly distributed. There were 2,367 fatal crashes for the two three-year periods, of which 83 percent have geographic coordinates. To account for missing geocoded data in the spatial analysis, we scaled up the number of fatal crashes in the buffer zones by multiplying by the ratio of the total number of fatal crashes to the number with geocoordinates for each period. For example, the number of fatal crashes in the buffer zones for 2013/2014 to 2015/2016 is estimated by multiplying 329 by 1.05 (1,174/1,118).
This assumption is considered reasonable for fatal crashes in Addis Ababa as data collection and recording are managed centrally by the Addis Ababa Police Commission unlike other crash types, which are handled by the sub-cities. Therefore, missing geographical location data are unlikely to be a localised problem. However, to assess how sensitive the results are to deviations from this assumption, a sensitivity check was conducted. The results are presented in Table 3.
To further examine the impact of uneven distribution of missing geographical location data, two additional scenarios were developed. These assume that the likelihood of missing data is 20 percent lower and 20 percent higher within speed hump areas (SHA), respectively. In the scenario where missing data are 20 percent less likely to be within the SHA, the number of fatal crashes in the SHA is estimated as
\[(185/862) * 0.8 = 342\]
where,
185 = the number of fatal crashes counted within speed hump buffer zones for the period 2013/2014 to 2015/2016
331 = the number of records with missing geographic coordinates for the same period
185/862 = the proportion of fatal crashes within the buffer zones (the scaling factor under uniform distribution)
0.8 = adjustment factor to reduce the probability of the missing geocoordinates being in the SHA by 20%
Other values are also modified in the same manner.
The sensitivity analysis indicated that the results were moderately influenced by the uneven distribution of missing geographical location data. The change in the number of fatal crashes outside SHA was less sensitive compared to the change within SHA. As the number of fatal crashes outside the SHA was higher than within SHA, the results were more sensitive to irregularities where there is less data. When the probability that the missing geographical data is in SHA varies from -20 percent to +20 percent, the estimated reduction in fatal crashes in SHA ranged from 25 percent to 29 percent.
Table 4 presents the impact of speed humps on different road types according to the OSM classification. Speed humps had a greater effect in reducing fatal crashes on lower-hierarchy roads than on higher-hierarchy roads, such as the ring roads and principal arterial roads.
Comparative analysis of changes and statistical testing
The k value for the Tanner test was determined using Equation 1, where:
a = number of fatal crashes in speed hump areas (SHA) before speed hump implementation
b = number of fatal crashes in SHA after speed hump implementation
c = number of fatal crashes outside speed hump areas (OSHA) before speed hump implementation
d = number of fatal crashes outside speed hump areas (OSHA) after speed hump implementation
The k value was calculated using the inputs provided in Table 5.
\[k = \frac{\frac{255}{345}}{\frac{938}{829}} = 0.65\]
Since k is less than 1, this indicates that the number of fatal crashes was lower in SHA than in OSHA. The relative percentage reduction in speed humps areas was calculated as:
\[(k - 1)*100 = (0.65 - 1)*100 = - 35\%\]
This indicates that fatal crashes decreased by 35 percent in speed hump areas relative to areas where speed humps were not constructed.
The chi-squared test is conducted to determine whether the change is statistically significant using Equation 3.
\[X^{2} = \frac{\left( (345*938 - 255*829) - \frac{2,367}{2} \right)^{2}2,367}{600*1,767*1,174*1,193} = \ 19.65\]
For a 95 percent confidence interval and 1 degree of freedom, the critical value from the chi-square distribution is 3.841. Since the chi-squared statistic is greater than the critical value, the reduction in fatal crashes in speed hump areas was statistically significant compared to areas without speed humps.
Figure 4 illustrates the relative difference in the number of fatal crashes. Assuming that the number of fatal crashes would have increased by 13 percent in the absence of speed humps, following a similar growth rate to areas without speed humps, 135 fatal crashes were estimated to have been prevented over the three-year period. The estimated 255 fatal crashes in speed hump areas between 2020/2021 and 2022/2023 could have reached up to 390 (345+ 345*0.13). This corresponds to an estimated 142 lives were saved over 3 years, calculated by multiplying the number of prevented fatal crashes by 1.05 (the ratio of fatalities to fatal crashes based on the recent data for Addis Ababa). Based on this estimate, approximately four speed humps saved one life over three years, or equivalently, around 12 speed humps saved one life per year.
_areas.png)
Discussion
The city implemented speed humps citywide, mostly on major roads (74%) with high speeds and casualty crashes. This is contrary to the practices in high income countries such as the United Kingdom and the United States of America, where speed hump implementation on major roads is generally discouraged. High income countries often have alternative traffic management and speed control measures to ensure road safety, which is lacking in cities in low- and middle-income countries (LMICs), including Addis Ababa. However, cities in LMICs must compare speed humps with alternative solutions available for improving road safety within their specific context. This ensures the selection of interventions that effectively prioritise saving lives while also minimising unintended negative outcomes.
The disaggregated evaluation of speed hump impacts across road categories indicated that speed humps were more effective on lower-hierarchy roads than higher-hierarchy roads (Secondary, Tertiary). On higher-hierarchy roads, the reduction is less than 30 percent while on lower-hierarchy roads it is more than 60 percent. This difference can be explained by road and traffic conditions associated with different road types. Lower-hierarchy roads typically have higher pedestrian activity and are less formally managed. Controlling speeds on such roads is likely to save more lives by reducing vehicle speeds to an acceptable level for vulnerable road user groups. This finding aligns with previous studies. For example, Rothman et al. (2015) reported that speed humps reduced more pedestrian fatalities on local roads than on collector roads in Toronto, Canada. In a city where most crashes occur on major roads and where there is limited capacity to use alternative options, the use of speed humps on these main roads may be justified as they can collectively save a substantial number of lives.
The speed hump dimensional standard used by the city is generally appropriate for major roads. The city adopted the sizes recommended by WRI’s Cities Safer by Design guidelines. The guideline recommends speed hump height of 10 cm and lengths ranging from 4.9 m to 10.8 m. Longer lengths (7.4 m to 10.8 m) are recommended for higher-speed roads such as major roads allowing drivers to maintain acceptable operating speeds while reducing the likelihood of speeding. The selected dimensions are also similar to those recommended by countries with a strong road safety performance, such as Denmark. Danish guidelines recommend chord lengths that increase with reference speed (30km/h: 4 m; 40km/h: 6.5 m; 50km/h: 10.5m) which aligns with practice in Addis Ababa.
Spacing is a critical factor, especially when the objective is to control speed over longer road segments. The maximum speed achieved between consecutive speed humps depends on the distance between them. Most guidelines recommend spacing of less than 150 m. The analysis of distance matrix outputs based on speed hump locations indicated that 31 percent of speed humps had spacing greater than the recommended 150 m. The city should therefore ensure that the spacing more closely aligns with best practice guidelines.
Several studies have shown that speed humps significantly improve road safety by reducing motor vehicle speed. Case studies of cities in LMICs, including Ghana and Ethiopia, have reported injury reductions ranging from 24.5 percent to 37.5 percent. However, these studies are based on naïve before-after studies at a limited number of locations where speed humps were implemented and they do not adequately account for confounding factors that may have contributed to changes in the number of crashes. In contrast, this study assessed the citywide impact of speed humps through spatial analysis employing GIS tools and methods such as the Tanner Test and the chi-squared test to reduce bias caused by the confounding factors and help determine whether the changes are statistically significant.
The results indicate that Addis Ababa’s extensive speed hump implementation since 2017 had a significant impact in reducing fatal crashes. Fatal crashes reduced by 26 percent within the speed hump influence areas and increased by 13 percent outside these areas. This is based on a before-after comparison using buffer-defined intervention and control areas with fatal crashes counted within and outside these areas for the two periods.
The Tanner Test has revealed that the number of fatal crashes in speed hump areas decreased 35 percent compared to areas without speed humps. In contrast to the before-after changes presented above in and outside of the speed hump areas, the Tanner test evaluated the change in the speed hump areas relative to the change in areas without speed humps. This indicated that speed hump areas became 35 percent safer than the areas without speed humps. As it measures relative changes, the result is less affected by the common influences that may affect both areas, such as citywide behavioural changes. The chi-squared test also showed that the difference was statistically significant at a 95 percent confidence level.
The results indicate that the city’s speed hump program contributed to improvements in road safety, particularly given that pedestrians account for over 80 percent of fatalities from crashes on the road. The citywide speed hump intervention may therefore be one of the contributing factors for the observed changes in the city of Addis Ababa since 2017. However, although the geocoded data lack disaggregated information about the people involved in crashes, the city’s updated road safety strategy reported that pedestrian fatalities decreased by 14 percent across the city between 2018/2019 and 2023/2024 (Addis Ababa City Administration, 2025).
Study strengths and limitations
Spatial analysis employing GIS tools enabled assessment of the citywide impact of road safety interventions using available geocoded data. The available data were adjusted using the ratio of total crashes to crashes with recorded geographical locations. This approach compensated for missing geographic location data assuming that the absence of data was randomly distributed.
The unpaired comparative methods, such as the Tanner test, addressed biases due to other factors that may have contributed to road safety at the intervention sites compared to naïve before-after and yoked site comparator methods. Combined with statistical methods, such as the chi-squared test, this approach provided a useful indicator of changes relative to locations without interventions. This approach was also practical in low- and middle-income countries where limited data and modelling capacity restrict the use of more robust methods.
The estimates were conservative as they were based on speed hump data collected in June 2024, which may have underestimated the impact of the speed humps constructed after 2020/2021. In addition, the buffer size (250 m) was relatively large. However, the wide buffer helped compensate for positional errors in the geocoded crash and speed hump data. The number of crashes within the speed humps influence areas and outside these areas was estimated by scaling using the proportion of total crashes to crashes with geocoordinates. Although approximately 83 percent of the dataset had geocoordinates, higher coverage would have improved the precision of the estimates. Sensitivity checks also indicated that the results were moderately affected when the assumption of an even distribution of missing data did not hold. The effect was more pronounced in intervention areas, which are smaller and had fewer fatal crashes than the non-intervention areas.
Furthermore, this study evaluated only the impact of the speed humps on fatal crashes. Availability and analysis of additional crash types, such as injury crashes, as well as disaggregated data on victims, would have provided a more comprehensive understanding of the impact of speed humps. For example, if such data were available, the effects on injury crashes could have been assessed in addition to the impact on fatal crashes. Other performance indicators, such as impacts on emissions, mobility, emergency vehicle response and public transport services, also require further research. Conducting additional studies with broader objectives will provide a more complete understanding of both the positive and negative effects of speed humps for practice.
The categorical analysis of road types showed that speed humps reduced the number of fatal crashes more on lower-hierarchy roads compared to higher-hierarchy roads. This finding requires further study as conditions across road categories, including crash frequency, vary substantially between road types.
Conclusions
Addis Ababa should continue the speed management efforts through proven interventions such as speed humps. The results indicate that speed humps saved many lives and contributed to a safer road transport system for vulnerable groups such as pedestrians. The city should follow appropriate guidelines in implementing speed humps to minimise design gaps, including spacing, and ensure compliance with best practices.
Given the estimated number of lives saved and the limited availability of alternative interventions, it is reasonable for cities in LMICs to continue utilising speed humps while simultaneously strengthening their traffic management systems with complementary measures such as traffic signals, Intelligent Speed Assistance (ISA), Automated Speed Enforcement (ASE) and self-enforcing road infrastructure. This aligns with the principle that human life should not be compromised for mobility and other functions of the road.
AI tools
AI tools were not used in this study nor in the preparation of this paper.
Acknowledgements
I acknowledge the Addis Ababa Traffic Management Authority for assisting me by providing me with important data.
Funding
The authors did not receive any financial support, funding, or grants for the research, authorship, or publication of this article.
Data availability statement
Data will be provided on request.
Conflicts of interest
The author declares that there are no conflicts of interest.