Introduction
Crashes on the road network continue to shape the daily realities of many low- and middle-income countries where rapid growth in mobility often outpaces safety management systems. The consequences remain deeply felt in communities, workplaces and families. Global estimates show that 1.19 million people lose their lives each year, while another 20 to 50 million suffer non-fatal injuries (WHO, 2026). Most of these losses, nearly 92 percent, occur in low- and middle-income countries, highlighting persistent structural challenges such as inconsistent enforcement, variable driving practices and varying levels of organisational safety governance.
Patterns reported across countries illustrate the ongoing severity of road safety challenges. Mauritius, for instance, recorded a steady rise in road-traffic incidents over the past decade, with vehicles involved in crashes increasing from 41,000 (2010) to more than 58,000 (2020), accompanied by a parallel increase in total reported crashes (Tandrayen-Ragoobur, 2025). Thailand reports a similar trajectory, particularly during major festive periods (e.g., Songkran, New Year), when intensified travel activities consistently result in sharp spikes in fatalities and injuries (Tandrayen-Ragoobur, 2025).
Malaysia demonstrates the same regional trends. In 2021, a total of 4,539 fatalities were recorded nationwide (Royal Malaysian Police, 2021), placing Malaysia as the second highest in road-traffic fatality rates within Southeast Asia after Thailand (Bakar et al., 2024). Rapid expansion of highway infrastructure has contributed to increasingly complex traffic environments, elevated collision risks and generates a range of serious safety challenges on major road networks (Abdul Rahman et al., 2024). Despite numerous initiatives introduced by relevant authorities to reduce crashes across the road network, these figures indicate that substantial opportunities remain to strengthen road safety efforts and reduce the overall burden of harm.
Across industry sectors, employees who drive as part of their job encounter substantially higher levels of exposure compared to individuals who commute solely between home and work. Work-related drivers spend prolonged hours on the road because mobility is embedded within their operational duties. Examples of these roles include delivery personnel, taxi operators, field technicians and mobile service workers. In contrast, commuters typically undertake routine and predictable journeys with limited daily variation. This fundamental difference in purpose and duration translates into markedly different risk profiles.
Evidence from the European Commission indicates that 40–60 percent of fatal occupational crashes involve road crashes, demonstrating the centrality of roadway exposure in many job roles (European Commission, 2015). International findings reinforce this pattern. In Australia, almost a third of total road traffic is attributed to work-related vehicle use, while in Britain as many as one-third of all reported crashes involve an individual driving for work (Warmerdam et al., 2017). Additional data show that drivers whose annual mileage is largely work-related face nearly 50 percent higher injury-collision rates than comparable drivers with similar socio-demographic characteristics (European Commission, 2009). These elevated risks are strongly shaped by organisational conditions, including scheduling pressures, fleet characteristics, monitoring and reporting systems and performance expectations placed on employees.
Previous studies suggest that organisational safety climate, management commitment, and employer motor vehicle safety policies play an important role in influencing employees’ driving behaviours and crash involvement (Wingate et al., 2023; Yılmaz et al., 2022). Research conducted across transport-intensive industries also indicates that organisational safety climate, management commitment and communication practices significantly influence employee compliance with safe driving procedures and incident reporting systems (Mooren et al., 2014; Newnam, Warmerdam, et al., 2017). These findings demonstrate that work-related road safety is not solely dependent on individual driver behaviour but is also shaped by broader organisational systems and operational expectations. Collectively, these findings underscore the significant influence of organisational policy, sectoral practices and management structures on the safety outcomes of work-related drivers.
Malaysia faces comparable challenges, particularly in rapidly developing regions such as the Klang Valley, where expanding job opportunities and improved transport networks continue to draw a growing workforce. Abdullah (2003) reported a steady rise in suburban populations associated with increased employment concentration and enhanced regional connectivity, while Zahari et al. (2023) estimated Kuala Lumpur’s 2024 population at 8.82 million, indicative of ongoing urban expansion. As economic activity intensifies, housing near major employment centres has become increasingly unaffordable, prompting many lower- and middle-income workers to relocate farther from their workplaces. This shift lengthens daily commuting distances and increases exposure to road traffic crash risks (Bautista-Hernández, 2021; Liu & Bardaka, 2021). Evidence from a cohort of 10,000 Malaysian healthcare workers showed substantially higher injury rates during home-to-work travel compared to the return journey (Zuwairy et al., 2020). National statistics reinforce this trend. Commuting-related crashes rose by 17 percent, from 2022 (33,421) to 2023 (39,152) (The Social Security Organisation (SOCSO), 2023), while earlier findings indicated that 88 percent of work-related crashes occurred during commuting, with morning travel accounting for nearly 69 percent of cases (Bin, 2014). These findings indicate that commuting exposure and daily travel demands remain significant contributors to work-related road safety risks in Malaysia, particularly during peak-hour travel periods.
Research increasingly recognises that commuting-related crash risk is closely associated with organisational scheduling structures, workload demands and employment arrangements. Long commuting distances, irregular working hours and productivity pressures have been linked to fatigue, stress and higher crash involvement among workers in several occupational sectors (Murphy et al., 2023; Useche et al., 2019). Similar observations have been reported in rapidly urbanising regions where housing affordability and urban sprawl force workers to travel longer distances between residential and employment centres (Liu & Bardaka, 2021). These structural conditions suggest that commuting safety must be understood as both a transportation issue and also as an organisational and socio-economic concern. Prior research demonstrated that employer responsibilities and internal policy mechanisms, such as workload management, scheduling pressures and resource provision, substantially affect safety compliance among vehicle operators (Nguyen-Phuoc et al., 2022). Further, variations in safety management and policy enforcement across industries contribute to differences in organisational risk profiles and crash outcomes (Tsairi & Martens, 2024).
Together, these insights emphasise that risks during commuting in Malaysia is affected by both individual travel behaviour and also by broader structural factors, including urban spatial organisation, housing-market dynamics and organisational scheduling demands.
Work-Related Road Safety (WRRS) has emerged as a key organisational mechanism for reducing work-related road risks and ensuring the safety of employees whose job roles require regular travel. Although WRRS practices differ across countries due to variations in regulatory structures and industry norms, most frameworks emphasise clear organisational policies, operational guidance and systematic monitoring to reduce risk exposure. Evidence shows that WRRS programmes focusing on fleet management, driver risk assessment, structured policy communication and continuous evaluation have substantially improved organisational safety outcomes (Murray et al., 2012). Research highlights the importance of accurate incident reporting and surveillance systems to help organisations identify high-risk patterns and support targeted interventions (Newnam, Goode, et al., 2017). Several researchers have reported that organisations with formalised monitoring systems, continuous safety audits and proactive reporting cultures tend to achieve stronger WRRS performance compared to organisations with fragmented or reactive safety approaches (Murray et al., 2012).
However, implementation challenges remain common across low- and middle-income countries, where differences in regulatory enforcement, organisational resources and safety priorities continue to affect the consistency of WRRS practices across sectors (Shewiyo et al., 2021). These variations highlight the importance of examining sector-specific organisational characteristics when evaluating WRRS performance. Concerns about insufficient employer responsibility have been raised in Malaysia, where commuting-related injuries have been linked to inconsistent organisational road-safety oversight (New Straits Times, 2023). Similar gaps exist in other LMICs where limited incident-notification systems have contributed to underreporting of work-related injuries (Shewiyo et al., 2021) and reinforce the need for stronger organisational governance and system-level monitoring to support effective WRRS implementation across industries.
Evidence from international transport authorities demonstrates clear differences in exposure across industry sectors. Data from the Department for Transport, Local Government and the Regions (DTLR) in the United Kingdom indicate significantly higher annual mileage for company-operated motor vehicles (~34,746 km), compared to privately owned vehicles (~13,518 km) (Broughton et al., 2003). Higher operational mileage exposes work-related drivers to greater risk, particularly when operating heavy goods vehicles, buses, vans, taxis, company cars, or emergency vehicles (Fort et al., 2010). Public- and private-sector organisations in transport, logistics, manufacturing, utilities and public services experience different levels of crash risk due to varying operational demands and fleet structures, contributing to measurable differences in crash rates across sectors. Sectoral differences in fleet composition, driving exposure and operational responsibility further contribute to variations in WRRS performance. Transportation organisations commonly manage heavy vehicles, commercial fleets and professional drivers who accumulate high annual mileage and prolonged roadway exposure. In contrast, organisations in manufacturing and public services often rely on light vehicles operated by employees whose primary tasks are not directly related to driving (Fort et al., 2010; Useche et al., 2019). These operational differences may influence organisational emphasis on journey management, driver monitoring and safety governance practices.
The evidence across these sections shows a consistent pattern: employees engaged in work-related mobility face substantially higher levels of road-traffic risk, shaped by structural urban pressures, organisational practices and sector-specific operational demands. Although WRRS frameworks provide structured approaches to managing these risks, their adoption and effectiveness vary significantly across industries and gaps remain in policy enforcement, monitoring and reporting. These issues are particularly relevant in Malaysia, where commuting and work-related road incidents continue to increase. Collectively, the existing literature demonstrates that work-related road safety is shaped by a complex interaction between organisational governance, operational exposure, commuting demands and sector-specific safety practices. Although previous studies have explored individual aspects of WRRS, limited research has systematically compared WRRS performance across multiple economic sectors within the Malaysian context. This gap limits understanding of how organisational structures and operational environments influence safety management practices and crash exposure across industries. This study addresses these gaps by examining sectoral variations in work-related driving behaviours and identifying the organisational factors that shape these risk patterns, with the aim of informing more effective WRRS strategies and strengthening industry-specific policies.
Methods
Data description
This study assesses Work-Related Road Safety (WRRS) management practices among companies located across Malaysian regions, including Johor, Malacca, Negeri Sembilan, Selangor, Kuala Lumpur, Putrajaya, Perak, Pahang, Kelantan, Terengganu, Kedah, Sarawak and Pulau Pinang.
A structured self-assessment questionnaire was used to collect information on WRRS governance, fleet characteristics, driver profiles and safety management practices. The assessment framework covered five core dimensions: management system, monitoring and assessment, driver management, vehicle management and journey management. These dimensions were applied to 48 companies across three economic sectors, namely transportation, manufacturing and public services, to allow for structured comparisons of sector-level differences in WRRS implementation.
Data collection procedure
Data were collected through on-site assessments at all 48 companies. Each organisation was informed in advance and a designated representative supported the assessment process. The questionnaire served as a compliance checklist and was completed by the researcher during direct observation, using a three-point response format (1 = Yes, 2 = No, 3 = Don’t know). This ensured consistent scoring and interpretation across all participating organisations.
The questionnaire also captured background information on the personnel responsible for WRRS within each organisation. Responses were used to contextualise how WRRS is managed by documenting the person’s qualifications, experience and scope of responsibility. These factors commonly influence the effectiveness of safety governance and the operationalisation of WRRS practices.
Measurement and variables
The WRRS assessment framework is organised around five core dimensions that represent the essential components of organisational road safety management. The first, the management system, focuses on how organisations support coordination, learning and operational consistency through leadership commitment, adequate resource allocation, clearly defined responsibilities and effective communication of WRRS policies. Example questionnaire items under this dimension include: ‘Are there any documented roles, responsibilities and authorities as well as performance criteria specifically for WRRS in your organisation?’ and ‘Is there any specific WRRS policy in your organisation?’.
The second-dimension addresses monitoring and assessment, recognising the importance of systematic processes for identifying risks, analysing crash patterns and implementing preventive measures. Earlier research has noted challenges in securing consistent industry participation in WRRS evaluations, highlighting the need for structured monitoring mechanisms within organisations (Grayson & Helman, 2011). This dimension evaluates practices such as incident investigation, root-cause identification, development of preventive actions, use of key performance indicators (KPIs) and the integration of recognition systems that reinforce positive safety behaviours (Grassini & Laumann, 2020). Example items include: ‘Is there any mechanism in place to monitor WRRS performance on a regular basis?’ and ‘Is there any mechanism in place to identify and recognise good or poor driving performance in the organisation?’.
The remaining dimensions, namely driver management, vehicle management and journey management, capture the operational aspects of WRRS. Organisational emphasis on safety plays a critical role in shaping driver behaviour, with evidence showing that drivers adopt safer practices when supervisors and fleet managers prioritise safety protocols and expectations (Mooren et al., 2012). These dimensions cover key practices such as driver training, induction procedures, competency assessments, fleet vehicle selection and maintenance and journey planning. Indicators derived from the road safety pyramid framework, including behavioural and attitudinal factors, policy practices, environmental conditions and injury metrics, are incorporated to provide a comprehensive view of how organisational mechanisms influence work-related road safety (Gitelman et al., 2013). Example questions include: ‘Is there any procedure in place to conduct pre-hire driving history checks for drivers?’, ‘Is there any routine maintenance conducted on fleet vehicles?’ and ‘Does the organisation have the formal mechanism to assess the needs for trips?’.
In addition to the questionnaire survey, semi-structured interviews were conducted with selected organisational representatives using the same WRRS dimensions and assessment indicators. The interviews aimed to obtain further explanation regarding existing WRRS practices, implementation challenges, monitoring approaches, driver management procedures and organisational safety culture. Questions related to WRRS policy implementation, driver performance monitoring, vehicle maintenance practices and journey planning procedures.
The descriptive characteristics of participating organisations are summarised in Table 1 and provide an overview of organisational size, workforce composition and reported crash involvement across sectors. These statistics highlight important sectoral differences that are relevant to WRRS performance and form the basis for subsequent analytical comparisons in this study.
Data analysis
The data analysis for this study was conducted in two stages, namely primary analysis and principal analysis, to provide both an initial overview of organisational WRRS practices and a deeper examination of sector-level variations. Two analytical techniques were employed: descriptive statistics and one-way Analysis of Variance (ANOVA). Descriptive statistics formed the basis of the primary analysis by summarising organisational characteristics and WRRS performance patterns, while the principal analysis relied on descriptive comparisons and ANOVA to identify statistically significant differences in WRRS implementation across the transportation, public services and manufacturing sectors.
The WRRS Assessment Rubric was applied using information collected through structured interviews and site visits with organisational representatives responsible for WRRS. Data obtained from the questionnaire were systematically evaluated across five dimensions, namely management system, monitoring and assessment, driver management, vehicle management and journey management. Each dimension was rated on a four-level compliance scale, where 1 indicates the highest compliance and 4 indicates the lowest compliance. This method provides a structured and comparable assessment of each organisation’s alignment with established WRRS standards.
Descriptive statistics were used to summarise the characteristics of all 48 participating organisations across the three sectors: transportation, manufacturing and public services. These sectors were selected due to their substantial dependence on work-related mobility, which heightens exposure to road traffic risks. To facilitate more meaningful comparisons, organisations were categorised by size, with firms employing 250 or more workers classified as large enterprises and those with fewer than 250 workers classified as small and medium-sized enterprises (SMEs). This stratification supports a clearer interpretation of differences in WRRS implementation across organisational scales.
One-way ANOVA was conducted to examine whether WRRS performance differed significantly across the three organisational sectors. In this analysis, the dependent variables were the WRRS scores for each of the five dimensions, while sector type served as the independent variable. ANOVA was selected because it enables the detection of statistically significant differences in group means, thereby indicating whether WRRS implementation varies systematically across sectors.
Six ANOVA models, one for each WRRS dimension, were estimated. Significant results were followed by Dunn-Bonferroni post-hoc tests to identify sectoral differences controlling for Type I error and partial eta squared (η²p) was calculated to quantify effect sizes. Together, these analyses provide robust evidence of sector-level variation in WRRS performance and indicate the organisational dimensions in which these differences are most pronounced.
Results
The results of this study are presented in two main parts. The descriptive analysis profiles the participating organisations, including their sectoral distribution and company size. This overview establishes the structural context in which Work-Related Road Safety (WRRS) practices are implemented. It then examines sector-level differences in WRRS performance, drawing on detailed assessment scores and statistical analyses to identify patterns across the transportation, manufacturing and public services sectors. Together, these findings provide a comprehensive understanding of organisational characteristics and their relationship with WRRS outcomes.
Descriptive analysis
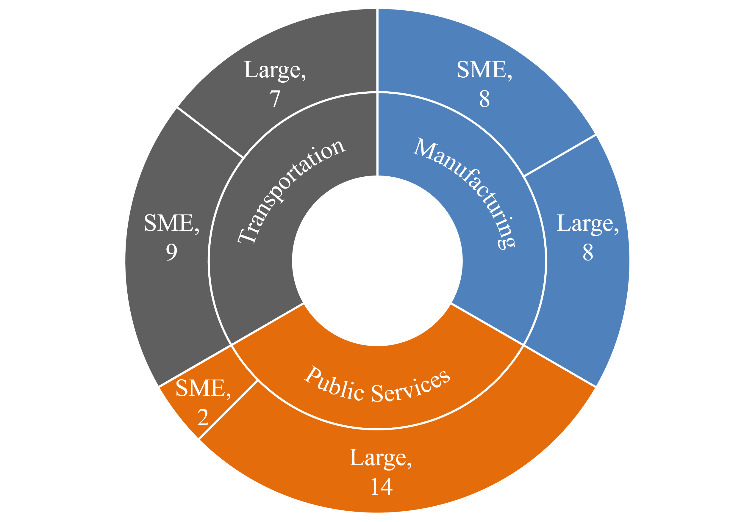
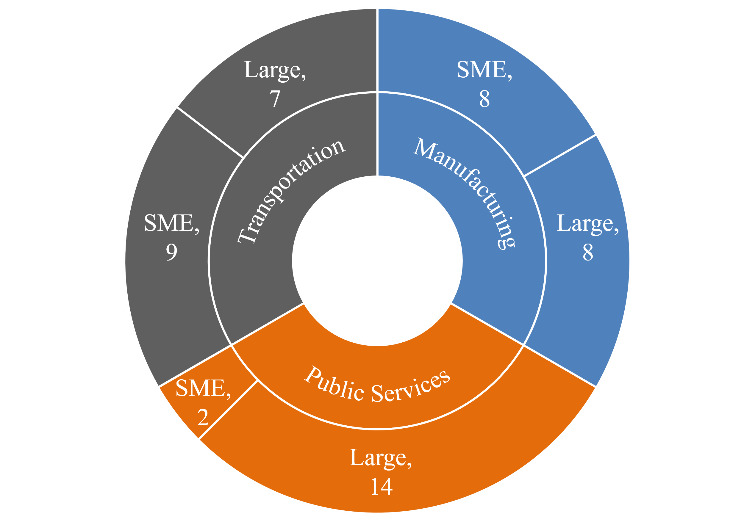
Figure 1 show the distribution of companies based on type and size of organisation. A total of 48 organisations participated in this study, with an equal allocation of 16 organisations across each sector. The figure shows clear variation in organisational size across the sectors. In the manufacturing sector, large enterprises (eight organisations) and SMEs (eight organisations) are represented in equal proportion. The transportation sector consists of nine SMEs and seven large enterprises, indicating a slight predominance of smaller firms in this sector. In contrast, the public services sector is overwhelmingly dominated by large organisations, with 14 large entities and only two SMEs represented.
Overall, the sample comprises 29 large organisations (60.4%) and 19 SMEs (39.6%). This distribution underscores the prominence of large entities within the selected sectors and provides a balanced foundation for examining how WRRS practices vary across different organisational scales and industry contexts.
Analysis of Variance (ANOVA)
This section reports the results of the one-way ANOVA and Bonferroni post hoc tests conducted to compare WRRS performance across three organisational sectors: transportation, manufacturing and public services. The analysis covers five WRRS dimensions, namely Management, System and Processes; Monitoring and Assessment; Driver Management; Vehicle Management; and Journey Management. This is followed by the results for the overall WRRS score.
The comparison of WRRS performance across organisational sectors was examined using a series of one-way ANOVA tests, with the consolidated results presented in Table 2. Significant sectoral differences were observed for several WRRS dimensions, beginning with the Management, System and Processes element, where the ANOVA indicated a statistically significant effect, F (2,47) = 5.76, p = .006, η² = 0.204. Manufacturing recorded the highest (and therefore poorest) mean score (3.02 ± 0.70), followed by Transportation (2.48 ± 0.70) and Public Services (2.23 ± 0.62). Post hoc comparisons showed that the Manufacturing sector scored significantly higher than Public Services (p = 0.005), while no significant differences were identified between Transportation and either sector (p > 0.05). A similar pattern emerged for Monitoring and Assessment, where ANOVA results reached statistical significance, F (2,47) = 3.20, p = 0.050, η² = .124. Manufacturing again exhibited the highest mean score (2.96 ± 0.56), compared with Transportation (2.69 ± 0.95) and Public Services (2.35 ± 0.39). The Bonferroni test indicated a significant difference between Manufacturing and Public Services (p = 0.03), with Transportation showing no significant differences relative to either sector (p ≥ 1.00).
For Driver Management, the ANOVA was statistically significant, F (2,47) = 3.276, p = 0.05, η² = 0.13, with Manufacturing producing the highest mean score (2.81 ± 0.50), followed by Public Services (2.33 ± 0.47) and Transportation (2.29 ± 0.87). Despite this overall significance, Bonferroni post hoc comparisons revealed no statistically significant pairwise differences (p > 0.05), indicating that the observed variation did not persist after adjustment for multiple comparisons. No significant sectoral differences were identified for Vehicle Management, F (2,47) = 0.80, p = 0.45, η² = 0.04. Mean scores were relatively similar across sectors, ranging from 2.19 (Transportation and Public Services) to 2.47 (Manufacturing) and the post hoc test confirmed the absence of significant pairwise differences (p > 0.05), suggesting more uniform vehicle-related safety practices across industries.
Significant sectoral variation reappeared in Journey Management, where the ANOVA indicated a meaningful difference, F (2,47) = 4.37, p = 0.02, η² = 0.16. Manufacturing reported the highest mean (3.00 ± 0.97), followed by Public Services (2.38 ± 0.62) and Transportation (2.13 ± 0.96). Bonferroni results showed that Manufacturing scored significantly higher than Transportation (p = .019), while no other pairwise comparisons reached statistical significance (p > .05). Finally, an evaluation of the overall WRRS score also revealed statistically significant differences, F (2,47) = 4.41, p = 0.02, η² = 0.16. Manufacturing continued to record the highest overall WRRS score (2.85 ± 0.48), compared with Transportation (2.35 ± 0.83) and Public Services (2.30 ± 0.33). Post hoc analysis confirmed that the Manufacturing sector scored significantly higher than Public Services (p = 0.029), with no significant differences emerging between Transportation and either sector (p > 0.05).
Discussion
The findings of this study reinforce the view that work-related road safety performance is shaped by both individual driving behaviour as well as by organisational systems, managerial practices and the structural characteristics of different industry sectors. Meaningful sector-level variation emerged across several WRRS dimensions, particularly those related to governance and operational control, highlighting the differing regulatory demands, safety cultures and mobility requirements of the transportation, manufacturing and public services sectors.
The manufacturing sector consistently recorded the poorest WRRS scores across multiple WRRS elements, including Management, System and Processes; Monitoring and Assessment; Journey Management; and the overall WRRS index. These results suggest that manufacturing organisations face greater challenges in embedding structured WRRS governance, particularly in areas involving formal oversight, compliance monitoring and systematic reviews. This is consistent with earlier research showing that manufacturing firms often prioritise production efficiency and occupational safety within premises while road safety receives comparatively less organisational attention because road travel is not viewed as a core operational activity (Mooren et al., 2014; Murray et al., 2012). Although many manufacturing operations include scheduled deliveries or employee commuting, these activities may be less tightly regulated than internal safety processes, contributing to the weaker WRRS performance observed in this study.
In many manufacturing organisations, driving activities are often secondary to the core production function and are commonly performed using light vehicles such as passenger cars, vans, or small lorries for administrative duties, deliveries, or supplier coordination. Employees involved in these activities are typically not professional drivers and may divide their responsibilities between driving and other operational tasks. As a result, formal journey planning, driver monitoring and specialised WRRS management practices may receive less organisational emphasis.
In contrast, the public services sector demonstrated more favourable results in several key WRRS dimensions, scoring significantly better than manufacturing in Management, System and Processes; Monitoring and Assessment; and the overall WRRS score. Public service agencies typically operate under stricter administrative oversight, structured procurement systems and more formalised reporting requirements, which collectively strengthen organisational road safety management (OECD, 2016). Many public service organisations manage large, centrally governed fleets, particularly in healthcare, municipal services and enforcement agencies and therefore cultivate more consistent safety policies, clearer accountability structures and routine monitoring procedures. Public service fleets are generally dominated by light vehicles, including passenger cars, utility vehicles, ambulances and enforcement vehicles. Similar to the manufacturing sector, many public service employees use vehicles as part of broader occupational responsibilities rather than serving as full-time professional drivers. However, stricter administrative structures and government reporting systems may contribute to stronger WRRS governance within this sector.
The transportation sector was consistently ranked in an intermediate position across all elements, with mean scores consistently better than manufacturing but not significantly different from public services in any WRRS dimension. This pattern represents the nature of transportation activities, where safety is operationally embedded but performance varies widely depending on fleet size, operational conditions, subcontracting arrangements and driver turnover (Useche et al., 2019). Although transportation companies generally implement formal safety protocols due to regulatory requirements and insurance obligations, their diverse operational settings often introduce inconsistencies in monitoring practices and journey management. The transportation sector also differs from the other sectors because driving is the primary occupational activity for many workers, particularly professional drivers operating heavy vehicles, buses, lorries, trailers and commercial delivery fleets. Drivers in the transportation sector generally experience longer driving exposure, higher mileage accumulation and more complex journey demands compared to workers in manufacturing or public services who drive occasionally as part of secondary job responsibilities. This may explain why the Transportation sector did not significantly outperform or underperform the other sectors.
Several WRRS components did not exhibit significant differences across sectors. For Driver Management and Vehicle Management, the absence of statistically significant variation suggests that these elements are embedded uniformly across organisations regardless of sector type. This may indicate widespread adoption of basic fleet safety principles, such as scheduled vehicle maintenance, compulsory licensing and driver induction, that are commonly practiced across industries due to regulatory norms and organisational liability concerns (Grayson & Helman, 2011). These shared practices likely contribute to the convergence of scores in these two WRRS elements.
Journey Management displayed one of the clearest sector differences, with the manufacturing sector scoring significantly poorer than the transportation sector. This is expected given that journey planning, scheduling, route risk assessment and trip supervision are core functions in the transportation sector, whereas manufacturing firms perform these activities less frequently and often outsource transport operations (Murray et al., 2012). Transportation organisations are also more likely to utilise dedicated fleet supervisors, professional drivers and structured dispatching systems because driving activities directly influence operational productivity and service delivery. Consequently, manufacturing organisations may not possess the same capacity or operational experience to manage journey-related risks, contributing to the significantly poorer performance observed in this study.
Overall, the ANOVA results indicate that organisational governance and systemic safety management, rather than driver-specific or vehicle-specific practices, play a more critical role in distinguishing WRRS performance across sectors. This highlights the importance of organisational safety culture, leadership commitment, and structured safety management and monitoring systems, which have been widely recognised as essential components of effective work-related road safety programmes (Mooren et al., 2014; Murray & Watson, 2010; Newnam, Warmerdam, et al., 2017). The findings reinforce calls for a sector-sensitive approach to WRRS improvement, one that considers differences in mobility exposure, regulatory environments and operational structures.
These results also demonstrate that strengthening WRRS requires active engagement from both employers and employees. Prior work has shown that organisational climate, managerial commitment and clarity of safety responsibilities strongly influence road-user behaviour among workers (Mooren et al., 2012). The higher crash involvement in the transportation sector during work-related trips and in public services during commuting underscores the need for more robust monitoring and incident reporting systems, as organisational safety culture is known to affect both crash risk and near-miss disclosure. Mokarami et al. (2019) identified strong links between safety culture and crash risk among bus drivers in public transport, while Nævestad et al. (2020) demonstrated how fleet safety culture and reporting systems influence crash rates in trucking operations.
In sum, this study contributes to emerging WRRS research by showing that sectoral differences in organisational systems, governance structures, monitoring practices and journey-related procedures meaningfully shape WRRS performance. The findings reinforce the necessity for targeted, sector-specific interventions, particularly within the manufacturing sector, where weaknesses in governance and monitoring appear most pronounced. Strengthening WRRS frameworks requires sustained organisational investment, systematic monitoring, leadership commitment and continuous review to ensure safer work-related mobility across all sectors.
Implications for policy and practice
The findings of this study provide several implications for strengthening WRRS governance and operational practices across Malaysia’s key economic sectors. The sectoral differences observed, particularly the consistently weaker performance of manufacturing organisations and the relatively stronger performance of public service agencies, highlight the need for tailored, sector-specific policy interventions rather than a uniform, one-size-fits-all approach. Policymakers and organisational leaders should prioritise interventions that address the structural and operational factors identified in this study, focusing particularly on governance systems, monitoring capabilities and journey management procedures.
First, the significant gaps in WRRS governance among manufacturing organisations suggest the need for clearer regulatory expectations and sector-specific guidelines. Unlike transportation and public service organisations, manufacturing firms often treat road travel as peripheral to their core operations, resulting in less formalised systems for monitoring road-crash risks. National agencies such as the Malaysian Institute of Road Safety Research (MIROS), a national road safety research institute; the Social Security Organization (SOCSO), a government agency responsible for employee social security protection; and the Department of Occupational Safety and Health Malaysia (DOSH), the authority responsible for occupational safety and health regulation and enforcement, could support the sector through the development of tailored WRRS frameworks. These frameworks may include mandatory reporting requirements, standardised journey management templates and minimum safety management benchmarks. Such targeted initiatives could help address the governance and monitoring weaknesses identified in the manufacturing sector while promoting more consistent WRRS implementation across organisations of different sizes.
Second, the stronger performance of public service agencies demonstrates the positive effect of structured safety governance, formal fleet oversight and centralised accountability. Lessons from this sector could be extended to other industries through cross-sectoral benchmarking and knowledge exchange programmes. Policies encouraging inter-agency collaboration, as demonstrated by initiatives such as Vision Zero Malaysia, the My Safe Road Programme and joint SOCSO–MIROS interventions, may help transfer best practices to sectors with weaker governance structures. Embedding public-sector safety standards into private-sector fleet management, particularly for SMEs, may further enhance consistency in WRRS implementation.
Third, the significant sectoral differences in journey management emphasise the need for more systematic approaches to planning and supervising work-related travel. Transportation companies, which demonstrated comparatively stronger performance, typically use structured scheduling systems, route-risk mapping and driver supervision. These operational practices are less pronounced in the manufacturing sector. National WRRS guidelines should therefore incorporate journey planning requirements that are scalable for different organisational capacities. Digital tools, such as fleet telematics, GPS-based risk mapping and automated journey logs, could support organisations in standardising trip planning and improving incident detection, especially for high-exposure sectors.
Fourth, although no significant differences were observed in driver and vehicle management across sectors, the uniformly moderate performance suggests a need for broader national guidance on competency assessment, vehicle maintenance documentation and safety-critical training. Policies mandating recurrent driver training, fatigue management education and periodic fleet inspections may help elevate WRRS standards across all industries. Employers should also be encouraged to adopt behaviour-based monitoring systems, as evidence indicates that continuous feedback improves compliance and reduces risky on-road behaviour.
Finally, the analysis shows that monitoring and assessment remain weak in multiple sectors, despite being central to improving WRRS outcomes. A national incident-reporting platform for work-related crashes on the road, integrated across SOCSO, MIROS and DOSH, would enhance transparency, enable benchmarking and allow organisations to identify recurrent hazards. Strengthening monitoring mechanisms helps shift WRRS from a reactive model to a proactive safety system, where near-miss data, journey deviations and fleet risk profiles guide operational decisions.
Collectively, these implications underscore the importance of strengthening organisational governance, building sector-specific WRRS capabilities and enhancing national regulatory mechanisms to support continuous safety improvement. Implementing these policy and practice recommendations will contribute to more resilient, data-driven WRRS systems and help reduce crash risk for work-related travel across Malaysia’s major industry sectors.
Conclusion
This study examined Work-Related Road Safety (WRRS) implementation across transportation, public services and manufacturing organisations in Malaysia, focusing on five key dimensions: management systems, monitoring and assessment, driver management, vehicle management and journey management. The analysis demonstrated that WRRS practices vary substantially across sectors, with statistically significant differences observed in four of the five WRRS elements. Manufacturing organisations consistently recorded weaker WRRS scores compared to the transportation and public services sectors, particularly in management systems, monitoring processes and journey management. Public service agencies, in contrast, performed more favourably in several dimensions, recognising the benefits of structured governance and regulatory oversight.
The results indicate that sector-specific operational demands and organisational structures strongly influence WRRS performance. Manufacturing firms, where road use is often secondary to production activities, show lower levels of systematic monitoring, governance and journey planning, highlighting areas where additional support and targeted interventions are needed. Transportation organisations showed comparatively stronger journey management practices, consistent with their high exposure to road-based activities. Meanwhile, the uniformly moderate performance in driver and vehicle management across sectors suggests the need for broader, system-wide improvements rather than sector-specific reforms in these areas.
Overall, the findings underscore the importance of strengthening WRRS governance, enhancing monitoring mechanisms and tailoring interventions to the operational realities of each sector. Improving WRRS in manufacturing organisations is particularly critical, given their consistently weaker performance across multiple indicators. Addressing these gaps will be essential for reducing work-related road risks and supporting safer organisational environments across Malaysia’s major industry sectors.
AI tools
The author acknowledges that ChatGPT 5.5 was used in the preparation of this paper to assist with English language expression and clarity.
Acknowledgements
The authors gratefully acknowledge the support provided by the colleagues and management of the Faculty of Civil Engineering, Universiti Teknologi MARA (UiTM) Shah Alam, Malaysia. Appreciation is also extended to the Social Security Organization (SOCSO) and Universiti Putra Malaysia (UPM) for their cooperation and contributions to this study.
Author contributions
Harun Bakar: Conceptualisation, Writing - Review & Editing. Rusdi Rusli: Formal analysis, Methodology & Writing - Original Draft. Mohd Razif Mahadi: Resources. Kamarizan Kidam: Writing - Review & Editing. Anita Abdul Rahman: Formal analysis & Methodology. Mohd Rafee Baharudin: Validation & Supervision.
Funding
The authors did not receive any financial support, funding, or grants for the research, authorship, or publication of this article.
Human Research Ethics Review
This study received approval from the Ethics Committee for Research Involving Human Subjects at Universiti Putra Malaysia under reference number JKEUPM-2021-690.
Data availability statement
The datasets generated and analysed during the current study are available from the corresponding author upon reasonable request. Access to the data may be subject to ethical and confidentiality considerations to protect the anonymity of participating organisations and respondents.
Conflicts of interest
The authors declare that there are no conflicts of interest regarding the publication of this manuscript. The authors confirm that no financial, commercial, or personal relationships could have influenced the work reported in this study. The research was conducted independently, and the findings and conclusions presented are solely the responsibility of the authors.