Glossary
Introduction
Accurate identification and prioritisation of high-risk road corridors is critical to maximising the benefits of road safety interventions. Historically, crash risk has been assessed using reactive approaches that rely on existing crash data and observed crash frequencies to identify and prioritise high-risk sites (FHWA, 2014). The key limitations of reactive approaches are well understood – they require accurate crash data and, because crashes are rare and random events, observed variation in crashes across locations may not accurately represent the underlying crash risk (Job, 2012). By contrast, proactive approaches to road safety aim to predict safety issues in advance of observed crashes, by using estimates of underlying crash risk based on infrastructure, traffic and operational characteristics.
Safety Performance Functions (SPFs) are standardised crash prediction models commonly used to proactively estimate crash risk (FHWA, 2013). SPFs exist for a range of road and intersection types and have been tailored to specific road contexts and predictive factors. Basic SPFs only consider two variables – traffic volume and segment length – and therefore cannot account for how other road characteristics affect crash risk. More complex SPFs have been developed based on detailed measurements of road properties (such as shoulder width and surface condition). In the United States of America (US), such detailed measurements are not consistently available at either the state or national level. This limits the usefulness of complex SPFs for network-wide safety analysis.
Extensive prior research has highlighted the increase in crash risk associated with curve characteristics such as radius, length and grade (Bauer & Harwood, 2013). Researchers have reported an association between curve crash risk and spatial factors, for example the presence or radii of adjacent curves in close proximity (Elvik, 2019) or isolated curves with long straight approaches (Donnell et al., 2019). Prior work has also explicitly estimated curve context – the degree to which a curve is unexpected given the surrounding road environment – using road geometry and expected operating speed modelling (Abeysekera et al., 2018).
Given the disparities in crash and road network data availability across the US, there is a need for proactive methods of estimating rural crash risk that do not rely on detailed data sources. Furthermore, to target safety treatments effectively and efficiently, it is necessary to prioritise potential treatment locations based on underlying crash risk.
This paper describes development of a safety prioritisation framework for rural highways in the United States of America, using curve geometry and context to determine curve crash risk. Datasets from two states, Arkansas and California, were used to develop the Safety Performance Function, which is then used to prioritise corridors for safety treatments. The corridor priorities are displayed using an interactive map-based tool.
Literature review
The literature research was guided by the authors’ knowledge of and involvement in curve-related crash risk. Based in New Zealand, the authors’ expert knowledge was extended through online searches to identify literature related to road curve geometry and curve content and curve-related crash risk, with particular emphasis on the concept of curve context and the role of speed differentials. The review started with foundational research from New Zealand that largely used simplified geometric and advisory speed assumptions suited to the rural highway context. New Zealand has an extensive rural highway network characterised by winding alignments, challenging terrain and high rates of loss-of-control crashes. As a result, some of the earlier research highlighting the safety effects of out-of-context curves was reported in analyses of the New Zealand state highway network. Subsequent advances were then examined, including operating speed models, curve context measures and their application to safety treatment prioritisation, before broadening to international studies that explicitly consider spatial geometry, adjacent road features and driver expectancy.
Cenek et al. (2011) developed a crash prediction model for rural curves with a radius less than 500 metres. Curve speeds were estimated using a geometry-based curve advisory speed formula. Approach speeds were estimated as the average curve speed over the preceding 500 metres of road where there are preceding curves, otherwise a nominal value was used. Despite the use of an approximate approach speed, the difference between approach and curve negotiation speeds was a significant predictor of crash risk on the New Zealand rural highway network, capturing the effect of out-of-context curves. The use of more detailed operating speed models would be expected to improve estimates of curve context and hence crash prediction performance.
The examination by Cenek et al. (2011) of the speed reduction required between approach and curve negotiation was informed by Koorey and Tate (1997) who estimated univariate models of the impact of absolute and percentage reduction in speeds on crash rates. The required speed reduction when traversing a curve explained a large share of variation in curve crash rates. The estimated speeds for this work were also based on geometric advisory speed formulas and simplistic assumptions about speeds on straight road segments.
The New Zealand Transport Agency Crash Estimation Compendium (NZTA, 2018) is the primary crash prediction manual used for nationally-funded transportation projects in New Zealand. The current edition of the compendium provides a crash prediction model for isolated rural curves which uses the percentage reduction between approach (estimated 85th percentile speed) and curve speeds as a key predictor. There is no equivalent consideration of curve context in the crash prediction models presented in the US Highway Safety Manual, which provides similar guidance for project evaluations in the US.
Detailed operating speed models have also been employed to more accurately estimate prevailing operating speeds and, consequently, curve context. Abeysekera et al. (2018) estimated whether a curve is out of context with the surrounding road environment and therefore expected to produce higher crash risk. An operating speed model is used to infer typical vehicle speeds on a subset of the New Zealand rural road network. Curves are considered “out-of-context” if drivers’ likely operating speeds exceed the published design speeds based on curve radius. Abeysekera et al. reported that out-of-context curves have significantly higher crash rates than in-context curves. Additionally, corridors are prioritised according to risk using a combined metric of crashes per out-of-context curve and overall curve crash rate. While this work introduces novel operating speed modelling of arbitrary road geometries to the crash prediction literature, the prioritisation of corridors based on observed crashes is a reactive approach, sensitive to random variation in crash frequency, particularly on corridors with few observed crashes.
Curve context information has also been used in New Zealand to inform prioritisation of safety treatments. Brodie (2016) used a univariate curve risk classification based on the difference between estimated approach and curve advisory speeds to categorise curves for skid resistance investigation and treatment. These risk categories show strong correlation with curve crash rates.
Recently, the safety impacts of curve context and spatial road geometry generally are an increasing focus of crash analyses in the US and other countries. A Federal Highway Administration study by Donnell et al. (2019) modelled curve crashes in Washington State and Utah, including consideration of curve and tangent road sections upstream and downstream of the curve of interest. Sharper upstream and downstream curves were reported to reduce crash risk on the curve of interest, likely due to lower prevailing speeds. Longer tangent (straight) sections adjacent to the curve increased crash risk, likely because drivers are less likely to expect isolated curves after long straight road sections.
Elvik (2019) summarised existing research on the impact on curve crash risk of adjacent curve locations and characteristics. Curves with sharper neighbouring curves had lower crash risk and this finding supports an interpretation that corridors containing many sharp curves in proximity may be safer than corridors with a small number of curves spaced further apart. However, this analysis is a purely statistical approach that does not explicitly consider likely operating speeds of vehicles based on road and curve geometry.
Afghari et al. (2023) apply an econometric model of crashes including a latent “predictability” variable to capture driver anticipation of curves to explicitly quantify crash risk from unexpected or out-of-context curves. The model was estimated for 156 curves in the Netherlands with available driver behaviour data. This novel approach provides insights into empirical factors affecting curve context, but requires detailed driver behaviour data, making it unsuitable for network-wide analysis.
While the crash risk of isolated curves has been studied at some length, approaches to date have typically used simplified geometric models. Prior work has developed more detailed methods using operating speed models to assess desired and likely curve speeds, but the prioritisation of rural corridors based on predicted risk is still largely reliant on reactive analysis, making it subject to statistical variation in crash data.
There is a need for proactive approaches to curve risk analysis in rural contexts, that allow models to be developed and applied to areas with potentially missing or incomplete crash data. The aim of this project was to address this gap.
Method
In this pilot project, road network, traffic and crash data from California and Arkansas were used to develop a predictive model of curve crash risk. These two states were selected due to having publicly available crash datasets. The road network was then processed to identify curves, estimate operating speeds and classify each curve according to how well it matched drivers’ speed expectations. The following sections describe the data sources, processing steps and derivation of curve context measures used in the analysis.
Dataset and curve context estimation
Data sources and exclusions
Road network and crash datasets from California and Arkansas were used to develop and evaluate the predictive model. Fitting crash prediction models at a network level captures the association of key variables of interest with crash rates, and reduces the influence of individual sites with outlier crash rates. Road network data were sourced from HERE map data (HERE, n.d.-a). Included in the dataset were road centrelines with HERE Functional Class (“road class”) 1-4, which correspond to connected roads forming a comprehensive network for navigation of both long- and short-distance routes (HERE, n.d.-b). Excluded were divided highways, unsealed roads and roads with speed limits below 40 mph. These exclusions were to restrict the dataset to infrastructure and speed environments typical of rural highways.
Crash data were sourced from publicly-available datasets: the Arkansas Crash Analysis Tool (Arkansas Department of Transportation, 2025) and the Transportation Injury Mapping System from the University of California, Berkeley (UC Berkeley, 2025). At the time of retrieval (2024), the Arkansas Crash Analysis Tool provided access to crashes from 2018 onwards, however the current version of the tool only includes crashes from 2020. Datasets were aligned to include all reported injury crashes (fatal, serious and minor severities) from 2018-2022 (five years). Crashes were assigned to the nearest road segment within a 50-metre radius. Available crash data do not distinguish between direction of travel so all subsequent analyses consider crashes in both directions together. Crashes coded as “intersection related” were excluded to focus the analysis on crash risk related to curve geometry.
Estimated traffic volume for each road segment (annual average daily traffic, AADT) was taken from the Highway Performance Management System (HPMS) (FHWA, n.d.). This data is complete for major roads, but not available for some minor routes across the road centreline datasets. The dataset includes every road centreline with HERE Functional Class 1-4, which includes some roads that are not covered by HPMS.
In total, the dataset had AADT data covering 91 percent of the road network length. For roads without AADT data in HPMS, missing values were first imputed using a local average of traffic volumes for up to 10 nearby road segments with the same functional class and lane count, inversely weighted by the distance to the road segment being estimated. Then, any road segment with a derived AADT value was set to be the minimum of all AADT values (derived or observed) within its corridor. This assumes that state reporting of AADT favours higher volume roads, so roads without reported volumes are unlikely to have more traffic than any of their connecting roads.
Curve segmentation and context estimation
Curves in the road dataset were identified and classified by context according to the method outlined by Abley Ltd (2023) and broadly similar to that of Abeysekera et al. (2018).
These methods estimate curve operating speeds and assess these against design limit criteria to determine curve context. First, the centreline dataset was segmented into curved and straight sections using a sliding window approach. A segment was classified as a curve when the radius is less than 1000 metres and the curve deflection was larger than 9 degrees. Where radius varied along a curve (due to spiral or compound curve geometries), the minimum measured radius was assigned to the curve. An alternative average radius measure was also explored in the modelling discussed below but did not significantly change predictive performance.
Second, an Austroads speed model was applied to estimate directional desired and actual operating speeds for each road segment based on prevailing speed limit, adjacent road geometry and alignment type. This speed model is based on empirical data on vehicle acceleration and desired operating speeds sourced from international literature (Austroads, 2009). It includes a desired tangent speed for drivers, based on terrain and roadside environment and maximum acceleration/deceleration rates which are applied sequentially along road elements to estimate a speed profile.
Third, estimated curve approach speeds were compared to safe curve negotiation speeds according to Austroads design limits (Austroads, 2009) and curves were categorised as Class 1 (highly out of context), Class 2 (out of context), or Class 3 (within context).
Road segments were combined into corridors by joining adjacent road segments that shared the same road class and speed limit. Corridors were terminated at junctions if there were intersecting roads of an equal or higher road class.
Final dataset
Table 1 shows a summary of the datasets used, after exclusions and refinements. The California dataset had lower traffic volume data coverage and a greater reliance on imputed traffic volume estimates. There is also a lower estimated crash rate in California – this is likely due to different road and traffic environments, although the greater use of imputed traffic volumes may also affect the estimated crash rates. The dataset includes traffic volume data covering 91 percent of the network by length and 96 percent of reported injury crash locations.
Crash prediction modelling
The basis of proactive methods for risk assessment is the estimation of underlying network crash risk. In this work a statistical model was used to predict curve injury crashes at the road segment level, which was aggregated to estimate total crashes on a corridor.
For model fitting and validation, the combined dataset was split into training, test and validation sets containing approximately 60 percent, 20 percent and 20 percent of corridors, respectively. Variables identified to have robust predictive power in the training dataset were included in the model, with the test dataset used for interim testing and the validation dataset used to assess the final model fit.
Model form and key variables
The model of curve injury crashes uses the following form:
\[\begin{array}{r} C\text{=}e^{\beta_{0}}Q^{\beta_{Q}}L^{\beta_{L}}Y^{\beta_{Y}}e^{x^{T}\beta} \end{array}\tag{1}\]
Where is the number of reported injury crashes on a curve per five-year period, is the segment bidirectional traffic volume (annual average daily traffic), is the curve length in metres, is the curve intensity index (defined below), are model coefficients corresponding to the base crash rate and other explanatory variables, is a vector of curve context indicator variables (described below) and is a vector of coefficients corresponding to the variables in
Errors are assumed to follow a negative binomial distribution (generalised linear model with a log link), with variance of the form:
\[\begin{array}{r} \sigma^{2}\text{=}\mu\text{+}\alpha\mu^{2} \end{array}\tag{2}\]
Where is the mean and is the dispersion parameter, where the outcome variable is overdispersed if
Additional variables
Other variables used in the model are described in the following sections. Variables were chosen for inclusion based on model parsimony and predictive performance on the training dataset.
Curve context
To provide more granularity on curves with differing curve context by direction, the number of travel directions from which the curve has Class 1 or Class 2 context were used as explanatory variables. Intuitively, a curve that is out of context from both directions of travel was expected to have higher crash risk than a curve out of context in only one direction.
As these Class 1 and 2 curve context variables are not independent (because curve context categories are mutually exclusive), indicator variables were included in the model for every combination of contexts. These variables take a value of one when a curve has Class 1 context in directions of travel and Class 2 context in directions of travel and zero otherwise. In the model form the indicator variables are included as exponential terms in the vector
Curve intensity
The model includes a derived variable, curve intensity, defined as:
\[\begin{array}{r} Y\text{=}\left| \frac{\theta}{r} \right| \end{array}\tag{3}\]
Where is the curve intensity index, is the curve deflection angle in degrees and is the curve radius in metres.
Curve intensity is equivalent to the interaction of curve deflection and curvature and intuitively encodes the idea that sharper curves (higher curvature) with larger curve angles (higher deflection) combine to create higher risk. This additional risk is over and above that predicted by the curve context, which does not consider the curve angle. The curve intensity index is included as a multiplicative factor in the model. Separating curvature and curve deflection in the model did not improve predictive performance.
Unused variables
Other available variables, including terrain category, road class, alignment category, county population and population density, did not show significant predictive power in this dataset so were not included in the model. Speed limit showed some predictive power but is highly correlated with curve context so was excluded, particularly given the focus of this work on rural roads with typically higher and largely uniform speed limits.
Corridor prioritisation
Road safety treatments can be prioritised based on estimates of the underlying crash risk for road segments. The focus of this work was to assist in prioritising safety treatments to reduce out-of-context curve risk. Implementing treatments at the corridor level is preferable as it promotes a more consistent driver experience and reduces the potential for crashes to migrate to adjacent locations.
We prioritised corridors according to the total predicted out-of-context curve crashes per unit length of corridor. This metric represented the aggregate risk associated with out-of-context curves, such that corridors with a greater number of out-of-context curves, and higher modelled risk on those curves, were given higher priority. Normalising by corridor length recognised that the costs of implementing road safety treatments, including implementation costs and travel time impacts, were likely to increase with corridor length. The metric therefore identified corridors where treatments targeting out-of-context curves were expected to achieve the greatest absolute reduction in crashes. Conceptually, it represented the expected collective risk attributable to out-of-context curves along the corridor.
A similar prioritisation technique proposed by Abeysekera et al. (2018) used observed crash data to estimate two metrics: collective risk and personal risk (crashes normalised by traffic volume). The rationale for estimating personal risk was that higher values may indicate greater potential for reducing crash rates through safety treatments. In the present work, curve-level observed crash data is not directly used to prioritise treatment, and curve characteristics expected to increase crash risk are already incorporated into total crash predictions. Consequently, estimating personal risk separately was not considered necessary. The use of a predictive model also reduced the potential influence of outlier crash counts on corridor prioritisation.
In this work, priority band threshold categories were set to target proportion of network length: high (10%), medium-high (15%), medium (20%), medium-low (20%) and low (35%).
Results
Impact of curve context on crash rate
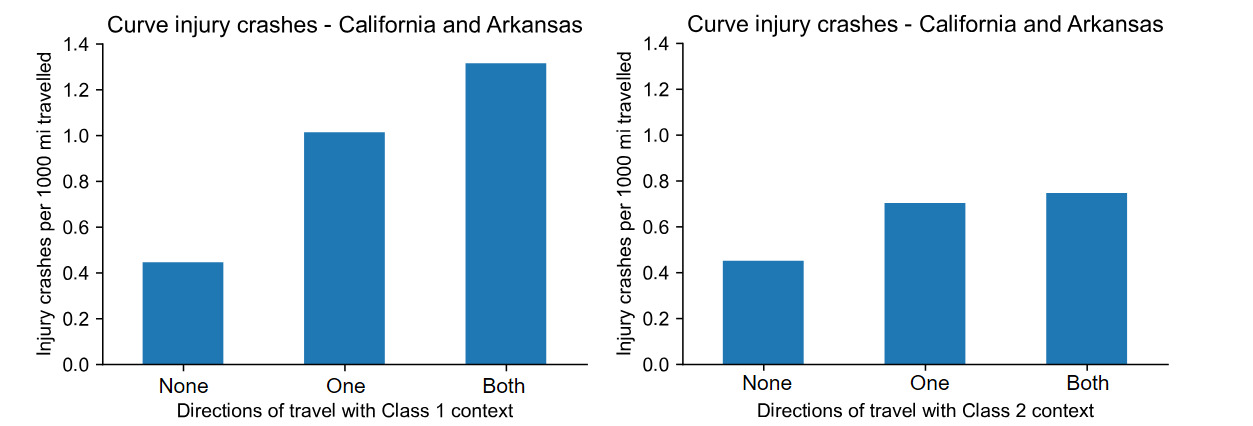
Curve context can differ by travel direction due to different approach geometries and adjacent road environments. Figure 1 shows average crash rates for Class 1 (highly out of context) or Class 2 (out of context) curves, by how many directions of travel exhibit that curve context class.
_and_class_2_(out_.png)
Curves where both directions of travel are out of context tend to have higher crash rates, particularly for Class 1 curves. This indicates that curves which are misaligned with the surrounding road environment in both directions of travel or are very misaligned, carry a higher crash risk.
Model coefficients
Variables used in the model and preferred model coefficients from fitting the model to the training dataset are shown in Table 2. All variable coefficients in the model fitted to the training set are statistically significant at the 5 percent level.
Table 2 also includes approximate interpretation of the model parameters. Coefficients which are exponents can be interpreted as elasticities, where the coefficient indicates the expected percentage change in crash risk if the variable value increases by 100 percent, all else equal. For indicator variable coefficients, the proportional change associated with the indicator is the exponential of the coefficient.
Hauer (2024) describes how interpretation of individual regression coefficients may be difficult where structural linkages exist between explanatory variables. In this model, curve length is geometrically linked to radius and deflection angle, which are also used in calculating curve intensity and curve context. Therefore, it was difficult to isolate the effect of curve length, radius, deflection, or curve context on crash risk, as varying one of these parameters will change the others. However, while this complicates interpretation of model parameters, the predictive validity of the model is not impacted.
The lower part of Table 2 shows the results of fitting models of increasing complexity to the combined dataset. The results show that inclusion of curve context and curve intensity variables provides significant additional predictive power over models using only traffic volume and segment length, as evidenced by the smaller mean absolute deviation (MAD) and Akaike information criteria (AIC).
While the pseudo-R2 value for categorical models cannot be interpreted directly as the proportion of variance explained by the model, the preferred model has both a low pseudo-R2 value and only moderate correlation between predicted and actual crashes at the segment level. This is consistent with the rare nature of crash events, particularly at the segment level and limited covariates in the dataset. Aggregating predictions at the corridor level is more illustrative of the accuracy of underlying crash risk predictions.
Corridor-level validation
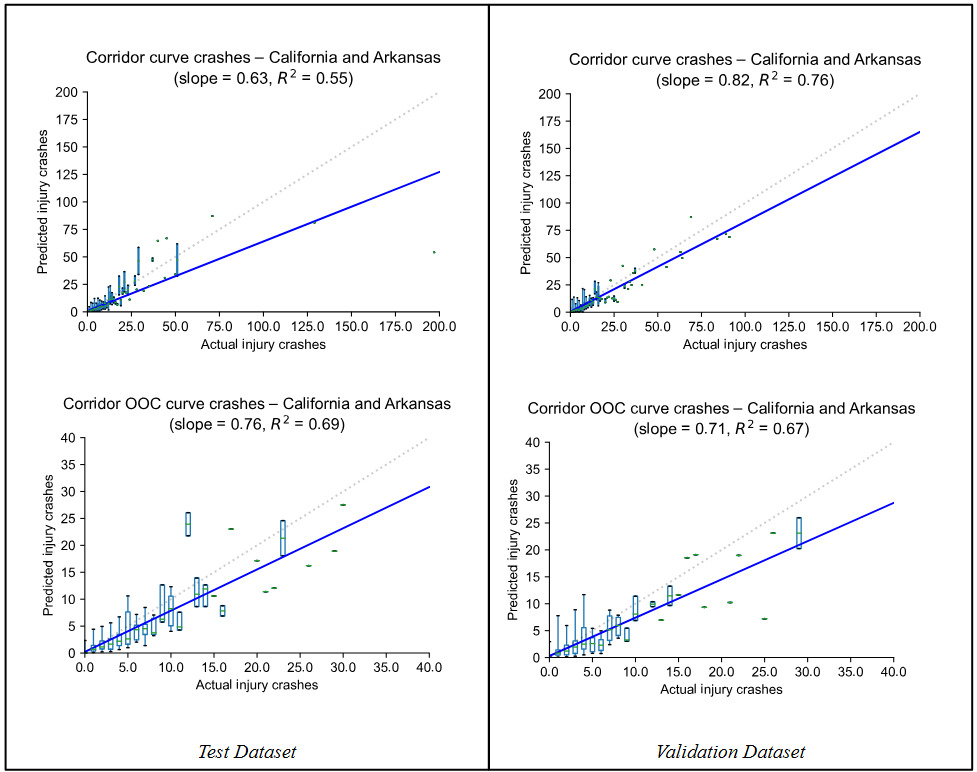
The segment-level model fitted to the training dataset was used to predict total curve crashes on corridors in the independent test and validation datasets. Figure 2 shows the predicted and actual crash totals for corridors in these datasets. Results are presented for all curve crashes and for crashes on out-of-context curves only. At this level of aggregation, random variation in crashes at the segment level had less influence and there was higher agreement between predicted and actual crashes. In both the test and validation datasets, the model predicted a large share of the variation in out-of-context curve crashes.
_curves__f.png)
Corridor prioritisation
Table 3 shows the priority band thresholds used to achieve the approximate target network length within each band, based on crash risk predicted on the full sample of California and Arkansas corridors. Consistent with the empirical road safety literature, the distribution of corridor risk has positive skew (a long right tail). Corridors in the “high” risk band on average have a predicted out-of-context curve crash density more than twice that of “medium-high” risk and approximately 60 times higher than “low” risk corridors. The highest-risk 10 percent of corridors by network length carry over 40 percent of the predicted out-of-context curve crash risk.
Arkansas case study
The method presented in this paper was implemented in the Abley SafeCurves software (Abley Ltd, 2024) to prioritise rural corridors for safety treatments and to display those priorities in an interactive web-based map, in addition to presenting individual curve context and recommended curve interventions, including alignment signs and advisory speeds.
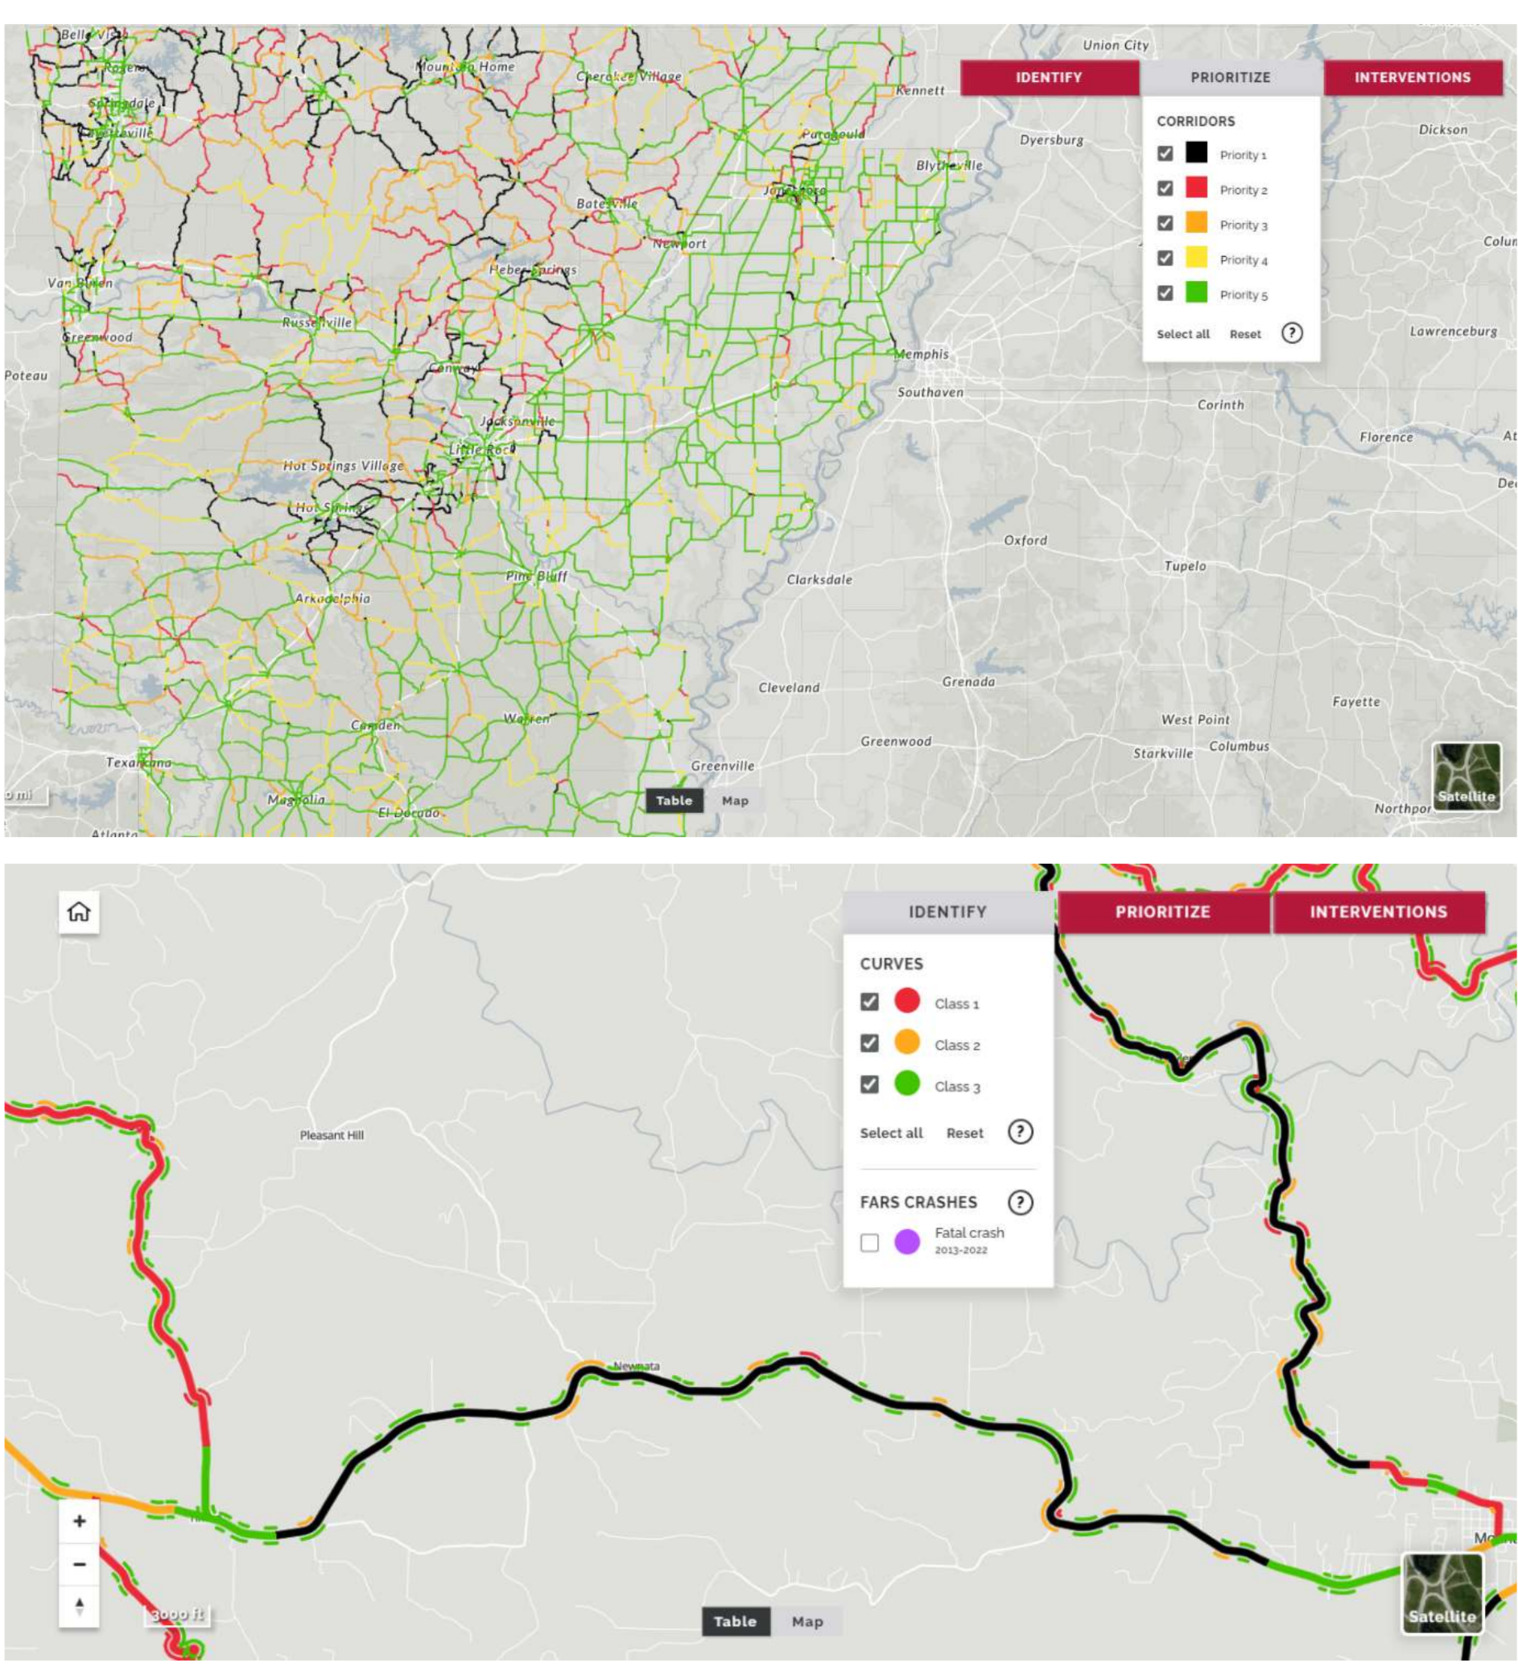
Corridor priorities for the state of Arkansas are shown in Figure 3 with five risk bands from high risk “Priority 1” (black) to low risk “Priority 5” (green). This network-level analysis highlights the disparate predicted curve risk between different regions in the state. Corridors in rural regions with flat terrain tend to fall into lower priority bands compared to those in mountainous or more populated parts of the state.
_and_curve_context_detail_on_sr_66_near_moun.png)
Figure 3 also shows corridor priority and curve context detail for an example rural area in Arkansas. Curve context is shown by direction of travel for Class 1 (red) and Class 2 (yellow) curves. The main rural highways in the region shown include a number of Class 1 (highly out of context) and Class 2 (out of context) curves, which contribute to the high priority bands of these corridors.
Discussion
The findings of this research accord with estimates in the literature of the effect of curve context on safety performance. While prior studies demonstrated that horizontal curve crash risk is influenced by geometric characteristics and spatial context (Bauer & Harwood, 2013; Donnell et al., 2019; Elvik, 2019), this work advances that evidence base by incorporating an explicit operating speed model to quantify how “unexpected” a curve is relative to its approach environment (Abeysekera et al., 2018). The results from Arkansas and California show that curve context remains a strong predictor of injury crash risk even when controlling for exposure (traffic volume) and curve extent, supporting the broader interpretation that driver expectancy and speed adaptation are key mechanisms underpinning curve-related loss-of-control outcomes.
This research also extends prior work by translating curve-level risk estimation into a corridor-level prioritisation framework suitable for programmatic safety delivery. In contrast to approaches that rank individual curves or rely on observed crash totals to determine corridor priorities (Abeysekera et al., 2018; Brodie, 2016), the proposed method aggregates predicted crash risk to identify corridors where out-of-context curves contribute disproportionately to risk. This enables proactive targeting of safety treatments in a way that is less sensitive to the statistical noise inherent in sparse crash histories (Job, 2012) and is better aligned with the goal of maximising risk reduction per unit of treatment effort.
More broadly, the proposed method sits between two established paradigms in road safety management: 1) traditional reactive “black spot” identification based on crash history and, 2) safety performance function (SPF)-based predictive methods that estimate expected crash frequency from traffic exposure and roadway features (FHWA, 2013). The former remains common in practice because it is straightforward to implement where crash data are available, but it is known to be vulnerable to regression-to-the-mean effects and random variation, particularly on low-volume rural roads (Job, 2012). Predictive methods reduce these issues by modelling underlying risk, but are often constrained by the availability of consistent, network-wide geometric and roadside variables. This research identifies a pragmatic middle ground: it retains the SPF logic while focusing on variables that can be derived at scale from widely available centreline geometry and speed limit datasets.
A key insight added by this study is that direction-specific curve context can be incorporated into an SPF in a parsimonious way without requiring direct observations of operating speeds. Earlier New Zealand applications commonly represented the “surprise” element as a speed reduction between an approach speed proxy and a curve negotiation/advisory speed (Cenek et al., 2011; Koorey & Tate, 1997; NZTA, 2018). While effective, these approaches use simplified assumptions for approach speeds. Here, the curve context classification is derived from an explicit operating speed model and then encoded in the regression as combinations of Class 1 and Class 2 context by travel direction. This preserves interpretability (more directions out-of-context indicates higher risk) while also allowing the model to generalise across heterogeneous corridor environments where approach speeds are shaped by upstream and downstream alignment.
This work also demonstrates the transferability of curve-context risk modelling to the US rural highway context using two diverse state datasets. Prior US curve studies often focus on specific corridors or states and use detailed, locally curated inventories (e.g., curvature, grade combinations, roadside elements) to estimate safety effects (Bauer & Harwood, 2013; Donnell et al., 2019). It can be difficult to obtain consistent variables for large-scale screening across jurisdictions, limiting the practical adoption of data-rich models. By relying on centreline geometry, speed limits and traffic volumes where available, the proposed model can be applied across wider areas with fewer data requirements. This matters for national-scale or multi-state programs where the need for consistency frequently forces analysts toward simpler exposure-only SPFs (FHWA, 2013) that do not explicitly represent driver expectancy or curve “surprise”.
The corridor prioritisation metric introduced in this paper also links modelled curve context risk to an implementation-relevant unit of analysis. Much of the curve context literature is framed at the individual curve level (e.g., identifying high-risk curves or estimating marginal effects of geometry), however, rural safety programmes are frequently delivered as corridor packages (e.g., signing, delineation and speed management across a route). Corridor level implementation achieves consistency and reduces the likelihood that localised improvements will shift crash risk to adjacent untreated locations. By prioritising corridors by predicted risk per unit length, this study bridges the gap between curve-level risk mechanisms and corridor-level investment decisions, extending the corridor screening concepts previously proposed using observed crashes (Abeysekera et al., 2018) into a fully predictive, crash-data-independent workflow.
Our preferred model also harmonises findings in the literature regarding curve geometry and road environment. Elvik (2019) reported evidence that the presence of more (and sharper) neighbouring curves can be associated with lower crash risk on a given curve, while Donnell et al. (2019) identified that longer adjacent tangents can increase risk. These results are consistent when viewed from a curve context perspective: corridors with frequent curvature tend to reduce prevailing speeds and increase driver anticipation, making individual curves more “in context” even if they are geometrically sharp. Conversely, isolated curves following long, higher-speed tangents are more likely to require larger speed adjustments and therefore present greater surprise. In this study, that expectancy effect is captured explicitly via the curve context class and its significance in the SPF suggests that context is an effective summary variable for a broader set of upstream/downstream geometric influences.
Model fit and predictive performance
In predictive modelling there is a trade-off between accuracy on the training dataset and the external validity of the model (Hastie, 2009). A highly predictive model is likely to be a result of overfitting available crash data as the expected random variation in road crashes is very high, particularly for low-frequency outcomes such as injury crashes on individual rural segments (Job, 2012). As a result, segments may have predicted crashes higher or lower than observed crashes due to random variation, even when the underlying crash risk is accurately estimated. For this reason, predictive model performance is often more meaningfully assessed at aggregated units such as corridors, where such variation tends to average out and at a scale where interventions are often delivered. Aggregating therefore reduces the impact of random variation and provide a clearer indication of whether the model captures underlying risk patterns rather than idiosyncratic crash histories.
Crashes predicted by the fitted model at the segment level have a moderate correlation with observed crashes, which is consistent with the known limitations of segment-level crash prediction when only a small number of covariates are available and the outcome is rare. At the corridor level, predicted total crashes are highly correlated with observed crashes, explaining approximately 60–80 percent of the variation in overall curve crashes and 70–75 percent of the variation in crashes at out-of-context curves. This pattern reinforces the intended use case of the model: not to replicate the exact spatial distribution of historical crashes, but to support network screening and prioritisation by estimating underlying risk in a way that is robust to random fluctuation in short time windows.
Compared with reactive ranking based on observed crash counts, the corridor-level validation provides evidence that the framework can identify high-risk corridors even when the observed crash record is sparse or volatile. This is particularly relevant for rural networks where treatment decisions are often required despite limited crash history and where reliance on observed crashes alone can lead to fluctuating prioritisation from one evaluation period to the next.
The use of a limited set of explanatory variables also reduces the risk of overfitting to the available data. Lower AIC and BIC values indicate that the addition of curve context and intensity variables improves the overall model fit even when accounting for higher model complexity.
Traffic volume data
Missing traffic volume is more prevalent on lower-volume routes which may systematically bias crash risk estimates. The HPMS traffic volume estimates are provided by states and may reflect inconsistent collection and reporting procedures. For example, the California dataset is larger than Arkansas and has a higher proportion of missing volume data, which reduces the overall explanatory power of traffic volume as a model variable. The use of more consistent traffic volume dataset would likely improve the explanatory power of the model.
Confounding variables
A confounding variable in predicting crashes is that locations with a high number of historical crashes (even if a statistical anomaly) tend to receive a higher level of road safety intervention than locations with fewer or no recorded crashes.
The dataset does not contain any variables relating to road safety treatments or other road improvements, aside from road geometry. As the available crash data spans a five-year period, it is possible that unobserved treatments during that time may have influenced crash risk which are not explained by any variables in the model. The presence of treatments targeting high-crash locations or out-of-context curves will tend to result in underestimation of the effect of curve context on crash risk.
Implications for corridor treatment strategies
The prioritisation metric isolates predicted injury crash risk attributable to out-of-context curves so it can be used to support a staged investment strategy. For example, high-priority corridors may warrant road safety treatment packages that combine speed management and enhanced delineation (e.g., advisory speeds, chevrons, delineators and related measures) delivered consistently across the route, whereas medium-priority corridors may be suitable for lower-cost systemic treatments applied to the subset of curves with the poorest context. Note that as the crash prediction model does not include variables for many of these treatment strategies, the model itself is not directly able to predict the impacts of particular countermeasures nor assist in the selection of a specific countermeasure. The crash prediction model is most useful as high-level prioritisation tool.
Appropriate corridor prioritisation for safety treatment will also be influenced by the existing level of corridor treatment, which is not observed in this prioritisation approach (aside from geometric changes, as discussed above). More complete data on safety treatments would enable future modelling to incorporate this factor and improve the practical usefulness of corridor prioritisation. The current corridor prioritisation approach requires considered engineering judgement when determining safety treatment programming.
The map-based implementation in SafeCurves illustrates how predictive corridor screening can be operationalised for practitioners: it provides a transparent link between observed alignment, estimated operating speeds, curve context class and the resulting corridor priority. Such a tool allows practitioners to validate priorities against their local knowledge and to identify whether a corridor’s ranking is driven by a small number of highly out-of-context curves or by a broader pattern of moderate context issues. In this way, the tool supports both strategic program development (selecting corridors) and tactical design review (selecting countermeasure types at specific curves).
Limitations and future research
Several limitations point to opportunities for further work. Although the operating speed model provides a scalable way to estimate expectancy effects, the model remains an approximation and may not fully capture local driver behaviour, enforcement and vehicle mix. Where observed speed data are available (e.g., probe speeds), future studies could evaluate whether replacing modelled operating speeds with measured speeds improves the classification of curve context and the predictive power of the resulting SPF and whether the gains justify the added data requirements.
Traffic volume remains a critical exposure variable, but network-wide AADT coverage and quality varies by state and road class. As discussed above, improved and more consistent volume estimates would likely improve model performance, particularly on lower-volume facilities where data gaps are more common. Additionally, the absence of variables describing existing treatments (e.g., signing, delineation, friction, shoulder improvements) limits causal interpretation of coefficients. As noted in the confounding discussion, prior interventions may suppress observed crash counts at historically problematic curves, leading to conservative estimates of the effect of curve context on crash risk. Future research could incorporate treatment inventories or proxy variables (e.g., signage) to better account for these effects.
Finally, there is scope to test the portability of the model to additional states and to other outcome definitions (e.g., fatal and serious injury only, or roadway departure crashes) to better align with program objectives. An important extension would be to integrate the curve-context SPF with established predictive/network screening workflows, including empirical Bayes approaches where crash data exist, so that curve context can inform both purely predictive screening and combined observed-and-expected prioritisation. Such integration would clarify how curve context adds value relative to exposure-only SPFs and would provide a pathway for incorporating expectancy metrics into mainstream safety management practice.
Conclusions
The impact of curve context on safety outcomes is well established. Existing approaches to estimate crash risk due to curve context have typically used simplified geometric models or otherwise incomplete consideration of the adjacent road environment. Additionally, there has been limited application of curve context to the development of safety performance functions, particularly in rural environments in the US. We have presented a novel use of curve context information, derived from widely available road centreline data, to predict crash risk on the California and Arkansas rural road networks. Models estimated using injury crash data indicate that curve context and other geometric characteristics show significant additional explanatory power beyond models based only on traffic volume and segment length.
Predicted crash risk was used to construct a metric of out-of-context curve crash risk per unit of corridor length, which is used to prioritise corridors for cost-effective treatment. This metric focuses on crash risk on out-of-context curves, as this is where there is high potential for countermeasures to improve safety outcomes. Prioritising corridors with this metric also highlights the concentration of risk: the highest-priority quarter of network length holds over two-thirds of the total out-of-context curve crash risk, with the remaining network (75%) accounting for less than a third of the total risk. Further, the Arkansas network case study applies the proposed approach using an interactive map-based tool to visualise corridor prioritisation and curve context information. The tool provides a visual overview of the extent and relative distribution of crash risk across the state.
This paper has shown that curve context and curve geometry provide useful additional information when determining crash risk on rural roads. Using predicted crash risk to prioritise road corridors for safety treatment reduces the influence of random variation in crash frequency while still identifying corridors where disproportionate crash risk exists. Treatments to improve out-of-context curves on these high priority routes are expected to generate the largest safety benefits per unit of corridor length and hence form an efficient and effective approach to reducing death and serious injury on rural roads.
AI tools
Microsoft Copilot was used in initial drafting of extensions to the discussion and literature review sections after review feedback. All text has been manually reviewed or edited and references checked.
Author contributions
Study conception and design: C. Tredinnick, J. Corbett-Davies, S. Turner, P. Durdin, S. Abley; data collection: C. Tredinnick; analysis and interpretation of results: C. Tredinnick, J. Corbett-Davies, S. Turner, P. Durdin; draft manuscript preparation: J. Corbett-Davies. Final manuscript correction; J. Corbett-Davies.
Funding
The authors did not receive any financial support, funding, or grants for the research, authorship, or publication of this article.
Human Research Ethics Review
All crash data used was from publicly available sources and used in accordance with published terms of use.
Data availability statement
Crash data is available from referenced sources. Centreline and network data is not able to be reproduced here due to terms of use limitations.
Conflicts of interest
The authors declare that there are no conflicts of interest.