Introduction
Serious crashes on the road network are a global public health crisis that cause approximately 1.19 million fatalities and up to 50 million injuries annually (WHO, 2026). As the leading cause of death for children and young adults aged 5-29 years, it imposes an immense social and economic burden worldwide (WHO, 2026). Mitigating this burden requires a shift from reactive measures to proactive, data-driven strategies, and predictive analytics plays a pivotal role.
The analysis of the severity of crashes on the road network has evolved from traditional statistical models to machine learning (ML) algorithms, which can capture the complex, non-linear interactions inherent in crash data. Moreover, supervised learning models, particularly ensemble methods like Random Forest and Gradient Boosting, have demonstrated superior predictive performance (Jeong et al., 2018; Rehman et al., 2025). However, a fundamental challenge persists: these models are often developed on balanced datasets while real-world crash data are severely imbalanced.
Fatal and severe injury crashes are statistically rare compared to minor and property-damage-only crashes. This imbalance biases classifiers towards the majority class, yielding models with high overall accuracy but critically poor sensitivity in predicting the severe outcomes that matter most for saving lives. While data-level solutions like the Synthetic Minority Over-sampling Technique (SMOTE) and Random Oversampling (ROS) have been proposed to address this issue, their efficacy is inconsistent and highly context-dependent (Sakib et al., 2024).
This methodological challenge is particularly prevalent in the context of urban bus transit systems in low- and middle-income countries (LMICs). Although buses are involved in a small proportion of crashes, their high passenger occupancy means collisions often result in disproportionately large casualties (Barua & Tay, 2010; Chimba et al., 2010). In megacities like Dhaka City, Bangladesh, this risk is exacerbated by a confluence of factors, including profit-driven operator behaviour, chronic congestion, deficient infrastructure, and lack of regulatory enforcement.
However, a critical review of the literature reveals a significant gap. Existing studies on crash severity in Dhaka City and similar contexts predominantly utilise data from before 2015 (Hasanat-E-Rabbi et al., 2022; Zafri et al., 2020), failing to capture the impacts of recent rapid urbanisation and policy changes. Further, a few studies applied ML to crash prediction in Bangladesh (Bhuiyan et al., 2022; Sakib et al., 2024). However, these studies often rely on outdated data, lack a dedicated focus on high-consequence bus crashes, and do not perform a systematic, integrated comparison of advanced ensemble learning with robust hyperparameter optimisation to address severity-class imbalance.
To address these gaps, this study develops and evaluates an optimised machine learning framework for predicting injury severity in urban bus crashes in Dhaka City, Bangladesh, using a recent dataset (2015-2022). Our research makes three primary contributions: (i) provides a rigorous comparative analysis of state-of-the-art ensemble models (Random Forest, Gradient Boosting, XGBoost) against baseline classifiers for bus crash severity prediction; (ii) systematically evaluates the synergistic impact of combining multiple resampling techniques (SMOTE, ROS) with hyperparameter optimisation (GridSearchCV) to counteract severe class imbalance, and; (iii) identifies and ranks context-specific critical factors influencing bus crash severity in Dhaka City using permutation feature importance, offering evidence-based insights for targeted policy interventions.
Literature review
Machine Learning applications in crash severity prediction
Over the last decade, the prediction of traffic crash severity has advanced from traditional statistical models (e.g., ordered probit and logit models) to more sophisticated machine learning (ML) algorithms capable of modelling complex, non-linear relationships. Among these, ensemble learning techniques including bagging (e.g., Random Forest), boosting (e.g., Gradient Boosting, XGBoost), and stacking have emerged as superior performers, consistently outperforming classical approaches like Logistic Regression in terms of accuracy and robustness (Bhuiyan et al., 2022; Labib et al., 2019; Lin et al., 2020; Mondal et al., 2020). Their ability to handle high-dimensional data and rank feature importance makes them particularly valuable for analysing traffic safety.
A central challenge in this domain is the inherent class imbalance in crash datasets, where fatal and severe injuries are rare. This imbalance biases models towards the most frequent crash type or majority class (e.g., property damage-only or minor injuries). To mitigate this discrepancy, data-level solutions such as Synthetic Minority Oversampling Technique (SMOTE) and Random Oversampling (ROS) have been widely adopted. Studies by Jeong et al. (2018) and Yahaya et al. (2020) demonstrated significant gains in predicting severe crashes using these techniques. However, there is a lack of consensus in the literature between employing multiple methods (Islam & Burton, 2020) or testing a wider array, but often in isolation from a robust hyperparameter optimisation framework (Sakib et al., 2024).
Recently, research has begun to shift from purely predictive modelling to risk-informed and prevention-oriented analytical frameworks. In this context, Chen et al. (2026) developed an integrated approach combining text mining and explainable machine learning to identify and interpret patterns in urban bus crash risk. Their framework demonstrates how predictive models can be extended beyond accuracy-focused evaluations to provide actionable safety insights through interpretable risk analysis. This emerging direction highlights the importance of linking the model performance with real-world safety decision-making.
Further, as summarised in Table 1, the literature is dominated by studies from the United States of America and often applies single models without systematic optimisation for imbalance. Although ensemble methods, such as RF and XGBoost, frequently perform best, their superiority is not guaranteed in LMICs with noisy, imbalanced data. Although recent studies have incorporated explainable machine learning techniques, limited attention has been paid to understanding how model performance and interpretability interact under severe class imbalance conditions.
Determinants of Bus Crash Injury Severity
Bus crash severity is influenced by a complex interplay of road infrastructure, environmental conditions, vehicle characteristics and the behaviour of the bus driver and other road users. In LMICs, these factors are exacerbated by systemic issues. Driver-related factors, such as right-of-way violations, fatigue, and inexperience, are predominant contributing factors (Goh et al., 2014). Demographic factors also play a role; for instance, both younger, inexperienced drivers and older drivers (>60 years) are associated with increased collision risk (Li & Fan, 2019).
Infrastructure deficiencies, such as poor road conditions, unplanned bus stop locations, and inadequate lighting all contribute to severe bus crashes. In Dhaka City, rapid urbanisation has led to extreme congestion and frequent rear-end collisions, often exacerbated by informal and congested bus stops (Barua & Tay, 2010). Environmental factors, such as rainfall and fog, further compound these risks by reducing visibility and road traction (Islam & Burton, 2020). A critical characteristic of bus crashes in LMICs is their interaction with vulnerable road users (VRUs); collisions involving pedestrians and cyclists often result in disproportionately severe outcomes (Prato & Kaplan, 2014).
Substantial contextual challenges limit road safety action in most LMICs including Bangladesh. While police reports provide the most comprehensive understanding of a crash event, there are well-documented biases, including underreporting of non-fatal crashes and a lack of detail on crash mechanics. This underreporting is most evident when compared to hospital data however, hospital data lacks crash detail. Secondly, Dhaka City’s traffic ecosystem is chaotic, characterised by extreme heterogeneity in vehicle types, informal traffic operations, and weak enforcement of regulations. Although this traffic environment is similar to other countries across South and South East Asia, these conditions starkly contrast with the high-income country conditions modelled in most existing literature. While studies in other LMICs, like Ghana, have highlighted environmental factors (Sam et al., 2018) Dhaka City’s specific monsoonal climate and severe air pollution pose unique environmental stressors that are currently unquantified in severity-prediction models. Furthermore, despite the growing emphasis on risk-based and explainable analytical approaches in recent literature, the integration of such perspectives into LMIC-specific bus crash severity modelling remains limited. This underscores the need for a tailored modelling approach to capture these context-specific risk profiles.
Our study addresses the gaps in traditional analysis methods by applying a rigorous comparative framework to the 2015-2022 Dhaka City crash data, systematically evaluating ensemble and baseline models through resampling and hyperparameter optimisation, and interpreting the results to identify context-specific risk factors. This study contributes to predictive modelling and risk-informed interpretation by examining how different modelling strategies influence the identification of critical safety determinants. This approach provides actionable insights for urban safety policies in LMIC megacities.
Study setting
Dhaka City, the capital of Bangladesh, is one of the world’s most densely populated megacities, with over 20 million people. The city experiences rapid urbanisation, severe congestion, and heterogeneous traffic conditions, with buses sharing roads with metro rails, private cars, motorcycles, auto-rickshaws, cycle-rickshaws, and pedestrians. Public buses are Dhaka City’s primary motorised public transport and are mainly used by low- and middle-income commuters, students, and service holders because of their affordability and broad coverage. However, bus services are characterised by overcrowding, irregular schedules, and long travel times. Unlike in more developed cities, buses operate in mixed traffic without dedicated lanes or widespread transit priority measures, and traffic management systems remain limited. Consequently, buses frequently face complex traffic interactions and congestion-related delays. Compared with private vehicles, bus travel is more affordable but offers lower comfort, convenience, and travel-time reliability. These characteristics make Dhaka City representative of many urbanising low- and middle-income cities facing public transport safety and operational challenges, providing a setting for examining the factors influencing bus crash injury severity.
Materials and Methods
Crash Data
Police reported crash data was obtained from the Dhaka Metropolitan Police (DMP) Headquarters. Typically, local police officers gather information at the scene of a crash using an Accident Reporting Form (ARF), which is then submitted to Police Headquarters. The ARF data is subsequently entered into the Microcomputer Accident Analysis Package (MAAP) for systematic analysis.
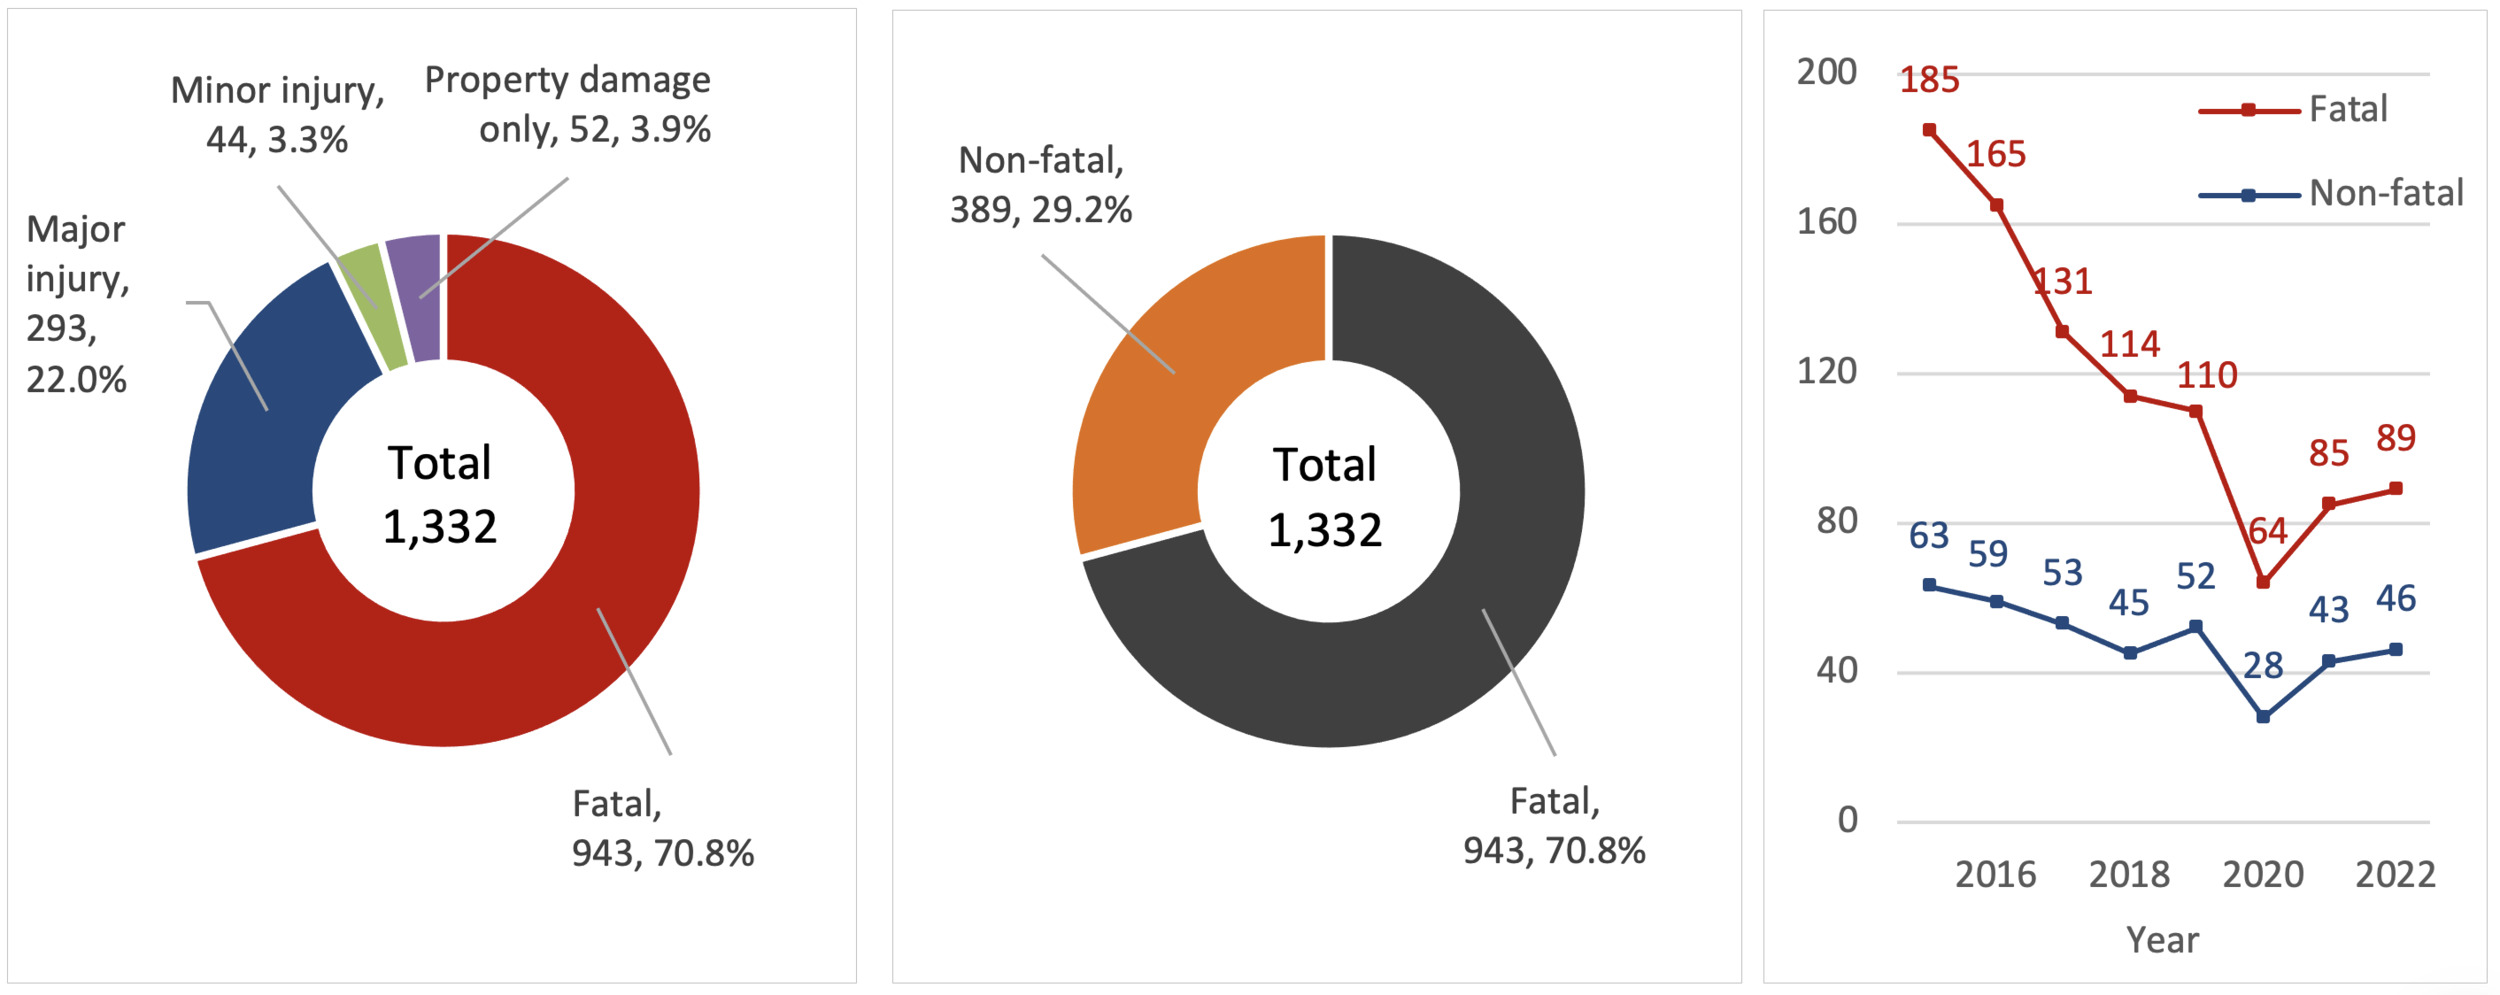
This study examined 1,332 crashes recorded by DMP police between 2015 and 2022. The crashes were categorised into four types: fatal, major injury, minor injury, and property damage only (PDO). As illustrated in Figure 1, the figure presents the distribution of crash severity in the dataset. Although police-reported crash data in Bangladesh may be subject to underreporting, particularly for non-fatal crashes, this limitation has been acknowledged in previous studies (Sakib et al., 2024). Consequently, the dataset may over-represent severe crashes, and this should be considered when interpreting the findings. To address this concern, crash severity was reclassified into two levels: fatal and non-fatal, with the latter encompassing major injuries, minor injuries, and PDO crashes.
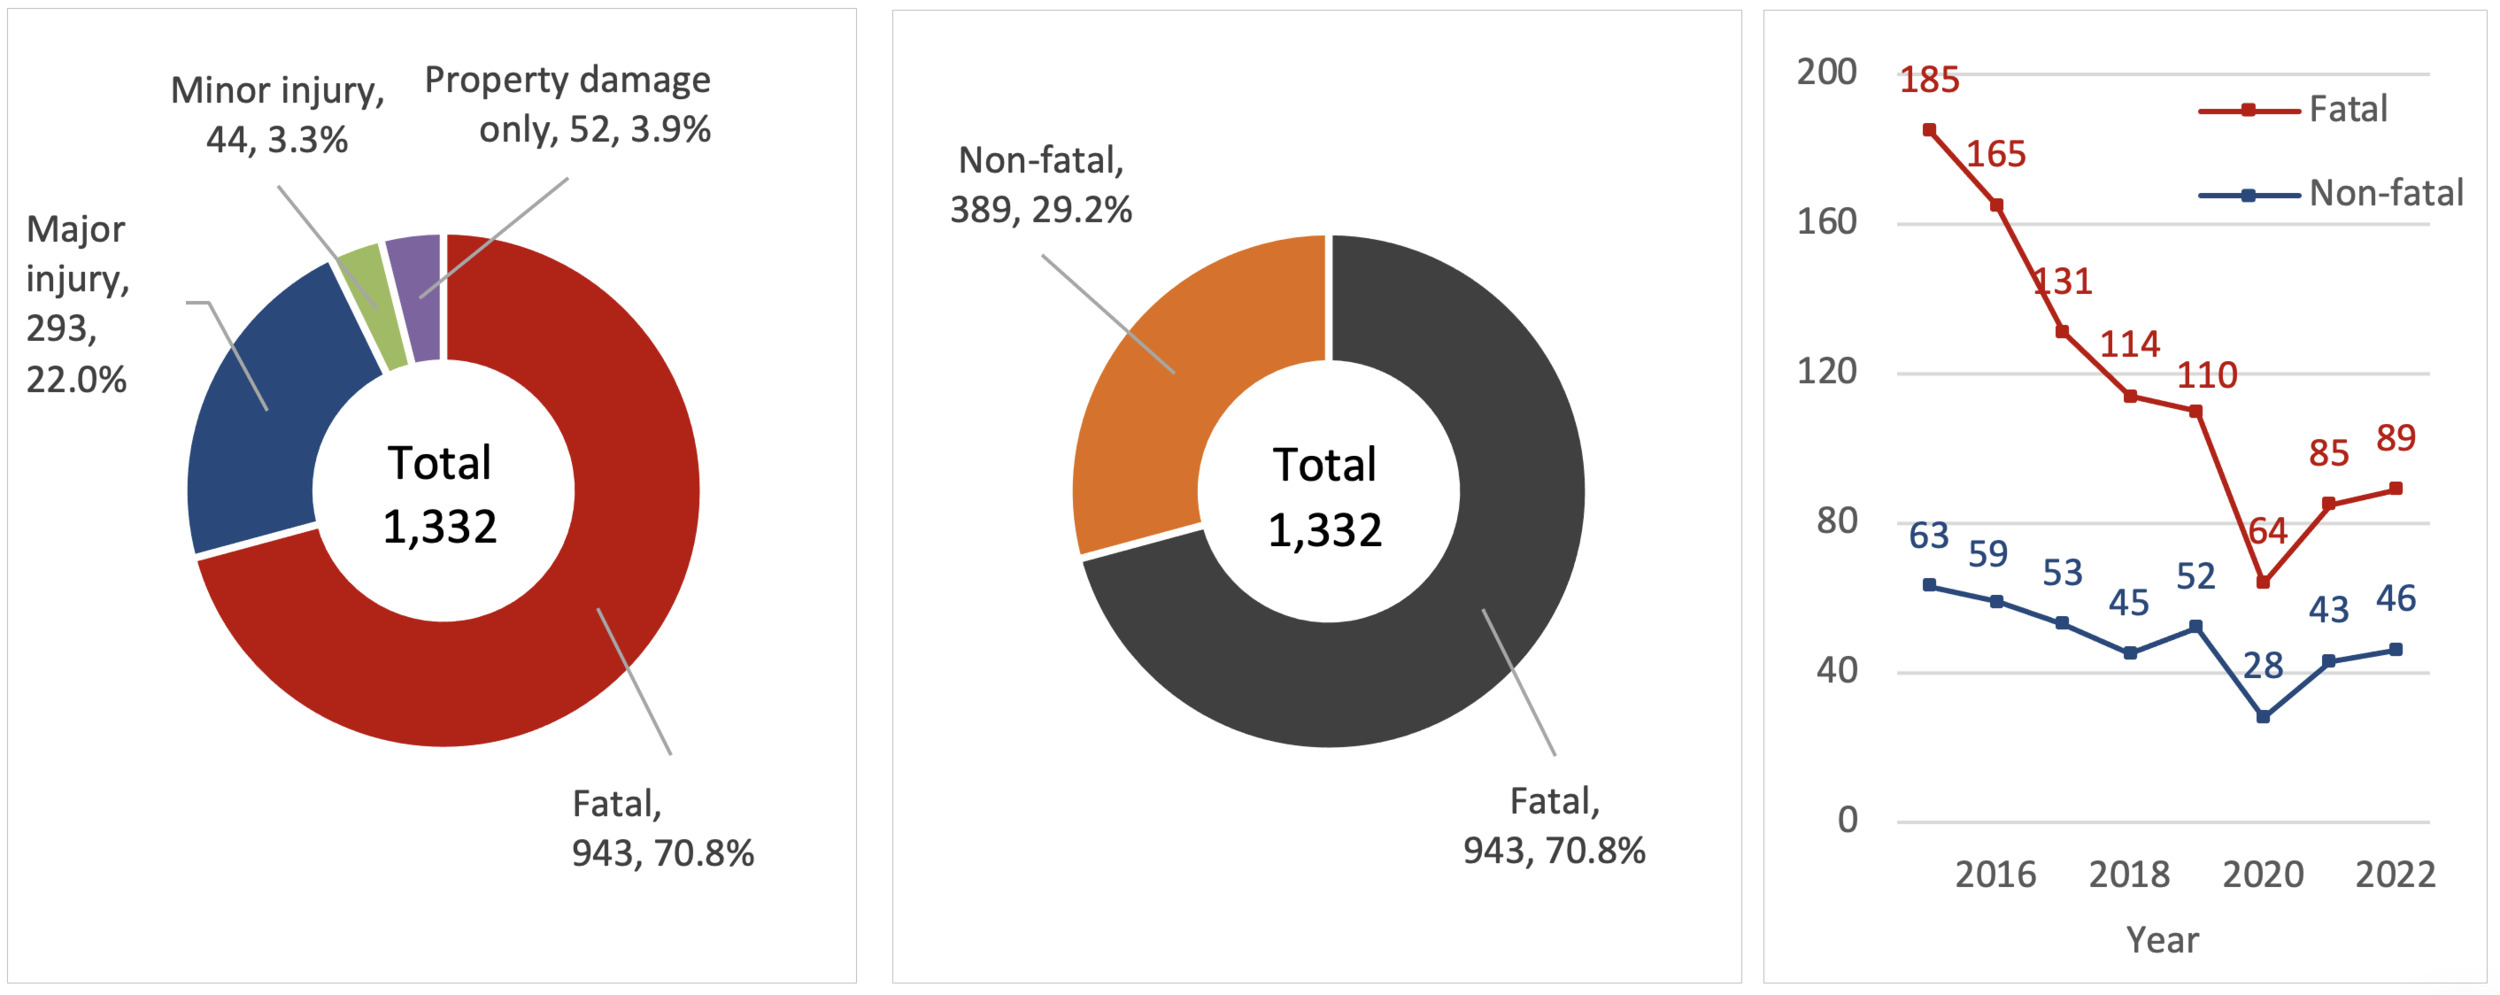
Table 2 shows a notable decline in the proportion of fatal crashes in the study sample, from 0.14% of the total in 2015 to 0.08% in 2019, while the proportion of non-fatal crashes remained consistently low (0.05% in 2015 and 0.03% in 2019). These percentages represent the proportion of crashes in the study dataset (n = 1,332) rather than population-based crash rates. A multifactorial analysis revealed significant associations between crash severity and factors related to the environment, vehicle, driver and pedestrian.
Infrastructural and environmental factors contributed to crash severity. The proportion of fatality crashes were notably higher at some locations: curved roads had fewer crashes yet a higher fatality proportion (5.8%) compared to crashes that occurred on straight sections of road (3.4%) and, unsignalised intersections (14.1%) compared to crashes that occurred at signalised intersections (56.7%). Collison dynamics revealed single-vehicle (48.6%) and hit-pedestrian (46.8%) crashes were particularly fatal. Nighttime crashes recorded a higher fatality rate (20.6%) compared to daytime crashes (39.3%) and weather conditions significantly increased fatalities (Zafri et al., 2020).
Vehicles with valid fitness certificates accounted for a slightly higher proportion of fatal crashes (36.6%) than vehicles without valid fitness certificates (34.2%), with “Crossing” manoeuvres accounting for the highest fatality proportion (59.8%). Although less common, vehicle overloading and mechanical defects were disproportionately associated with severe outcomes, underscoring the importance of vehicle integrity. Driver-related characteristics emerged as critical determinants: male drivers were involved in almost all crashes (over 99.7%) with a 70.5 percent fatality likelihood; over half of all deaths (57.3%) were drivers aged 20–40 years; driver alcohol involvement elevated fatalities to 62.2%. Seat belt use reduced fatality rates dramatically (likelihood of fatality without seatbelt: 67.9%; with seatbelt: 2.9%). In Dhaka City, buses are the most common motorised mode of transportation, compared with motorcycles and trucks. Rickshaws are also widely used, but they are non-motorised and involved in fewer fatal crashes. Pedestrian involvement further amplified risk, particularly for adult males, with crashes involving one or more pedestrian casualties accounting for 19.6% of fatal crashes and 16.3% of non-fatal crashes.
Table 2 presents all the independent variables considered in the analysis, their binary encodings, and the percentage distribution of fatal and non-fatal crashes across each category.
Ensemble Learning
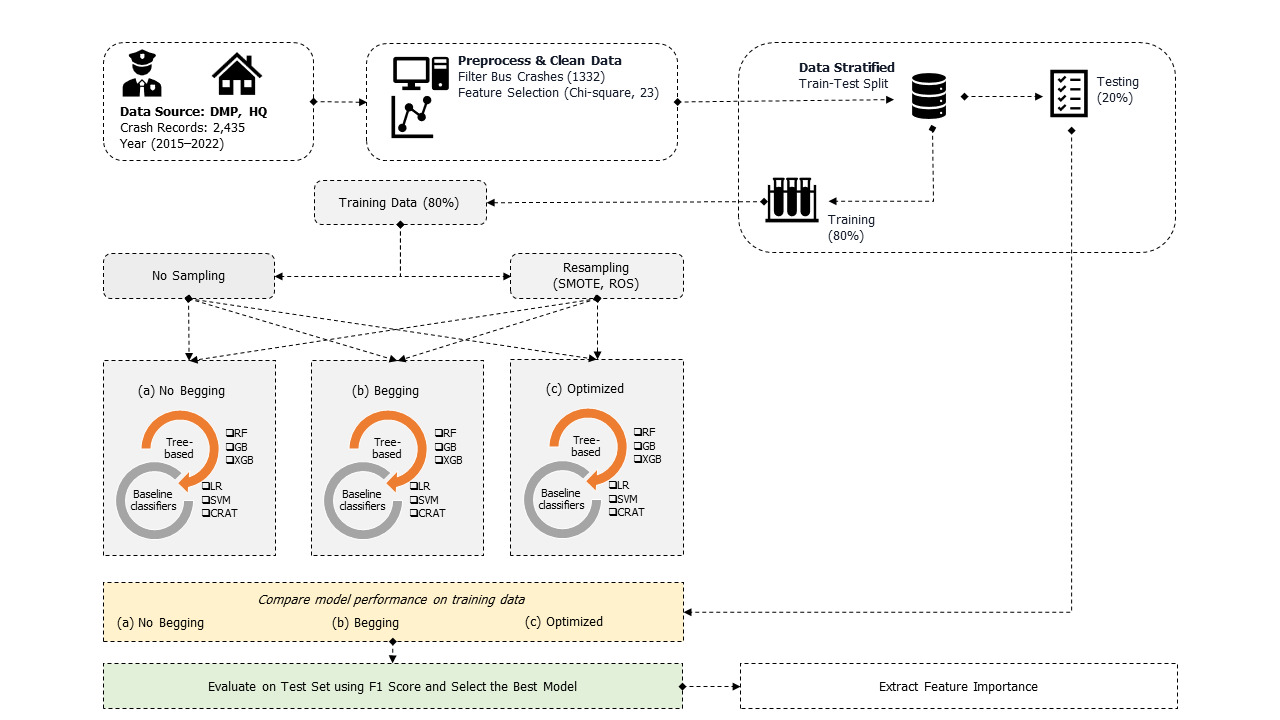
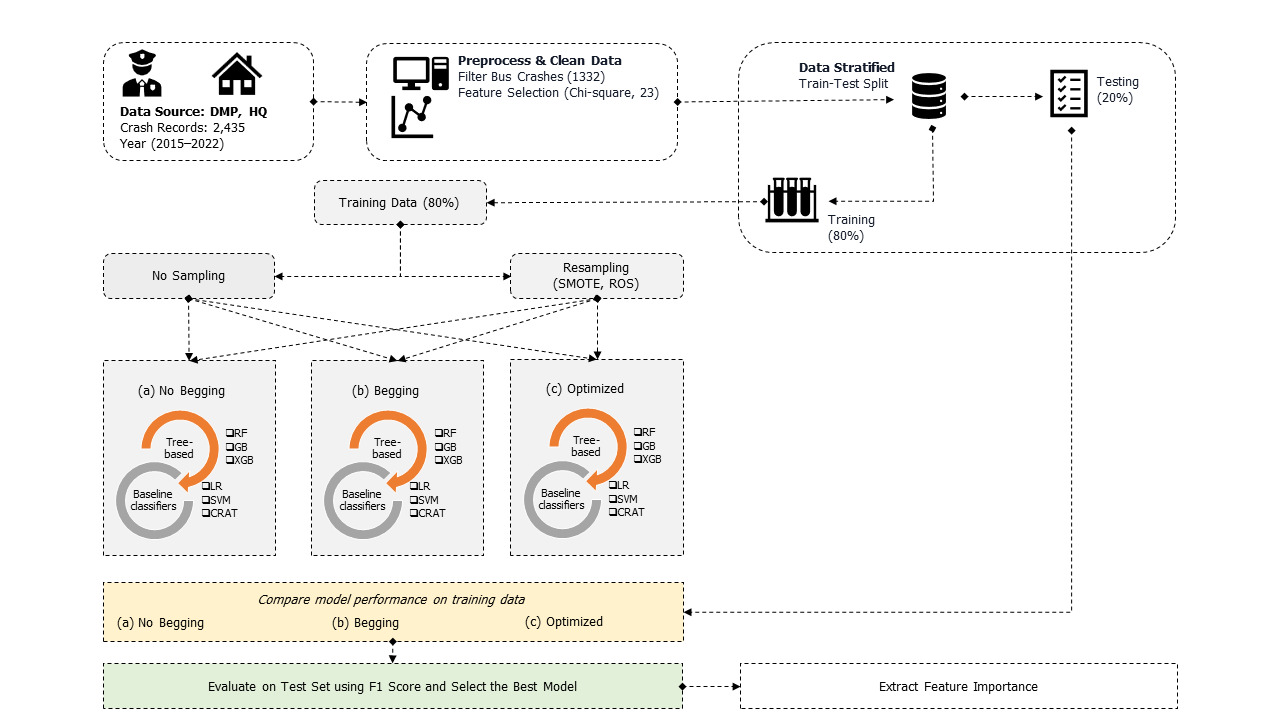
In this study, ensemble learning was implemented using Python (see Figure 2), starting with data preprocessing and cleaning. Next, Chi-square tests were conducted and identified 23 key variables for inclusion in the dataset. Subsequently, the data were stratified into training (80%) and testing (20%) sets. During the modelling phase, six classifiers were employed: three tree-based models, Random Forest (RF), Gradient Boosting (GB), and Extreme Gradient Boosting (XGB), alongside three baseline models, Logistic Regression (LR), Support Vector Machine (SVM), and Classification and Regression Trees (CART). These models were trained under three scenarios, using various sampling techniques, including no sampling, resampling (SMOTE and Random Oversampling), and different training strategies (No Bagging, Bagging, and optimised via GridSearchCV). Performance was primarily evaluated using the F1 score on the training data and further validated on the test set to identify the best-performing model. Additionally, feature importance was assessed to pinpoint the most significant factors that contributed to bus crashes. This methodology comprehensively evaluates classifiers under diverse conditions, incorporates techniques to address imbalance, and emphasises predictive accuracy and interpretability.
Results and Discussion
In this study, six machine learning classifiers were applied to predict fatal versus non-fatal bus crashes in Dhaka City to account for highly imbalanced datasets. The models were developed and trained under several configurations, including baseline training, bagging, and hyperparameter optimisation using GridSearchCV, with and without resampling (SMOTE and ROS).
Comparative Performance of Machine Learning Models
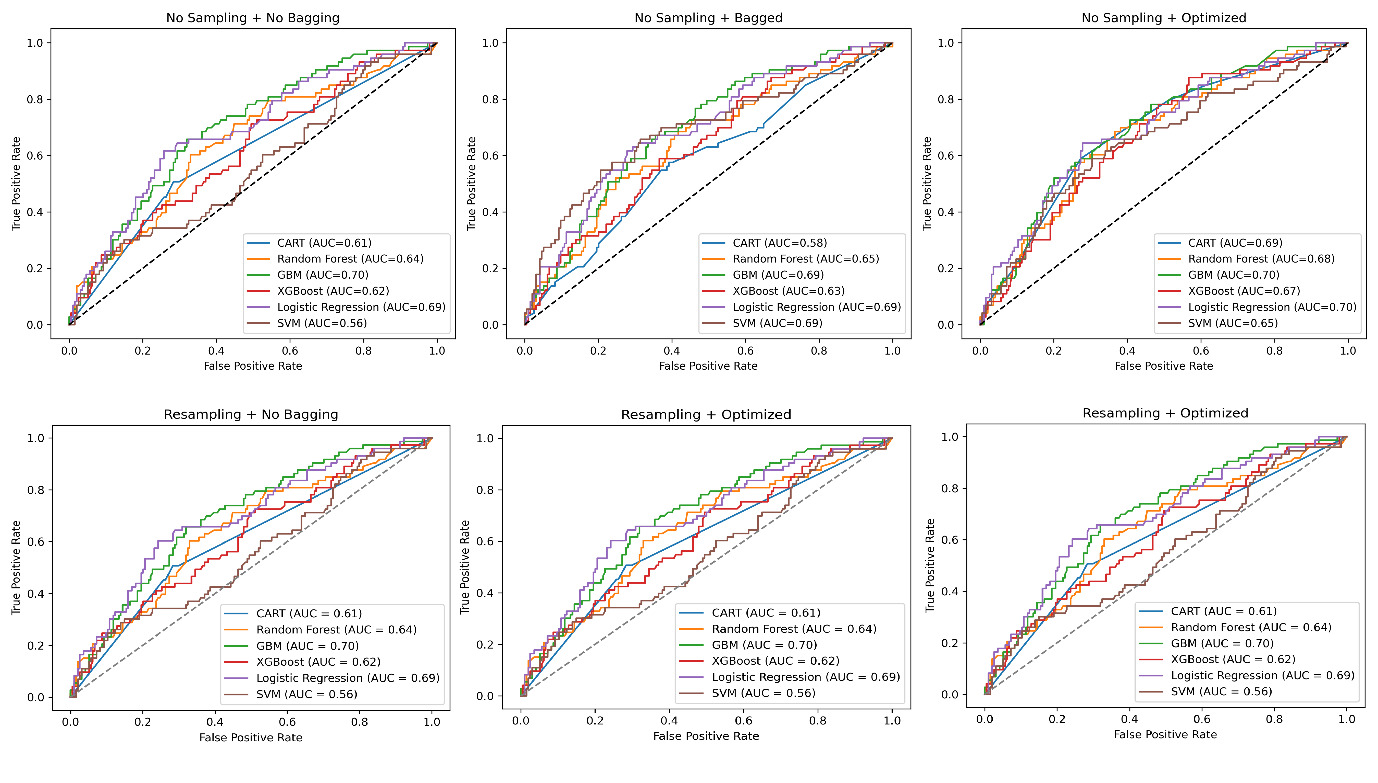
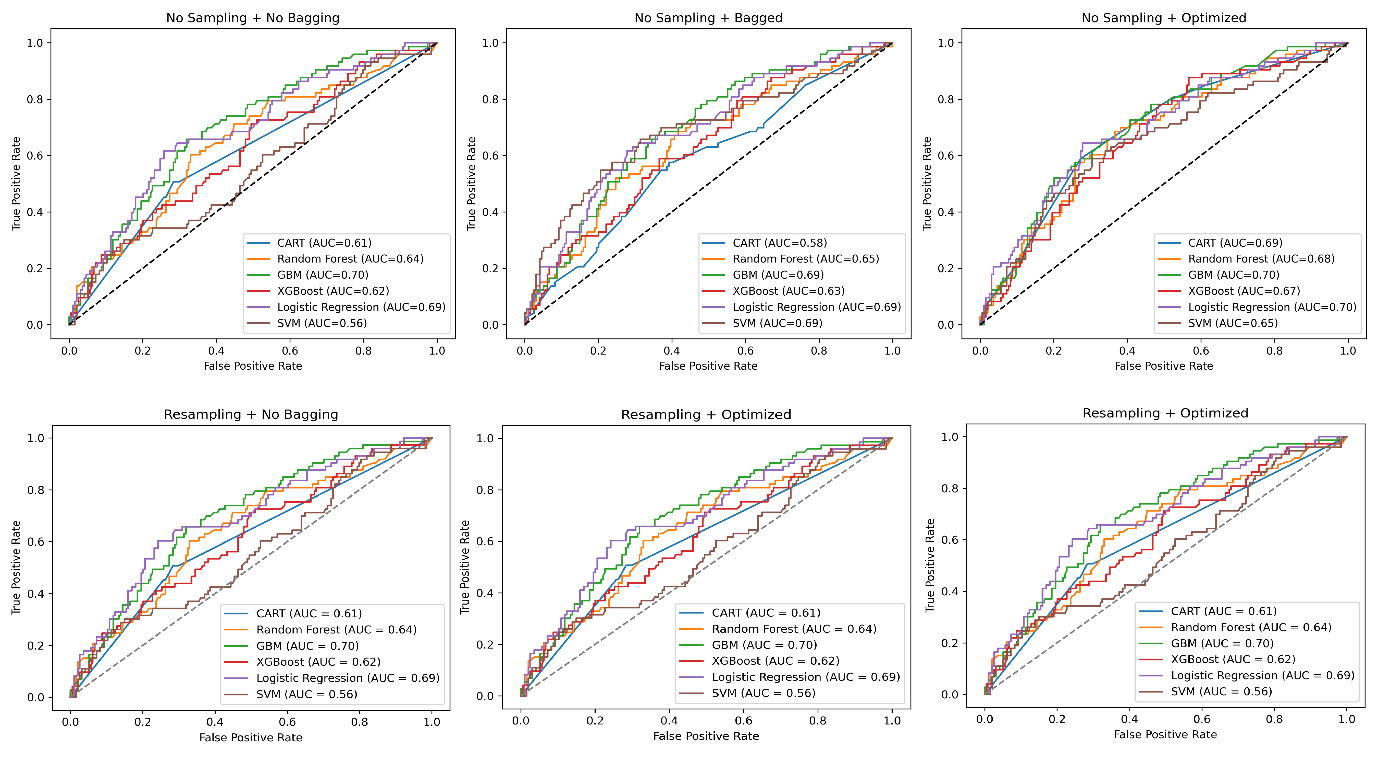
The comparative predictive performances of the machine learning models summarised in Table 3 and Figure 3 illustrates the effectiveness of the different modelling strategies. The comparative analysis revealed three key findings.
First, Logistic Regression and Gradient Boosting models were the most robust and effective classifiers for the imbalanced task of predicting bus crash severity. Without resampling, the hyperparameter-optimised Logistic Regression achieved the highest performance metrics. Notably, a precision of 60.0 percent was achieved for the critical minority class (fatal injury, class 1) and an overall accuracy of 74.5 percent. The optimised Gradient Boosting model achieved an AUC score of 70.2 percent and an F1-score of 84.0 percent for the majority class (non-fatal injuries, Class 0), confirming its strong predictive capability. This indicates that a well-tuned probabilistic Logistic Regression model and an advanced Gradient Boosting model are well-suited for analysing complex, imbalanced crash data.
Notably, the superior performance of the Logistic Regression model in this study contrasts with previous studies, where machine learning models such as Random Forest and Extreme Gradient Boosting generally exhibited higher predictive accuracy (Jeong et al., 2018; Lin et al., 2020). One possible explanation is the heterogeneous and noisy nature of traffic datasets in Dhaka City. Consistent with our findings, previous research has reported that Logistic Regression maintains competitive performance under substantial variability and measurement noise (Huting et al., 2016). Therefore, a notable methodological contribution of this study is the demonstration that optimised Logistic Regression can outperform complex ensemble algorithms when applied to highly imbalanced urban crash datasets.
Second, contrary to expectations, the resampling techniques (SMOTE and ROS) produced negligible improvements. For instance, the AUC of Logistic Regression remained essentially unchanged with or without SMOTE, whereas gradient boosting showed only marginal variation. These findings suggest that the challenge of identifying fatal crashes is not driven solely by class imbalance but by substantial class overlap (feature commonality) between fatal and non-fatal conditions across predictors such as time of day and collision type. When such an overlap exists, synthetic oversampling cannot generate truly informative minority-class samples because the underlying decision boundary remains weak. Furthermore, the categorical nature of the variables likely reduced the effectiveness of the interpolation-based method (SMOTE), which can introduce noise in mixed-type datasets. This finding aligns with previous findings where oversampling was reported to provide limited benefits when minority class patterns are highly heterogeneous (Yahaya et al., 2020).
Third, hyperparameter optimisation (GridSearchCV) achieved significant but model-specific improvements. This process markedly improved the precision for fatal injuries (Class 1) in both Logistic Regression (from 53.0% to 60.0%) and Gradient Boosting (from 47.0% to 57.0%). However, it also induced overfitting in certain models, notably Extreme Gradient Boosting, where the precision for class 1 declined post-optimisation (from 41.0% to 35.0%). The Random Forest model achieved only a modest improvement (achieving a precision of 48.0%), indicating persistent challenges in learning the characteristics of the minority class. The bagging ensemble technique provided only marginal benefits, highlighting that advanced hyperparameter tuning is more impactful than simple bootstrapping for this application. Notably, Logistic Regression showed a relative improvement in precision (13%) for fatal cases through tuning, whereas resampling offered no comparable advantage.
Analysis of Influential Factors
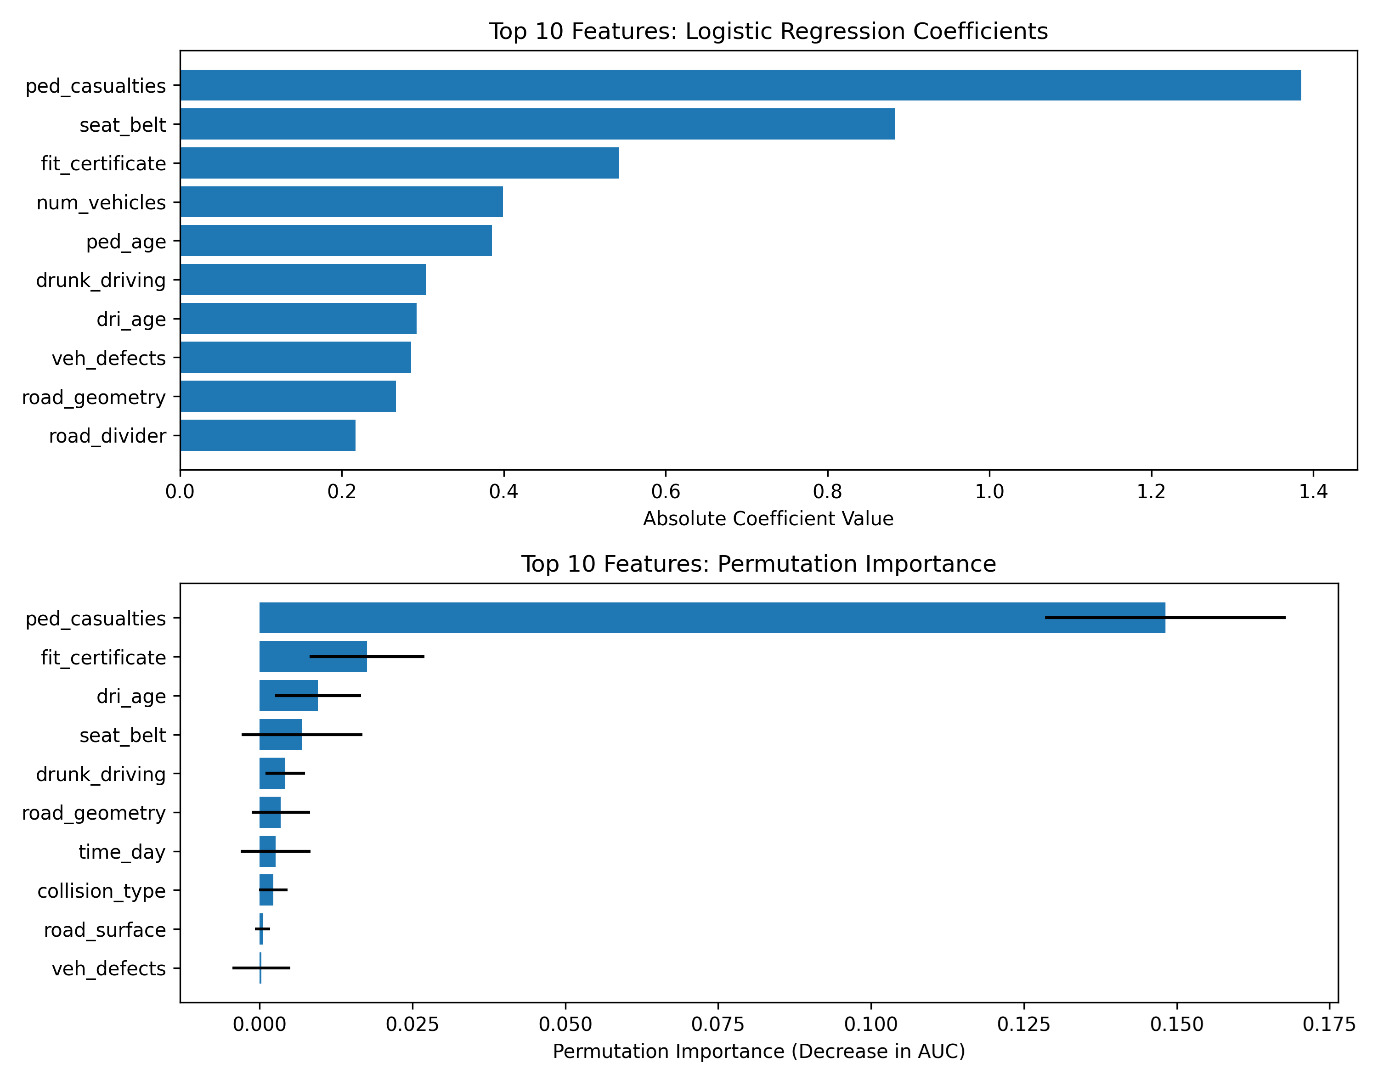
Overall, the Logistic Regression model demonstrated the highest predictive reliability. The analysis extends beyond model classification to evaluate the key determinants of fatal bus crash outcomes. Figure 4 compares the most influential predictors, contrasting the magnitudes of the Logistic Regression model coefficients against permutation importance scores, which reveal a consistent set of high-impact predictors: pedestrian casualties, seat belt usage, vehicle fitness certification, driver age, driver drink driving, vehicle defects, and road geometry, suggesting that these factors play a significant role in shaping bus crash injury severity in Dhaka City.
Among the analysed predictors, pedestrian-involved crashes are most strongly linked to crash severity, exhibiting both the largest coefficient magnitude in the logistic regression model and the highest permutation importance score. This finding highlights the extreme vulnerability of pedestrians in bus-related crashes, particularly in contexts where public transportation and vulnerable road users share limited spaces. Consistent with prior research, high pedestrian exposure on dense urban road networks remains a dominant predictor of fatal outcomes (Prato & Kaplan, 2014; Zafri et al., 2020).
Similarly, driver seat belt use and vehicle (bus) fitness certification showed clear protective effects. Notably, seat belts are generally not available to passengers. These findings indicate that basic safety compliance, such as driver seat belt use and regular or periodical vehicle fitness certificate inspection, can significantly reduce the probability of fatal outcomes in bus crashes. While these results align with the existing road safety literature in Dhaka City, this study provides a critical advantage: it utilises more recent crash data whereas previous studies often relied on older datasets (Hasanat-E-Rabbi et al., 2022). These findings suggest that strict enforcement of vehicle fitness standards remains highly effective in reducing fatalities in Dhaka City’s urban transit system.
Driver-related factors were also relevant. In particular, driver age and drink driving represent behavioural risk factors that may influence crash severity, indicating that driver characteristics and impaired driving conditions can contribute to more severe outcomes. These observations are consistent with previous studies that highlighted the role of driver behaviour in traffic safety (Li & Fan, 2019; Uddin & Ahmed, 2018).
In addition to regulatory compliance factors, vehicle-related conditions play a significant role in urban crash dynamics. Mechanical defects, including brake failures, poor tire condition, and overall mechanical unreliability underscore the importance of maintaining safe vehicle operating conditions. When vehicles are not adequately maintained, these mechanical deficiencies can compromise vehicle controllability and reduce a driver’s ability to respond effectively to traffic conditions thereby increasing the risk of crashes. This issue is particularly critical for large vehicles, such as buses, where poor mechanical conditions may substantially increase both crash likelihood and severity owing to their size, weight, and operational characteristics (Adanu et al., 2024; Hasanat-E-Rabbi et al., 2022).
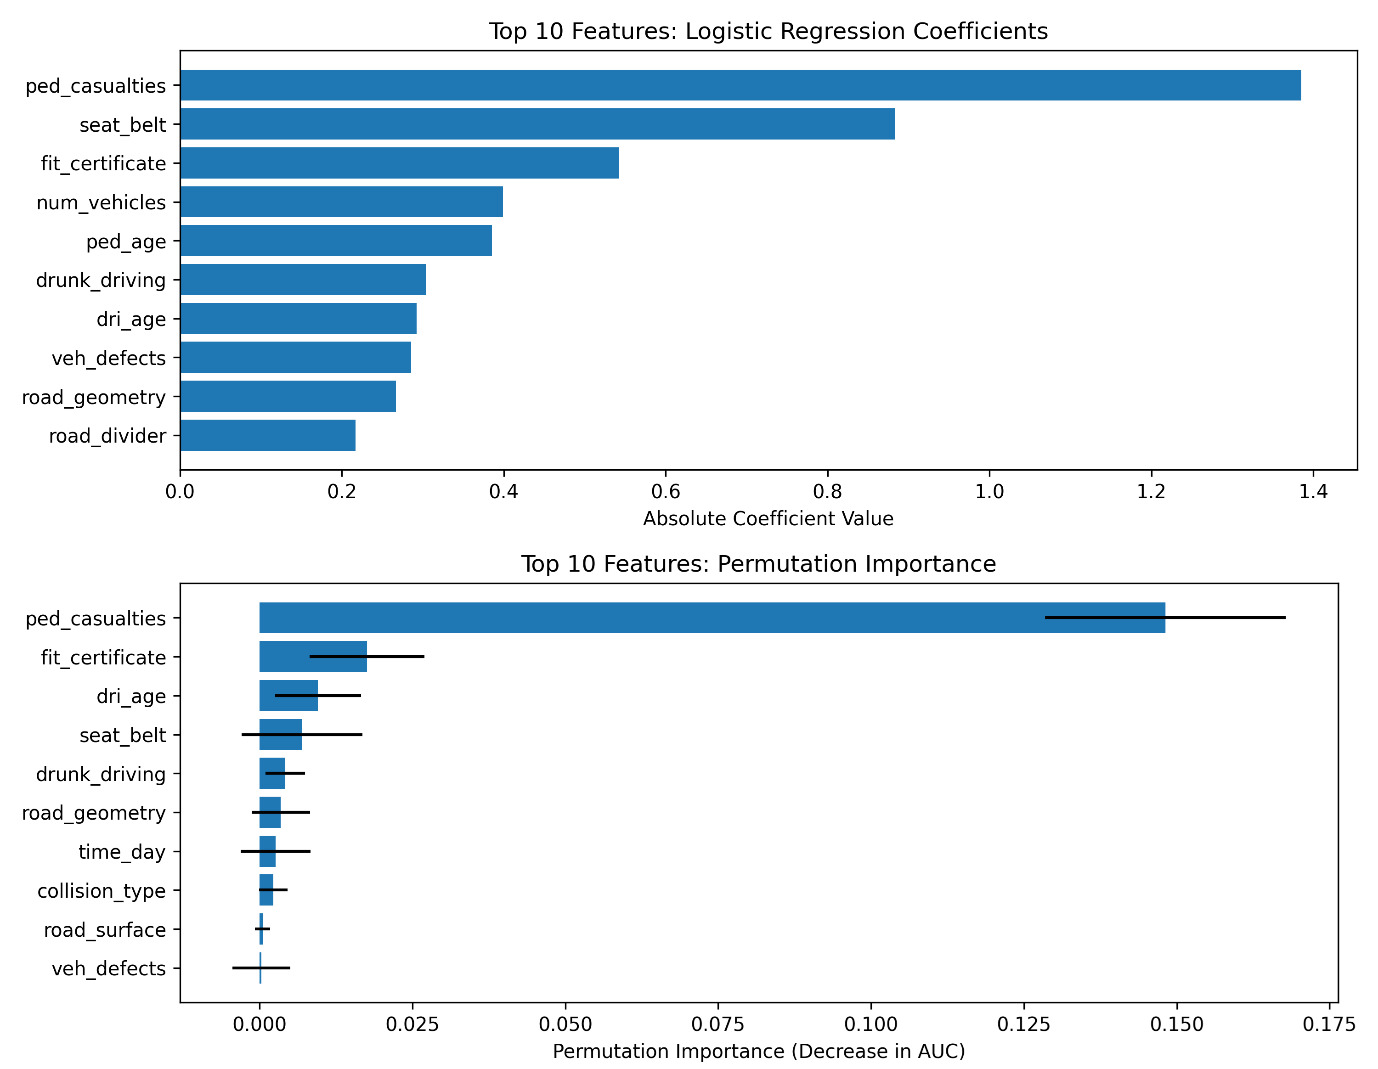
Figure 4 presents the ranking of the relative importance of variables in predicting bus crash severity. Road geometry is an important contextual factor, suggesting that roadway design influences the dynamics of crash severity. In Dhaka City, many primary and secondary roads are predominantly straight and flat, which may encourage higher speeds. In addition, several residential areas, such as Baridhara, Gulshan, Dhanmondi, Purbachal, and Uttara, follow gridiron street patterns, which can facilitate uninterrupted vehicle movement and potentially increase the severity of crashes when conflicts occur (Ahmed et al., 2014; Zafri et al., 2020).
Overall, the consistency between the coefficient-based interpretation and permutation importance analysis strengthens confidence in the identified determinants. These findings highlight the importance of improving pedestrian safety infrastructure, enforcing vehicle fitness certification, encouraging seat belt compliance, and addressing risky driving behaviours to reduce the risk of fatal injuries in bus crashes in Dhaka City’s urban transport system.
Table 4 shows the results of the Logistic Regression model used to identify the factors influencing bus crash injury severity. The model has acceptable explanatory power, with a McFadden pseudo-R² of 0.107 comparable to values reported in crash-severity research, where behavioural and environmental factors limit predictive accuracy (Rahman et al., 2021). The likelihood ratio test confirmed the model’s validity, showing a significant improvement in fit over the null model (LLR p < 0.001). These results suggest that the variables collectively help explain the variations in crash injury severity. Consistent with earlier findings on feature importance, several key factors stand out from the analysis, notably vehicle fitness certification, seat belt use, and pedestrian injury. The coefficient for fit_certificate was negative and significant (β = −0.62, p < 0.01), with an odds ratio of 0.54 (95% CI: 0.40–0.73), indicating that after adjusting for the other variables included in the Logistic Regression model, vehicles with valid fitness certificates were associated with approximately 46% lower odds of fatal outcomes than vehicles without valid fitness certificates. This adjusted association may differ from the descriptive proportions presented in Table 2 because the Logistic Regression model estimates the independent effect of each variable while controlling for the influence of other covariates. Similarly, seat belt use showed a strong protective effect (β = −1.02, OR = 0.36, p < 0.01), indicating an approximate 64 percent reduction in the risk of fatal injury. Conversely, pedestrian casualties significantly increased the fatality risk, with a positive association (β = 1.35, OR = 3.86, p < 0.01), indicating that crashes involving multiple pedestrians were nearly four times more likely to be fatal. The number of involved vehicles was marginally significant at the 90 percent confidence level (β = −0.60, OR = 0.55, p < 0.10), suggesting a possible influence on severity. Most other variables, such as driver age, weather, and road features, were not statistically significant, indicating that behavioural safety measures and pedestrian exposure are more crucial in determining the crash severity. Overall, these results emphasise the importance of vehicle safety compliance, occupant protection, and pedestrian interventions in reducing fatal injuries in urban bus crashes.
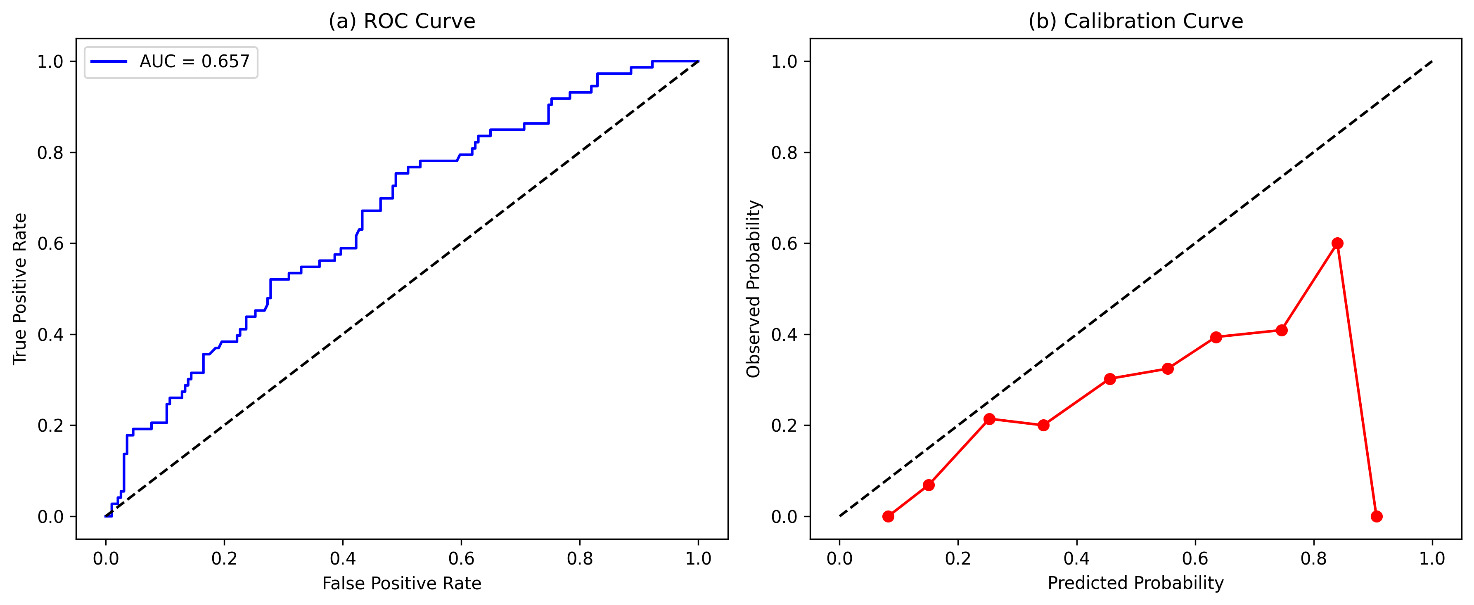
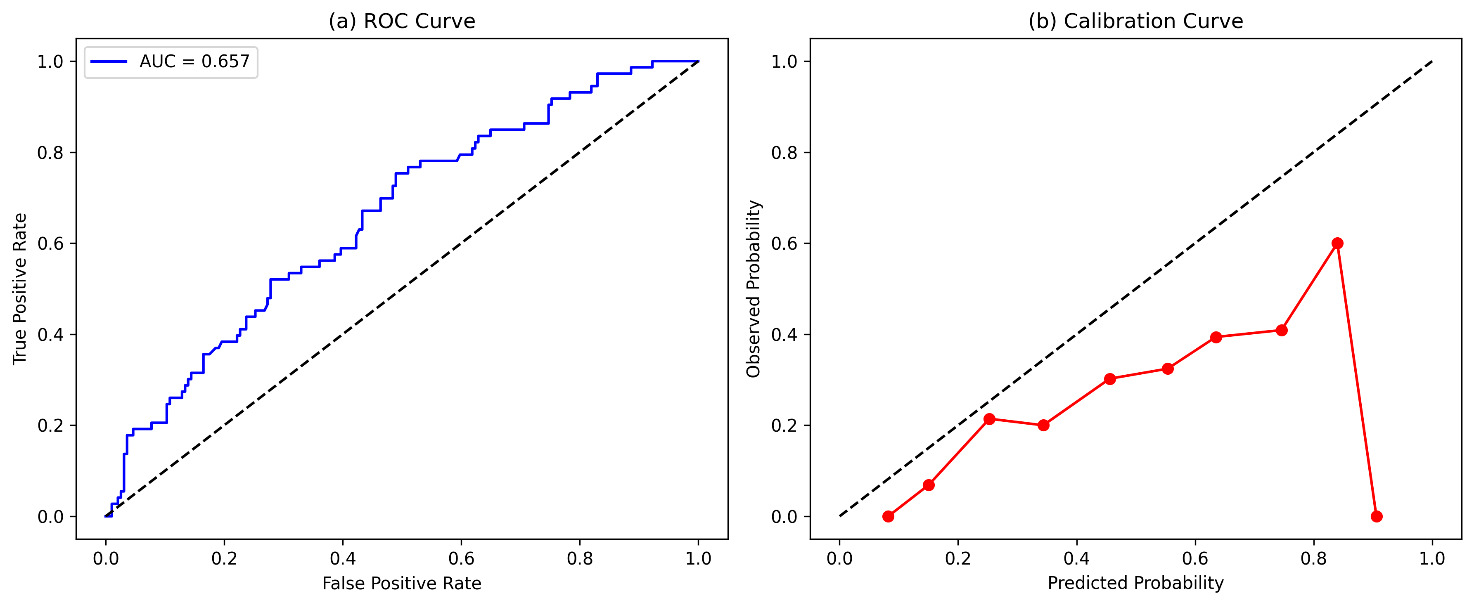
Figure 5 shows the performance of the Logistic Regression model. The ROC curve (a) indicates moderate discrimination with an AUC of 0.657. The calibration curve (b) shows deviations from the ideal line, suggesting the model is not well calibrated, especially at higher predicted probabilities.
Conclusions and Policy Implications
This study evaluated machine learning models for predicting injury severity in urban bus collisions in Dhaka City, addressing the class imbalance between non-fatal and fatal outcomes by using SMOTE. Logistic Regression (LR) and Gradient Boosting (GB) were the most effective models: LR achieved the highest precision for fatal injuries (60.0%) whereas GB excelled in overall discrimination (AUC: 70.2%) and balanced accuracy (F1-Score: 84.0%). Resampling techniques (SMOTE, ROS) offered only minimal improvement, highlighting that predictive challenges stem from class imbalance and the presence of complex, noisy features. The SVM’s failure to predict fatal injuries (0.0% precision) further highlights the algorithm’s sensitivity to imbalanced data.
Feature importance analysis consistently identified pedestrian casualties, seat belt usage, and vehicle fitness as critical determinants of crash severity, with driver age and environmental factors influencing outcomes. These insights translate into clear policy priorities.
-
Pedestrian Protection: Prioritise the design and strict enforcement of pedestrian-only signal phases at traffic signals near major bus stops and intersections to enhance pedestrian safety
-
Data Collection: Our study also highlights the need for improved, digitalised crash data collection by police, including more detailed fields on crash causation (e.g., distraction, speeding) to enhance future model performance.
-
Vehicle Safety Enforcement: Ensure seat belt compliance and robust, corruption-free vehicle certification systems, supported by public awareness campaigns.
-
Targeted Driver Training: Tailor programs for higher-risk age groups.
-
Data-Driven Traffic Management: Implement adaptive strategies based on time of day and road conditions.
Furthermore, incorporating spatial analysis (GIS) to identify high-risk crash corridors and time-series analysis to understand temporal trends could provide an even more robust tool for proactive safety planning in the future.
AI tools
The authors declare that no AI tools were used in conducting this study or preparing the manuscript.
Acknowledgements
The authors sincerely thank the Dhaka Metropolitan Police (DMP) for providing access to the crash data used in this study. Their valuable cooperation and support were instrumental in facilitating the successful completion of this research
Author contributions
B. M. Assaduzzaman Nur: Conceptualisation; Data collection; Data analysis; Visualisation; Original draft preparation. Md. Mizanur Rahman: Supervision; Methodology; Writing review and editing. Md. Shamsul Hoque: Proofreading; Critical review; Final manuscript correction.
Funding
The authors did not receive any financial support, funding, or grants for the research, authorship, or publication of this article.
Human Research Ethics Review
Application to access crash data from the Dhaka Metropolitan Police was made in accordance with Bangladesh’s national guidelines. Study protocols were reviewed by the Bangladesh University of Engineering and Technology (BUET) and that issued a waiver of ethical approval (Ref: CED/05/54).
Data availability statement
The authors do not have permission to share the restricted crash data analysed in this study. Application to access the data can be made to the Dhaka Metropolitan Police.
Conflicts of interest
The authors declare that there are no conflicts of interest.