Introduction
Pedestrians, along with cyclists and motorcyclists, are classified as “vulnerable road users” due to their high risk compared to others. In India, mixed traffic conditions, coupled with increasing vehicle ownership and novice young drivers, lead to higher congestion, traffic conflicts and crashes. Previous research has identified that the distribution of demographic characteristics across rural, semi-urban, and urban areas has a greater impact on variations in driver behaviour and attitudes than the features of the traffic environment (Nordfjærn et al., 2010).
India represents about 1 percent of the global vehicle population, but with 10 percent of worldwide road fatalities, it is one of the most vulnerable countries in terms of road safety. Despite efforts from governments and relevant agencies, the daily number of fatalities on Indian roads has not reduced from 2018 to 2022 (MoRTH, 2023). Implementation of road safety policies and action plans in most countries in Asia have not led to an overall reduction in fatalities from road crashes as Thailand, Vietnam, Myanmar and China also continue to have high fatality rates (Regmi, 2021). In India, the Ministry of Road Transport and Highways (MoRTH, 2022) reported that a third of crashes in India (155,781/461,312) were fatal resulting in 168,491 deaths. However, according to reports from the Bengaluru Traffic Police (2024), there has been no reduction in the issuing of fines due to traffic violations.
Traffic risk perception directly influences pedestrian behaviour, with individuals who perceive a higher level of traffic risk tending to engage in safer pedestrian practices (Dinh et al., 2020). In a study of self-reported pedestrian behaviours in six countries, McIlroy et al. (2020) reported that attitudes toward violations of traffic rules and hazardous driving behaviours are closely linked to pedestrian actions. Notably, attitudes about risky or rule violating behaviours related to pedestrian behaviour impact how those behaviours are performed and attitudes about risky or rule violating behaviours while driving or riding motorised vehicles also influence their actions as pedestrians. Nordfjærn and Şimşekoğlu (2013) reported that a greater sense of safety related to pedestrian safety was associated with lower levels of risk taking behaviour.
Traffic risk perception refers to how people subjectively assess the dangers associated with different traffic scenarios (Deery, 1999). While earlier research has highlighted a significant connection between pedestrians’ perceived risk and actual behaviour, there has been limited research investigating how traffic risk perception influences pedestrian behaviour (Granié, 2009). In the area of road safety, Ulleberg and Rundmo (2003) identified perceptions related to crash risks were linked to attitudes towards traffic safety, and that both attitude towards safety and perceptions played a role in influencing driving behaviour.
Saxena (2023) reported that perceived risk of crashes (CRP) influences how fast pedestrians think they can cross a road safely. People who perceive higher crash risks tend to cross more slowly and this indirectly affects crossing speed through their crossing patterns (CP). The study underscores the importance of addressing pedestrian safety perceptions. Shoabjareh et al. (2021) reported that pedestrians’ crossing behaviours differ based on how they view facilities and their inclination to take risks or comply with norms. The results suggest that improving the safety and security of overpasses might promote their usage. Furthermore, pedestrians who are aware of the potentially dangerous consequences of illegal crossings are less inclined towards unsafe behaviours. Raising awareness of the serious effects of risky behaviours could prompt pedestrians to choose safer alternatives. Rankavat and Tiwari (2016) highlighted the impact of surroundings on safety outcomes and the way these outcomes shape perceptions. According to situational action theory, a person’s behaviour is a function of personal factors and the controls against offending behaviour they encounter in specific situations and environments (Anderson & Love, 2024).
Pedestrian safety in India
Pedestrian safety is a major public health and urban planning concern in many rapidly urbanising cities across the Low and Middle Income Countries (LMIC). Cities in India face a disproportionate burden of pedestrian fatalities and injuries due to inadequate infrastructure, poor enforcement of traffic rules, and mixed traffic conditions. Among these cities, Bengaluru stands out as a critical case, with a high volume of daily pedestrian traffic and a growing number of pedestrian related incidents. Despite these challenges, the understanding of pedestrian safety in the Indian context, and in Bengaluru specifically, remain limited in both scope and depth. Since cultural influences have been reported to impact pedestrian behaviour (Nordfjærn & Şimşekoğlu, 2013), safety interventions for pedestrians in India may not be directly applicable as they often rely on research conducted in High Income Countries. Therefore, the best way to move forward is to thoroughly analyse the perspectives of road users using various methods and establish specific objectives to significantly enhance road safety. Understanding these connections, and how they may differ in various cultural settings, is crucial for guiding decision making processes for those designing interventions and making policies. This will ensure considering the most effective ways to improve the overall road safety system within the local context. Despite initiatives from government and authorities, the rates of pedestrian related fatalities and fines collected remain high.
In terms of urban traffic crashes on the road, almost half (46%) occur in ten cities (Bengaluru, Bhopal, Chennai, Delhi, Hyderabad, Indore, Jabalpur, Jaipur, Kochi and Malappuram). These ten locations represent the most frequent crash areas among the 50 ‘Million-Plus’ cities (those with populations over one million). In terms of fatalities, Delhi reported the highest number of deaths in 2022, followed by Bengaluru and Jaipur (MoRTH, 2022). Hence, examining the connection between views on traffic safety, perceptions of risk, and pedestrian actions among a set of road users in Bengaluru which is an important metro city in India with insufficient pedestrian infrastructure as the footpaths are frequently absent or blocked, crossings and signals are unsafe or insufficient, lighting and public amenities are lacking, and street design generally favouring vehicles over safe, continuous, and accessible pedestrian movement.
This study seeks to address that gap by investigating the interrelationships between pedestrian safety perception, traffic attitudes, and self-reported behaviours using data collected from a diverse group of city residents. By adopting a behavioural science perspective and applying factor analysis to identify underlying constructs, the study provides a nuanced understanding of pedestrian safety beyond surface level statistics.
The aim of the research was to examine the relationships between pedestrian safety perceptions, traffic safety attitudes, and self-reported behaviours among road users in Bengaluru. It is anticipated that people who have a more positive attitude about traffic safety are more likely to perceive it favourably and make safer pedestrian choices.
Theoretical framework
The Theory of Planned Behaviour (TPB) can be used to frame understanding the relationship between pedestrian behaviour, attitudes, and safety awareness (Ajzen, 1991). Recent studies consistently show that cognitive, normative, and control related psychosocial factors explain meaningful variance in self-reported and observed road user practices. For example, McIlroy et al. (2022) reported consistent relationships between traffic safety attitudes and pedestrian behaviours across multiple LMICs, while Oviedo-Trespalacios et al. (2021) highlighted the role of self-regulation and situational constraints in shaping risky pedestrian choices. Useche et al. (2021) showed that psychosocial predictors (attitudes, perceived norms, and perceived control) are robust correlates of risky road behaviour, supporting a TPB style causal chain in transport settings.
The measurement model used in this study is as follows:
-
Awareness is conceptualised as a cognitive antecedent (i.e., knowledge of traffic rules, infrastructure and safety information) that provides informational content shaping evaluative beliefs and attitudes toward safe crossing (informational component)
-
Attitude represents the evaluative component of TPB (evaluative judgement regarding compliance and safety-oriented behaviour) that is expected to predict behavioural intention and self-reported compliance (affective-evaluative component)
-
Perceived behavioural control / contextual constraint is proxied by items reflecting infrastructure and perceived ability to act safely which capture the extent to which the environment enables or constrains safe behaviour
-
Behaviour is the self-reported outcome of interest acknowledging that intentions may not always be enacted under low control conditions
Although Awareness and Attitude are moderately correlated, these constructs represent theoretically distinct domains within TPB, knowledge-based cognition versus evaluative predisposition. The distinction aligns with TPB’s separation of informational belief content from evaluative attitude formation.
Following are the empirically testable hypotheses for the Bengaluru context:
-
H1 (Awareness → Attitude): Higher pedestrian safety awareness is expected to be positively associated with more favourable attitudes toward safe pedestrian behaviour (supported by McIlroy et al., 2022)
-
H2 (Attitude → Behaviour): More favourable attitudes are expected to be associated with lower self-reported violations and errors
-
H3 (Mediation): Attitude is expected to partially mediate the relationship between awareness and self-reported behaviour (i.e., awareness → attitude → behaviour), consistent with TPB pathways and prior evidence (Useche et al., 2021)
-
H4 (Moderation by Perceived Control): The strength of the attitude → behaviour association is expected to be attenuated where perceived behavioural control is low (i.e., poor infrastructure or access), reflecting the “intention–behaviour gap” (documented by Oviedo-Trespalacios et al., 2021)
-
H5 (Sociodemographic differences): Age and occupation (e.g., students) are expected to moderate the relationship between attitudes and behaviour, with younger / student groups exhibiting higher reported violations conditional on similar levels of awareness (observed in prior LMIC research; McIlroy et al., 2022)
Given the exploratory design of this study and the use of Exploratory Factor Analysis (EFA) and correlational analyses, the present research does not test a full TPB structural model. Instead, it evaluates whether the observed factor structure and empirical associations are directionally consistent with TPB-aligned relationships. Formal mediation, moderation, and structural modelling remain directions for future confirmatory research.
Method
Measures
A survey questionnaire was developed based on the Pedestrian Behaviour Questionnaire (Deb et al., 2017). Three aspects were measured: positive behaviours; pedestrian awareness; violations and errors. Questions that included eight basic questions about demographic data (e.g., age, gender, income, occupation, number of vehicles owned at home), followed by eighteen questions about pedestrians’ perceptions of road safety (Perception Questionnaire: PQ1 to PQ18).
Participants rated their agreement with statements about behaviour that breaks the law or could be deemed unsafe. The six point Likert scale used by Deb et al. (2017) was modified to Likert scale of five points to include a neutral midpoint and to improve response clarity. The five-point response format demonstrated acceptable psychometric performance in the present sample, including adequate variance dispersion and stable factor loadings. These results suggest that the modification did not compromise scale integrity in this context. Nonetheless, future comparative studies may formally evaluate measurement invariance between the original six-point and adapted five-point formats.
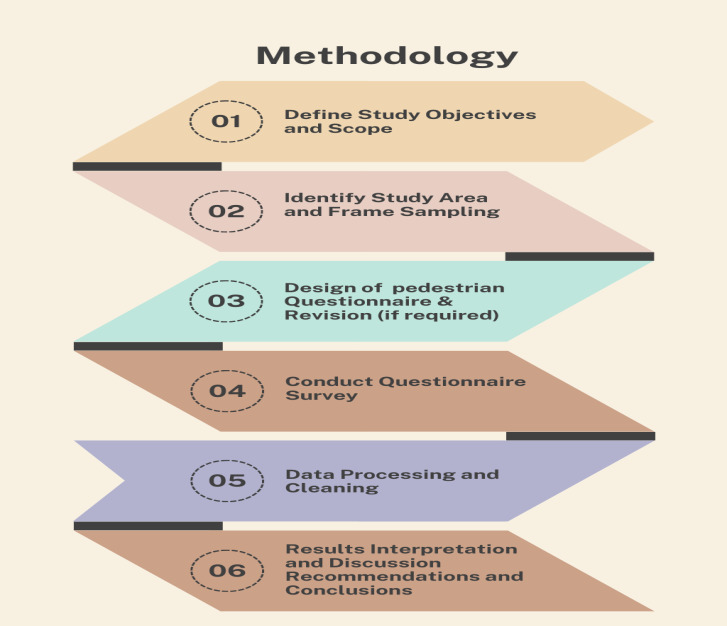
Preliminary inspection of item distributions indicated no severe skewness, kurtosis, or ceiling/floor effects, supporting the suitability of the five-point response format for subsequent factor analysis. A primary survey was carried out with approximately 20 individuals to ensure that all the questions in the questionnaire were clear to the respondents. Figure 1 shows the methodology adopted for the study.
According to 2011 Census, Bengaluru had a population of 9,621,551 (Male 5,022,661 and Female 4,598,890) (Source: https://censusindia.gov.in/). To determine the sample size for the study, two methods were applied: with a 95 percent confidence level and a 5 percent margin of error in Slovin’s formula, the sample size was 400. Also, by using Z-Score formula with same confidence level and a 0.5 percent margin of error, the sample size determined was 383. Both calculations were validated using an online sample size calculator (https://www.calculator.net/sample-size-calculator.html).
Conduction of Questionnaire Survey
Participants were a convenience sample recruited through interception. Research assistants approached people in various public locations such as institutions, bus stops, parks, commercial and residential areas, explained the purpose of the study, obtained consent to participate and handed the questionnaires to the participants and collected them upon completion. Some participants preferred that the research assistants conducted the survey as an interview and completed the questionnaire on the participants’ behalf. Participants were encouraged to ask the research assistants, for clarification as required during the survey. A total of 701 samples were obtained for the pedestrian road safety perception questionnaire. The data was filtered for irregularities such as repeated samples, incorrect data, and data mismatches. A final sample of 693 was used to analyse pedestrian road safety perceptions.
Characteristics of Participants
Table 1 summarises the characteristics of the 693 respondents. A substantial proportion of participants were students and younger adults (54.4%), reflecting a demographic segment frequently exposed to high pedestrian activity in Bengaluru. The sample includes a diversity of travel purposes and mode use patterns, providing relevant variability for examining pedestrian safety perceptions and behaviours.
Statistical analysis
Exploratory Factor Analysis (EFA) was conducted to identify the underlying dimensions that explain variation in pedestrian safety perceptions and behaviours. EFA was chosen over Confirmatory Factor Analysis (CFA) because the study aimed to explore latent behavioural constructs in a new cultural and infrastructural context rather than confirm an existing theoretical model. The suitability of the dataset for EFA was first verified using the Kaiser-Meyer-Olkin (KMO) measure of sampling adequacy and Bartlett’s Test of Sphericity. A KMO value above 0.80 indicated strong sampling adequacy, and a significant Bartlett’s test (p < .05) confirmed sufficient inter correlations among variables. The final sample size (n = 693) met established psychometric guidelines for EFA. With 18 items, this yielded a subject-to-item ratio of approximately 38:1, exceeding the recommended minimum of 10:1 for stable factor recovery (Costello & Osborne, 2005).
Given the strong KMO value 0.89 (>0.6), the dataset was adequately powered for factor extraction (Kaiser & Rice, 1974). Factor extraction was performed using the principal component extraction method with Varimax rotation, which enhances interpretability by maximising the variance explained by each factor. Items with factor loadings below 0.60 or high cross loadings were excluded to ensure conceptual clarity. The reliability analysis of questionnaire showed a good internal consistency with Cronbach’s alpha level of 0.755 (≥ 0.70 considered acceptable (Nunnally, 1978)). The final three-factor solution Violations and Errors, Pedestrian Awareness, and Positive Behaviour explained approximately 55 percent of the total variance, providing a coherent framework for interpreting pedestrian safety attitudes and behaviours in Bengaluru.
Results
In this section, the results of the statistical analysis are presented. Table 2 reports item means and standard deviations. Higher scores on several unsafe crossing items indicate variation in self-reported adherence to safe practices, while awareness related items showed moderate agreement. These descriptive scores provide context for interpretation of the latent dimensions identified through factor analysis.
A three-factor solution was extracted from the 18-item pedestrian perceptions questionnaire, accounting for half (55.20%) of the total variance (Table 3). Factor loadings below 0.60 were suppressed to enhance interpretability. Using the numbered statements as listed in Table 2, three items (PQ7, PQ10, PQ14) were excluded due to low or cross loadings. Items with the highest loadings on the first factor, representing violations and errors, included PQ11 (0.75), PQ8 (0.73), and PQ4 (0.73). The second factor, interpreted as pedestrian awareness, showed strong loadings for PQ1 (0.81), PQ2 (0.72), and PQ17 (0.71). The third factor contained items indicating positive behaviour, with PQ9 (0.60) demonstrating the lowest loading among retained items.
These results indicate that the extracted factors represent distinct dimensions of violations, awareness, and positive behaviour within pedestrian safety perceptions. The factor structure supports the multidimensional nature of pedestrian safety perceptions and provides a basis for subsequent reliability assessment and theory-based interpretation. The three retained factors explained 55.2 percent of the total variance, leaving 44.8 percent of residual variance unaccounted for. This unexplained variance may be due to contextual, infrastructural, or psychosocial influences not captured by the present instrument. As such, the identified factors should be interpreted as important correlates rather than comprehensive determinants of pedestrian behaviour.
Table 4 shows the reliability assessment summary which was evaluated using Cronbach’s α, McDonald’s ω (for factors with at least three indicators), and the Spearman-Brown coefficient (ρ), calculated from the average inter-item correlation. Across all indices, the Violations and Errors factor showed acceptable dependability (α = 0.74, ω = 0.75, ρ = 0.75). The pedestrian awareness factor showed modest internal consistency (α = 0.55, ω = 0.60, ρ = 0.58), suggesting that future study may enhance or expand the measurement of this construct. Cronbach’s α (0.662) and the Spearman-Brown coefficient (ρ = 0.662) both showed good reliability, however McDonald’s ω cannot be consistently computed for the two items that made up the positive behaviour component.
When combined, these findings indicate that the factor structure has sufficient internal consistency for exploratory analysis, but they also point to regions that need to be strengthened psychometrically in further confirmatory research. Examination of communalities revealed that all retained items achieved extraction values above 0.40, ranging from 0.41 (PQ13) to 0.65 (PQ1). These values suggest adequate shared variance among items and support the stability of the factor solution, given that communalities above 0.40 are typically considered acceptable for meaningful factor interpretation (MacCallum & Widaman, 1999; Costello & Osborne, 2005).
Discussion
The substantial correlation between awareness and behaviour identified in this study is comparable with findings from Vietnam (Dinh et al., 2020) and Turkey (Nordfjærn & Şimşekoğlu, 2013), where increased safety knowledge and risk perception were connected to more compliant pedestrian behaviours. In Bengaluru, numerous informal crossings and inadequate pedestrian facilities highlight a systematic adaptation to the limitations of the urban environment, rather than intentional rule breaking. Unlike in many cities in High Income Countries, where pedestrian violations are often viewed as unusual behaviour, such actions in Bengaluru often stem from necessity and established coping mechanisms in urban areas with rigorous regulations.
Further, our results suggest that attitudes and awareness continue to have an impact in Bengaluru even in the absence of robust enforcement or walkable infrastructure, which is in contrast to findings from high income countries where pedestrian infrastructure and traffic enforcement significantly reduce risk taking behaviour (McIlroy et al., 2020). This suggests that behavioural reactions may be shaped by culturally established attitudes about who is required to give way, driver behaviour and road sharing norms. These variations highlight how crucial it is to create regionally relevant interventions that take into consideration the lived reality of road users, particularly pedestrians given their vulnerability in rapidly urbanising cities, including in India.
The study’s main goal was construct exploration in a culturally and infrastructure-differentiated setting where the modified instrument had not been previously validated. Before pursuing confirmatory modelling, EFA was carried out as an initial exploratory approach to uncover latent dimensions in compliance with psychometric best practices. The structure confirmed here may be extended and validated in future research using CFA or Structural Equation Modelling (SEM).
The results of this study identify three reliable and interpretable dimensions underlying pedestrian safety perceptions and behaviours. The factor structure, reliability metrics, and shared variance provide a strong empirical basis for interpreting these constructs through behavioural theory. The following section discusses how these findings align with the TPB, previous studies, and potential implications for pedestrian safety management in urban contexts.
Interpretation of findings using the Theory of Planned Behaviour (TPB)
The findings of this study are broadly consistent with selected theoretical propositions of the TPB, providing an explanatory framework for understanding pedestrian safety behaviour in Bengaluru. However, the present cross-sectional and exploratory design does not permit causal or structural testing of the full TPB model.
The factor analytic results are broadly consistent with the hypothesised relationships among awareness, attitude, and self-reported behaviour. Consistent with H1, higher levels of pedestrian safety awareness were associated with more favourable attitudes toward safe crossing practices, suggesting that knowledge of traffic rules and risk perception strengthens positive behavioural evaluations. The positive link between favourable attitudes and lower self-reported violations (H2) further corroborates the TPB assertion that attitudes are significant predictors of behavioural intention and action. The observed correlations are directionally consistent with a potential mediation pathway (H3), although no formal mediation analysis was conducted and this remains a hypothesis for future testing. Similarly, moderation effects were not statistically tested using interaction modelling, and any moderation interpretation should therefore be viewed as exploratory and hypothesis-generating rather than confirmatory.
Awareness may indirectly relate to behaviour through attitudes consistent with findings reported by Useche et al. (2021). The weaker relationship between attitudes and behaviour among respondents reporting inadequate pedestrian infrastructure is directionally consistent with H4, implying that perceived behavioural control may play a role the translation of safe intentions into behaviour, as observed by Oviedo-Trespalacios et al. (2021). Finally, demographic differences, particularly higher risk taking tendencies among younger pedestrians and students, align with H5 and mirror patterns identified by McIlroy et al. (2022) across LMICs.
Collectively, these associations provide exploratory but contextually meaningful support for TPB-based mechanisms underlying pedestrian behaviour within the sampled urban population. While the extracted factors accounted for approximately half of the total variance, a notable portion of residual variance remains unexplained. This may stem from unmeasured contextual or psychosocial influences such as enforcement exposure, traffic density, or peer norms and emphasises that the identified dimensions represent key correlations rather than exhaustive determinants of pedestrian behaviour.
Policy and research implications
The TPB-consistent relationships identified here highlight several directions for future policy and intervention research. Rather than implying causality, the observed associations suggest that efforts to strengthen awareness and attitudes may indirectly promote safer pedestrian behaviour when paired with improvements in perceived behavioural control. Future studies could test whether structured safety education programs, community-based awareness campaigns, or school level interventions enhance positive attitudes and intention formation, thereby reducing unsafe crossing practices. Likewise, policy initiatives that enhance infrastructural support such as clearly demarcated crossings, pedestrian signals, and continuous footpaths could be evaluated for their effectiveness in bridging the intention-behaviour gap identified in this and similar situations. These directions underscore the need for integrated, behaviourally informed safety strategies, in which cognitive, social, and infrastructural levers are simultaneously addressed. Embedding such approaches within the TPB framework would enable a more systematic assessment of how behavioural determinants interact with environmental factors to influence pedestrian safety outcomes in cities like Bengaluru.
Limitations and future scope
This study offers initial empirical insights into pedestrian safety perceptions; however, several methodological constraints should be acknowledged. All data were obtained through self-reported responses at a single time point, which increases the potential for common method bias (CMB) and limits inference to associational not behavioural or safety performance relationships. Harman’s single-factor test indicated that the first unrotated factor accounted for 30.45 percent of the variance, remaining below the conventional 50 percent CMB threshold, and procedural safeguards (anonymous participation, neutral wording, and mixed item direction) were implemented. Nonetheless, residual CMB cannot be ruled out, and future work should incorporate observational, behavioural, or crash linked data to reduce shared method variance and strengthen causal inference.
While perceived behavioural control is conceptually central to TPB, the present instrument did not include multiple direct indicators of perceived behavioural control sufficient for reliable latent variable modelling. Instead, infrastructure-related items were interpreted as contextual proxies reflecting environmental constraint and perceived opportunity for safe action. Future research should incorporate dedicated multi-item perceived control scales to enable full structural modelling consistent with TPB.
The factor structure identified through EFA requires confirmatory validation. Future research should employ CFA or SEM to evaluate model fit, test mediating pathways (e.g., the role of attitudes between awareness and behaviour), and assess construct reliability and generalisability. SEM would further allow examination of how pedestrian knowledge, rule awareness, and infrastructural accessibility jointly influence risky behaviours and perceived safety outcomes. Complementary objective data sources such as GPS trajectories, video/CCTV analytics, or site based behavioural audits at intersections would permit triangulation of self-reported tendencies with observed actions. Integrating subjective and objective measurements may help identify sub location level safety risks and inform proactive detection of emerging trauma hotspots, supporting evidence-based prioritisation of road safety resources in rapidly urbanising environments.
Approximately half of the respondents were students. While this demographic concentration may limit full representativeness of all age and occupational groups within Bengaluru, it also captures a segment that is disproportionately exposed to daily pedestrian travel and often overrepresented in traffic risk statistics in LMICs. As such, the findings provide particularly relevant insights into youth-dominated pedestrian environments, including educational campuses and surrounding corridors. Nonetheless, broader city-wide generalisations should be made cautiously, and future studies employing stratified sampling or post-stratification weighting would help enhance population-level inference.
Overall, subsequent research should adopt mixed methods and multi-source designs, combining self-report surveys with observational and crash based data, and progress from exploratory modelling toward confirmatory and predictive frameworks capable of supporting robust, policy relevant evaluation of pedestrian safety interventions.
Conclusion
In the absence of continuous footpaths, marked crossings, or strict enforcement, pedestrians often adopt unsafe behaviours out of necessity rather than recklessness. Assumptions that motorists will yield are culturally embedded but risky, especially in high traffic conditions. These contextual differences suggest that “violations” in this setting often due to system induced adaptations, underscoring the need for localised behaviour models and targeted interventions. The EFA underscores the significance of both unsafe pedestrian behaviours and knowledge of traffic rules in understanding pedestrian safety. Items with high factor loadings indicate that participants are generally aware of pedestrian safety guidelines but may engage in unsafe behaviours due to convenience, distractions, or a lack of attention. Future interventions should focus on reducing unsafe crossing behaviours and promoting the use of pedestrian infrastructure to enhance overall safety.
This study examined the interrelationships among awareness, attitudes, and self-reported pedestrian behaviour using an exploratory, TPB informed framework in Bengaluru, India. Three latent dimensions were identified that reflect both cognitive and behavioural facets of pedestrian safety. The observed associations suggest that awareness and attitudes are interlinked and may jointly influence behaviour, although these relationships remain correlational rather than causal. Hence, the findings should be interpreted as indicative associations rather than causal predictors. By grounding the analysis in an established behavioural theory, this study provides a foundation for future confirmatory and applied research on pedestrian safety in cities in LMICs. The findings highlight the importance of integrating educational, behavioural, and infrastructural strategies within a unified framework that acknowledges cognitive, contextual, and environmental constraints. Future studies employing mixed methods and objective behavioural measures will be essential to validate these pathways and inform evidence-based safety interventions.
The results provide an empirical basis for formulating testable hypotheses rather than direct policy recommendations. For example, the positive association between awareness and attitudes may indicate that structured educational interventions such as targeted pedestrian safety campaigns could improve attitudes toward safe crossing behaviour (Hypothesis 1: Awareness interventions improve safety attitudes). Similarly, the moderating role of perceived behavioural control suggests that improvements in the walking environment (e.g., safe crossings, signalised intersections) could strengthen the translation of positive attitudes into safe behaviour (Hypothesis 2: Infrastructure enhancement strengthens the attitude behaviour link). Future studies should evaluate these hypotheses using multi method and longitudinal designs, integrating observational or crash data with self-reported measures to validate causal mechanisms. Policymakers and practitioners can use these exploratory insights as a starting point to design and test interventions empirically, ensuring that behavioural and infrastructural components are jointly assessed for effectiveness. Framing recommendations as avenues for future evaluation, rather than immediate policy prescriptions, represents the current evidence base and aligns with good scientific practice in exploratory behavioural research.
AI tools
The authors used ChatGPT (ChatGPT Go, version GPT-5.3) to assist with English language expression and clarity. The tool was used solely for linguistic refinement; all research design, analysis, and interpretations are the authors’ original work.
Acknowledgements
We thank JSS Academy of Technical Education Bengaluru, Karnataka, India and National Institute of Technology Warangal, Telangana, India for the support throughout the study.
Author contributions
Basavaraj Akki contributed to the study’s conceptualisation, literature review, data collection, data analysis, and manuscript writing. K. V. R Ravi Shankar provided supervised the research, provided expertise for the study, conducted evaluations, conducted critical revisions, and approved the final version of the manuscript.
Funding
This research did not receive any specific grant from funding agencies in the public, commercial, or not-for-profit sectors.
Human research ethics review
The study was conducted in accordance with the Declaration of Helsinki, and the protocol was approved by the Doctoral Scrutiny Committee (DSC) of National Institute of Technology, Warangal, India on 4th January 2023 with Project ID 712041. All participants gave informed consent before participating in the study.
Data availability statement
The data supporting this study’s results can be made available upon reasonable request from the corresponding author. Due to confidentiality and privacy considerations, the datasets are not publicly accessible.
Conflicts of interest
The authors declare there are no conflicts of interest.