Introduction
Pedestrian crosswalks are an important part of urban traffic safety infrastructure in high-risk areas like school zones. However, having physical infrastructure like designated crossings and signs does not always mean that pedestrians are safe. This is especially true in settings where enforcement is limited or absent and where behavioural interventions are not implemented. According to the World Health Organization (WHO, 2018), pedestrians are approximately a quarter of all fatalities on the road globally, with the burden disproportionately high in low- and middle-income countries (LMICs), including Thailand.
In the past decade, Thailand has reported more than 6,700 pedestrian fatalities at crosswalks, with an average of nearly two deaths per day. More than 100 of these fatalities each year involve school-aged children, underscoring the vulnerability of young pedestrians in traffic environments (IDCC, 2021; TDRI, 2024). At the same time, vehicle speeds in urban environments remain above the 30 km/h level recommended by the WHO for pedestrian-priority areas, despite recent initiatives to reduce urban speed limits to 60 km/h (WHO, 2018). Speed remains a major risk factor, as higher vehicle impact speeds are consistently associated with greater injury severity and fatality risk (Elvik et al., 2004).
Consequently, understanding the effectiveness of practical interventions to directly address these primary risk factors is of critical importance. This study examined the behavioural impact of numerous traffic control interventions, both individually and in combination, on motorist yielding behaviour at school zone crosswalks, using field-based observational data under real-world conditions. Motorist yielding behaviour was defined as coming to complete stop. All drivers who did not stop, including those who slowed, were classified as non-yielding. The specific aim was to determine which measures are most effective in reducing vehicle speeds and increasing yielding rates. The findings are intended to contribute new knowledge that directly supports the prevention of severe injuries and fatalities from road traffic crashes.
Literature review
Previous studies have provided important insights into the effects of enforcement strategies, infrastructure improvements, pedestrian and driver behaviour at crossings, and speed management (Anciaes et al., 2020; Chaudhari et al., 2019; Jevremović et al., 2019; Oxley et al., 2005; Pawar & Patil, 2015, 2016; Pechteep et al., 2024; Rothman et al., 2022; Sun et al., 2015; Tankasem et al., 2019, 2022; Zegeer et al., 2001). Nevertheless, a notable research gap remains regarding the comparative and cumulative effects of different traffic control measures at school-zone crosswalks, particularly under real-world conditions. Pedestrian crossings are a critical component of school-zone safety because they are intended to protect children, who are especially vulnerable to traffic injury. Despite this protective function, pedestrian fatalities remain disproportionately high in many LMICs, where safety risks are often compounded by deficiencies in infrastructure, weak enforcement, and unsafe driver behaviour (Hanan, 2019; Injury Data Collaboration Center (IDCC), 2021; Raoniar & Perumal, 2025; Thailand Development Research Institute (TDRI), 2024; World Health Organization (WHO), 2018; Zegeer et al., 2001).
Studies of pedestrian crossings have consistently shown that driver yielding behaviour is shaped by a combination of vehicle speed, pedestrian presence, gap acceptance, roadway context, and the visibility of traffic control measures. Higher approach speeds reduce the likelihood of yielding and increase the severity of pedestrian injury outcomes, while visible enforcement and targeted crosswalk treatments can improve compliance. Evidence from Thailand and LMICs contexts further suggests that infrastructure alone is often insufficient unless supported by speed management (e.g., traffic calming), enforcement, or behavioural cues (Hanan, 2019; Hidayati et al., 2012; Jevremović et al., 2019; Raoniar & Perumal, 2025; Tankasem et al., 2019, 2022; Zegeer et al., 2001).
Previous studies suggest that visible monitoring, police presence, and automated speed-control systems may influence road-user behaviour by increasing the salience of regulation and the perceived likelihood of detection or sanction (Anciaes et al., 2020; Jevremović et al., 2019; Pechteep et al., 2024; Rothman et al., 2022; Tankasem et al., 2019, 2022; Zhuang & Wu, 2014). Accordingly, the present study is interpreted primarily through a compliance- and deterrence-oriented perspective. Although broader behavioural theories such as the Theory of Planned Behaviour (TPB; Ajzen, 1991) may provide useful background context, the present study does not directly measure TPB constructs and therefore does not treat that framework as its primary explanatory model. Eight key research themes were identified in the evidence that had direct relevance to pedestrian safety at school-zone crosswalks.
Pedestrian safety margins and gap acceptance
Pedestrian safety margin (PSM) decreases significantly under rolling behaviour; group pedestrians accept shorter temporal gaps (2.5- 3.2 seconds) (Anciaes et al., 2020; Chaudhari et al., 2019; Pawar & Patil, 2015).
Critical gaps and speed perceptions
Critical gaps were identified as 3.2-4.1 seconds. Pedestrians underestimate speeds by 15-25% when exceeding 45 km/h (Pawar & Patil, 2015, 2016; Sun et al., 2015; Transportation Research Board, 2010).
Enforcement and Driver Yielding Behaviour
Smart infrastructure increased driver yielding from 31.8 to 74.1% in Thailand; gestures tripled yielding rates; visibility measures improved compliance (Anciaes et al., 2020; Pechteep et al., 2024; Rothman et al., 2022; Zhuang & Wu, 2014).
Speeding and Traffic Management in School Zones
28.6% speed limit violations in school zones; interventions based on the Internet of Things reduced speeds by 18% (Adeyemi et al., 2021; Hanan, 2019; Jevremović et al., 2019; Raoniar & Perumal, 2025).
Pedestrian Behaviour and Risk Perception
Older adults misjudge crossing gaps; pedestrian gestures increase yielding rates; spatial design affects risk perception (Kaparias et al., 2012; Olszewski et al., 2015; Oxley et al., 2005; Sun et al., 2015; Zhang et al., 2017).
Child-Specific Vulnerabilities and Behavioural Training
Behavioural training improved children’s safe crossing behaviour by 37%, though effects diminished without reinforcement (Rothman et al., 2022).
Infrastructure Design and Smart Technologies
Smart signage reduced vehicle speeds by 18%; crosswalks alone are insufficient without traffic-calming measures (Jevremović et al., 2019; Zegeer et al., 2001).
Behavioural Compliance and Monitoring
Visible monitoring and automated speed enforcement can reduce speeding and improve rule compliance by increasing drivers’ awareness of surveillance and potential sanctions. These studies support the relevance of external monitoring cues in shaping road-user behaviour, although they do not by themselves constitute a direct test of latent psychological constructs (Tankasem et al., 2019, 2022).
However, relatively few field-based studies have compared multiple intervention scenarios within the same school-zone crossing under naturalistic conditions. In particular, limited evidence exists on the relative and combined effects of visible monitoring, police enforcement, and bundled low-cost control strategies on both yielding behaviour and approach speed. This gap is important because school-zone crossings are highly dynamic environments in which child pedestrians, motorcycles, and mixed traffic interact under variable levels of regulatory control.
Method
Study Site and Population
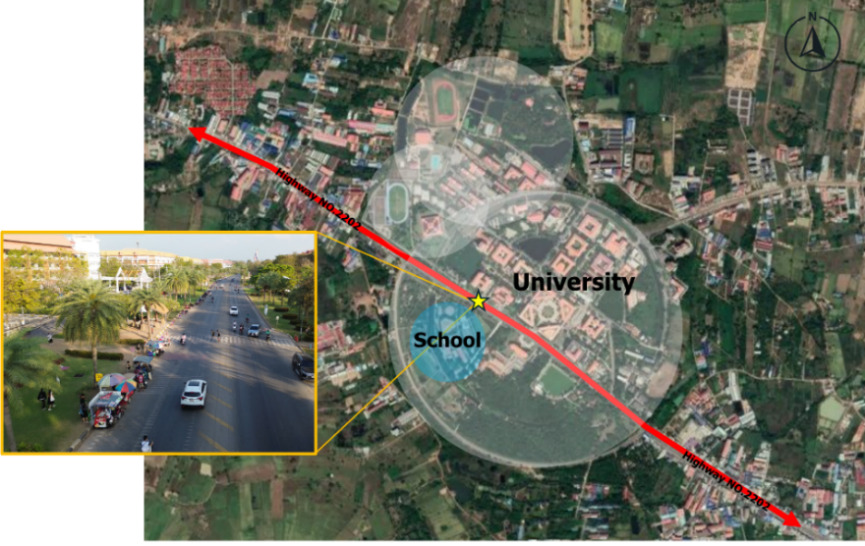
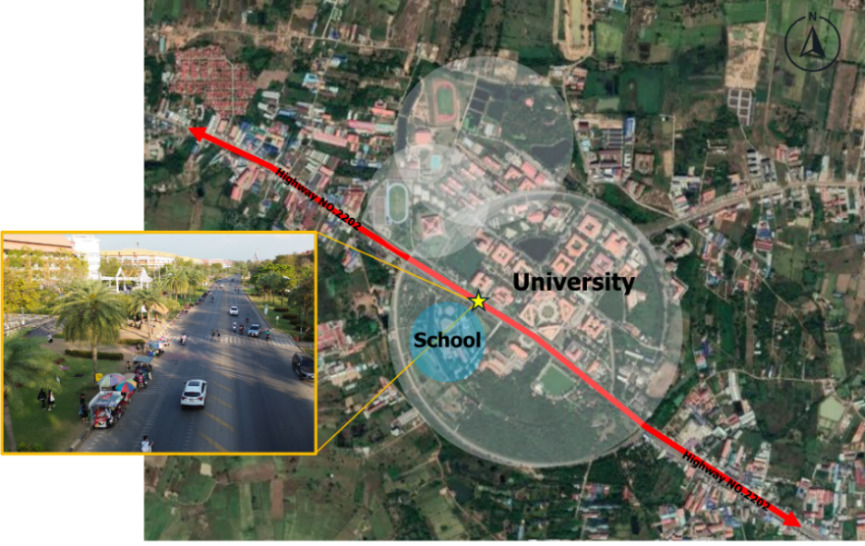
The study site was a marked school-zone crosswalk in Mahasarakham, Thailand, located in front of a secondary school and adjacent to a university precinct along a four-lane undivided collector road (Figure 1). The posted speed limit at the site was 30 km/h. Surrounding land use was predominantly educational and community-based, generating concentrated pedestrian activity during school arrival and dismissal periods. The school serves approximately 2,880 students, and the crosswalk lacked pedestrian signal control, traffic calming and a central median at the time of observation. Routine traffic enforcement at the site was limited outside the designated intervention periods, making the location suitable for evaluating the behavioural effects of visible monitoring and enforcement under real-world conditions.
Observational data indicated an average pedestrian volume of 170 persons per hour during peak times, with students comprising 95 percent. During off-peak periods, pedestrian volume averaged 50 persons per hour (67% students, 33% adults). Vehicle flow during peak hours averaged 2,250 vehicles per hour, consisting of motorcycles (57%), passenger cars (42%) and other types of vehicles (1%). During off-peak periods, vehicle volume dropped to 1,126 vehicles per hour, with a higher proportion of passenger cars (53%) relative to motorcycles (46%). The combination of high pedestrian volume, mixed traffic composition, and the absence of signal control made this site an ideal setting for systematic field observations under various intervention scenarios.
Observation Protocol and Intervention Tools
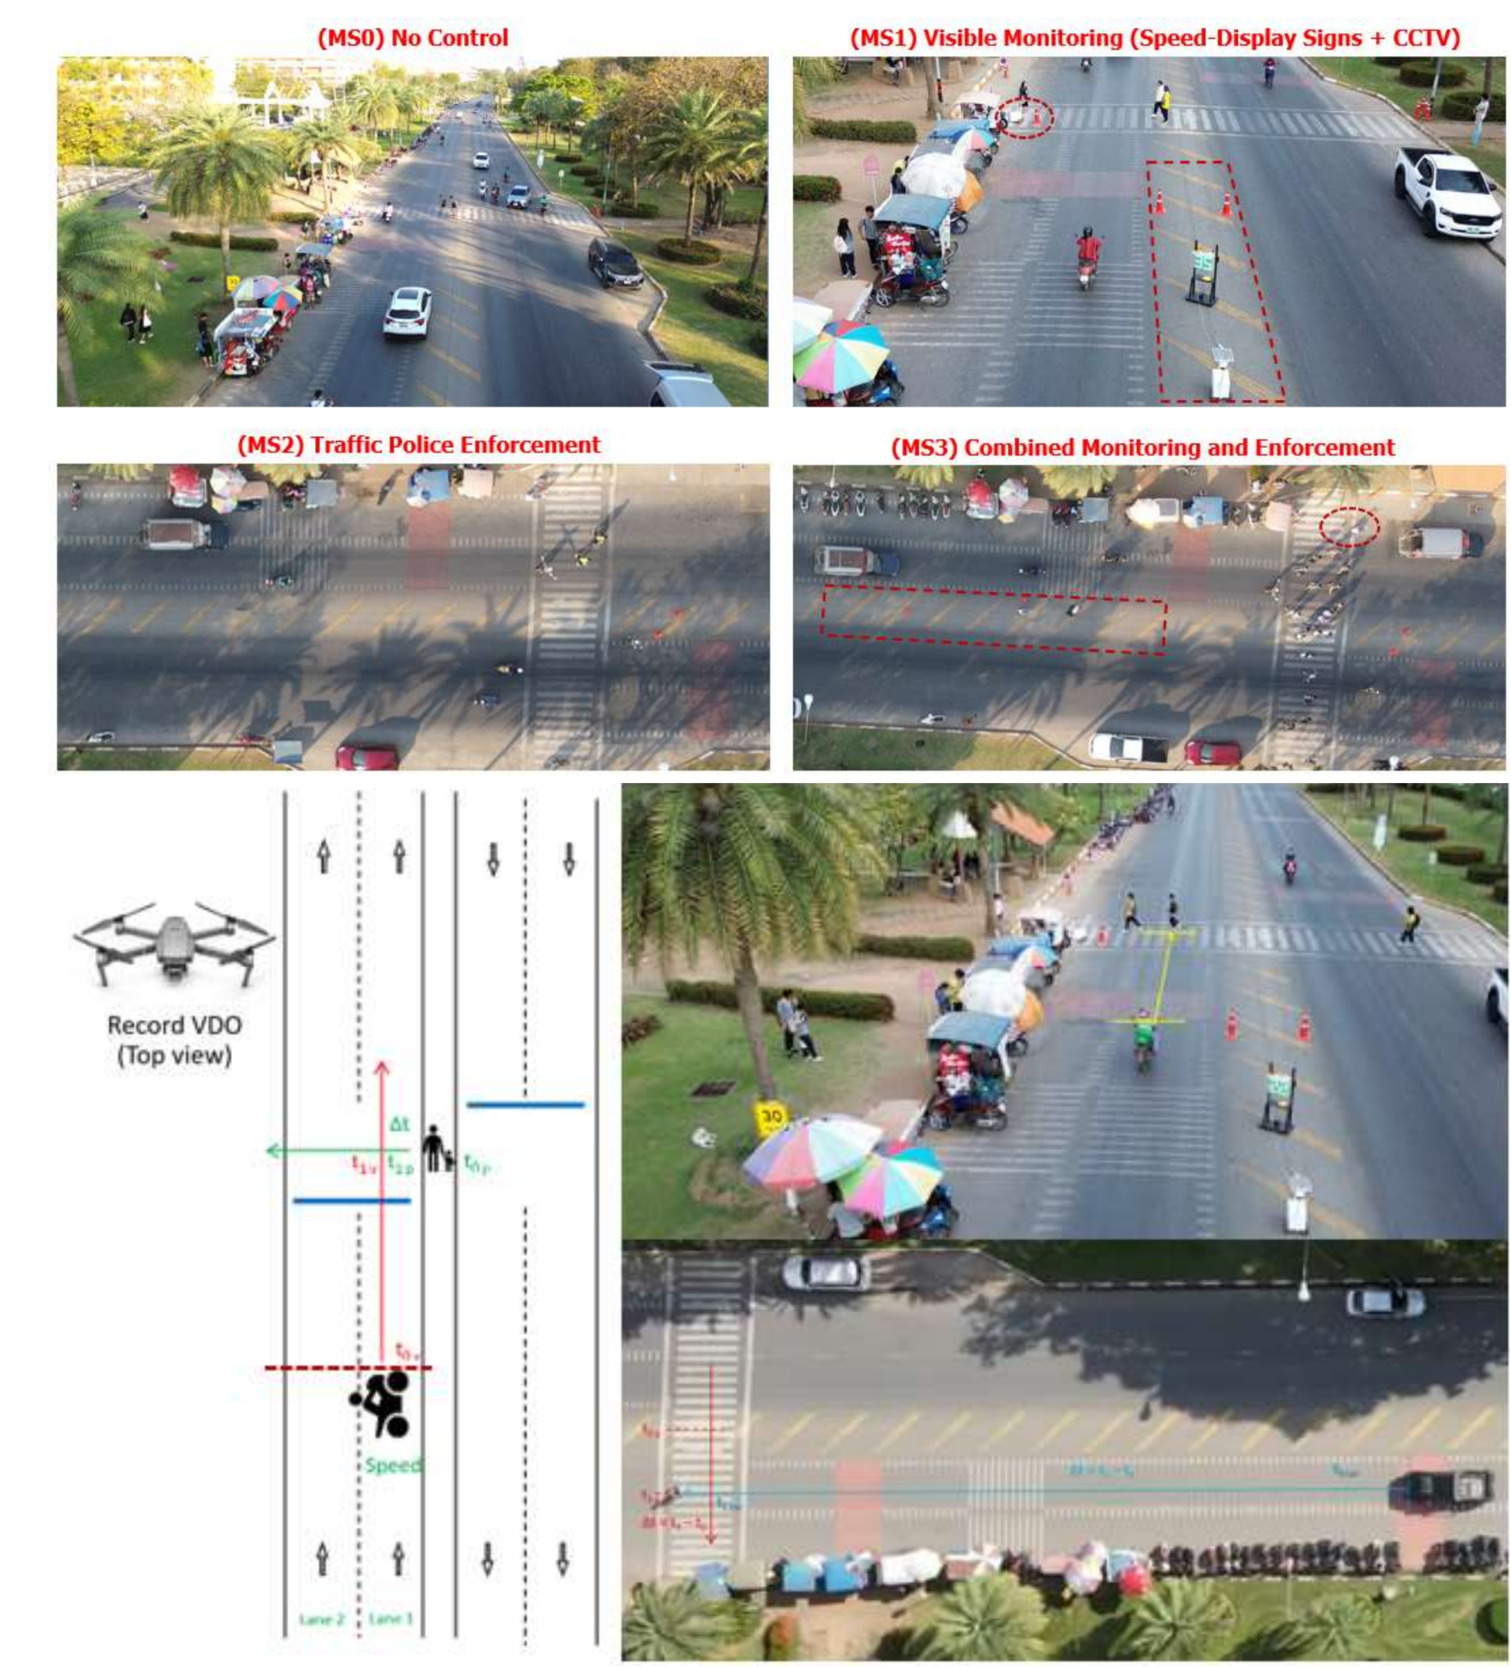
This study employed a field-based observational design to examine pedestrian-vehicle interactions at a school-zone crosswalk under four traffic control scenarios, as shown in Figure 2 (top): (MS0) no control, (MS1) visible monitoring through speed-display signs and CCTV, (MS2) traffic police enforcement, and (MS3) a combined monitoring-and-enforcement condition. Each scenario represented a distinct set of regulatory cues intended to influence road-user behaviour under real-world conditions. Observations were conducted during weekday morning and afternoon periods and included both peak and off-peak traffic conditions to capture variation in pedestrian and vehicle activity at the study site. Across the study, a total of 16 hours of observational data were collected across all study conditions.
In scenarios involving technological interventions, two primary devices were used: closed-circuit television (CCTV) and speed-display signs (Your Speed). Both were positioned in highly visible locations to increase road users’ awareness of monitoring and to provide immediate speed-related feedback. The CCTV units were mounted on mobile steel-frame carts, allowing temporary deployment without permanent installation, while the radar-equipped speed-display signs detected and displayed approaching vehicle speeds in real time. In this study, these devices are interpreted as external monitoring and feedback cues rather than as direct measures of individual psychological constructs.
The speed-display sign and CCTV were treated as a bundled visible monitoring condition because, in practice, they were deployed together as a single low-cost regulatory package intended to increase monitoring salience and provide immediate speed-related feedback. The purpose of this condition was not to isolate the independent effect of each device, but to evaluate the behavioural impact of a realistic monitoring strategy that could be implemented by local agencies without permanent signalisation or full-time police presence.
A non-intrusive observation approach was adopted to preserve naturalistic behaviour. Behavioural data were collected using aerial video footage captured by an unmanned aerial vehicle (UAV or drone), which provided a clear top-down view of pedestrian crossings and approaching vehicles. This allowed precise synchronisation of pedestrian position and vehicle movement during each interaction event. The recorded footage was subsequently coded to extract behavioural variables consistently across all intervention scenarios, including vehicle speed, pedestrian volume, pedestrian crossing speed, pedestrian-vehicle gap distance, driver response behaviour, and vehicle type.
Behavioural variables and data extraction
Behavioural data were collected through systematic field observations using aerial video footage captured by a remotely piloted aerial vehicle (i.e., drone). The drone was positioned to obtain a clear top-down view of the pedestrian crossing area, allowing precise synchronisation between the position of pedestrians crossing and the movement of oncoming vehicles. As illustrated in Figure 2 (bottom), data collection focused on key behavioural variables across all intervention scenarios, including: Vehicle speed as the vehicle approaches the crosswalk (km/h), Number of pedestrians crossing, Distance between the vehicle and pedestrian at the point of interaction (metres), Pedestrian crossing speed (metres/second), Driver response behaviour: whether the vehicle stopped or continued while pedestrians were crossing, and Vehicle type (private car or motorcycle). This approach allowed for consistent data extraction using frame-by-frame video analysis and timing markers (e.g., t0, t1, t0car, and t1car) to calculate speeds, distances, and time gaps. These behavioural indicators were used to assess the effectiveness of each traffic control intervention in real-world school zone conditions.
_and_drone-based_observation_of_pedestria.png)
Sample Size
The sample for this study comprised both drivers and pedestrians who interacted with the marked crosswalk at the study site. The preliminary estimation of sample size was based on observational traffic analysis principles (Roess et al., 2011; Transportation Research Board, 2010), using the average number of pedestrian crossings per hour during each observation period. Using a total observation duration of 16 hours across the study, the estimated number of observed pedestrian events was no less than 880, which is sufficient for inferential statistical analysis (Borucka, 2020; Schonlau, 2023). The 16-hour observation window was designed to capture repeated pedestrian-vehicle interactions across both higher- and lower-demand periods within the school-zone environment, while remaining feasible for controlled deployment of temporary interventions. Although longer observation periods would improve temporal representativeness, the selected duration was sufficient to generate valid interaction events for inferential analysis and cross-scenario comparison. However, this study further included paired observations of driver behaviour in response to pedestrian crossings. As a result, the final sample consisted of 1,646 valid cases, each representing an interaction event involving vehicle approach and pedestrian crossing under one of the four control scenarios.
Statistical Analysis
Data were analysed using both descriptive and inferential statistical methods in SPSS to evaluate the impact of each traffic control scenario on driver yielding behaviour. Descriptive statistics summarised key characteristics of the dataset, including means, standard deviations, and frequency distributions. To examine associations between driver yielding behaviour and categorical variables, Pearson’s Chi-square test was applied. Variables showing statistical significance (p < 0.05) were subsequently included in a binary logistic regression model to assess their predictive influence on yielding behaviour. For continuous variables, including vehicle speed, gap distance, pedestrian volume, and crossing speed, the Mann-Whitney U test was employed to compare distributions between yielding and non-yielding groups due to the non-normality of data (Gibbons & Chakraborti, 2011; McKnight & Najab, 2010). Binary logistic regression was then used to estimate the likelihood of driver non-yielding behaviour, with results expressed as odds ratios (ORs) and 95 percent confidence intervals (CIs). The logistic function is defined in Equation (1), and the general model structure is presented in Equation (2). Statistical significance was determined at the p < 0.05 level (Borucka, 2020; Schonlau, 2023).
f(x)=ex1+ex
Where: e is Euler’s number, and x is a linear combination of predictors.
P(event of Y)=eβ0+β1X1+⋯+βnXn1+eβ0+β1X1+⋯+βnXn
Where: P(Y) is probability of the event occurring, Y is the dependent variable, X1…Xn are independent variables, β0 is intercept, β1… βn are the logistic regression coefficients associated with each independent variable. The definitions of variables used in the logistic regression analyses are summarised in Table 1.
Two logistic regression analyses were conducted. First, a binary logistic regression model was used to estimate the effects of traffic control scenarios on yielding behaviour, with the no-control condition (MS0) treated as the reference category. Second, a separate multivariable logistic regression model was estimated to examine the associations between yielding behaviour and key behavioural and traffic-related variables, including vehicle type, vehicle speed, pedestrian-vehicle gap distance, pedestrian volume, and pedestrian crossing speed. A yielding event was coded only when the approaching vehicle came to a complete stop to allow the pedestrian to cross; vehicles that merely slowed down without stopping were coded as non-yielding.
Results
Descriptive Statistics: Speed and Yielding Behaviour
Table 2 summarises mean vehicle speed and yielding behaviour across the four traffic control scenarios, stratified by vehicle type. Scenario MS0 (No control) showed the highest speeds and lowest yielding rates, particularly among motorcycles (20.13%). By contrast, Scenario MS3 (Combined monitoring and enforcement) showed the strongest improvement, with mean speed reduced to 28.28 km/h and yielding rates rising to 84.38 percent for cars and 70.82 percent for motorcycles. Intermediate improvements were observed under MS1 (Visible monitoring) and MS2 (Traffic police enforcement). Overall, combined measures outperformed single interventions, particularly for car drivers, highlighting the value of integrating monitoring and enforcement cues to promote pedestrian safety.
Behaviour Inferential Comparison Between Yielding Groups
Inferential comparisons indicated significant associations between driver yielding behaviour and categorical variables, including traffic control scenario, vehicle type, and group crossing (all p < 0.001). For continuous variables, vehicle speed, pedestrian–vehicle gap distance, and pedestrian volume differed significantly between yielding and non-yielding groups (all p < 0.001). Pedestrian crossing speed did not differ significantly in the bivariate comparison but became significant in the adjusted multivariable logistic regression model, suggesting that its effect may be context-dependent and influenced by other interaction variables.
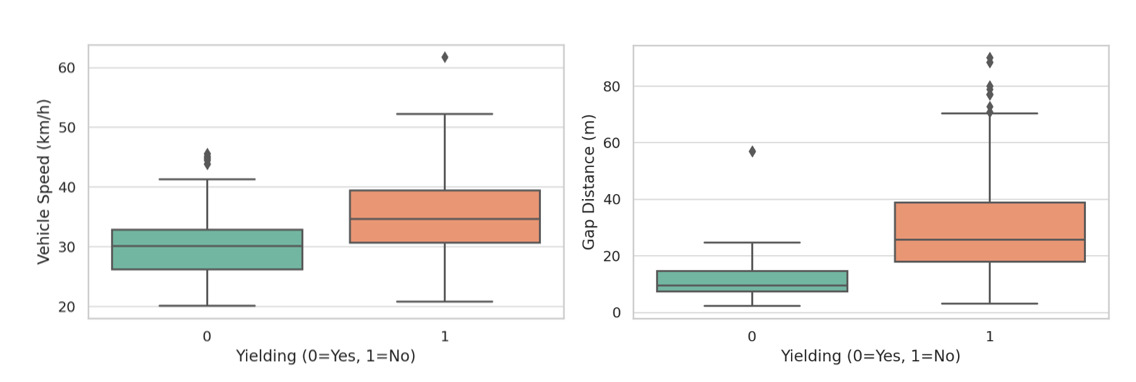
Figure 3 presents the distributions of two key behavioural indicators, vehicle speed and gap distance, categorised by driver yielding behaviour (0 = Yielded, 1 = Did not yield). On the left, the boxplot shows that non-yielding drivers approached the crosswalk at substantially higher speeds than those who yielded. The median speed for non-yielding drivers was clearly higher, and the broader interquartile range indicates more variability in speed. This pattern is consistent with the bivariate inferential comparison, in which vehicle speed differed significantly between the yielding and non-yielding groups (U = 90.65, p < 0.001). On the right, gap distances between vehicles and pedestrians were markedly longer for non-yielding drivers. In contrast, yielding behaviour was associated with closer spatial proximity at the point of interaction. This finding is also supported by the bivariate comparison, which showed a significant difference in pedestrian–vehicle gap distance between the two groups (U = 41.09, p < 0.001). Together, these results highlight the critical influence of physical dynamics, particularly approach speed and pedestrian-vehicle proximity, on driver decision-making at pedestrian crossings. Higher speeds and longer distances were both associated with a reduced likelihood of yielding, underscoring their relevance in the design of effective safety interventions.
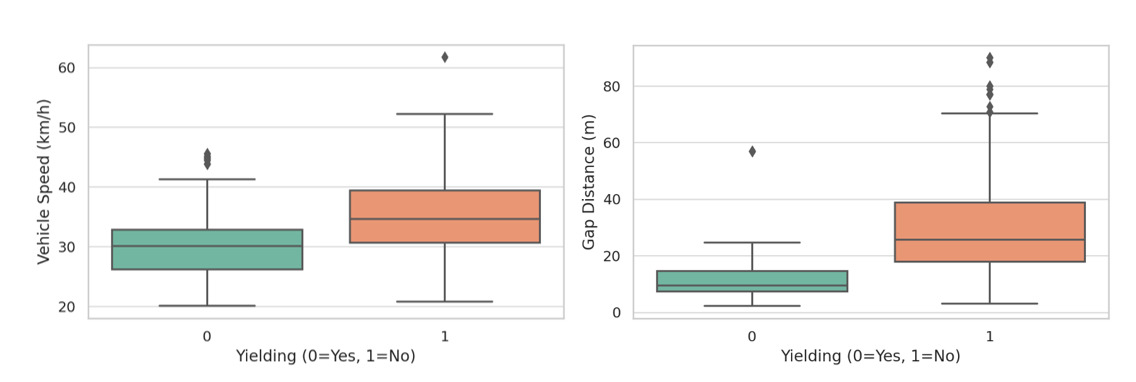
Effects of Traffic Control Measures on Yielding Behaviour
Table 3 presents the binary logistic regression results estimating the effects of traffic control scenarios on non-yielding behaviour, with the no-control condition used as the reference category. All intervention scenarios were associated with significantly lower odds of non-yielding. Visible monitoring reduced the odds of non-yielding by 68.6 percent (OR = 0.31, 95% CI = 0.22-0.43, p < 0.001), traffic police enforcement reduced the odds by 62.6 percent (OR = 0.37, 95% CI = 0.27-0.53, p < 0.001), and the combined monitoring-and-enforcement scenario showed the strongest effect, reducing the odds of non-yielding by 81.3 percent (OR = 0.19, 95% CI = 0.13-0.27, p < 0.001).
Table 4 presents a separate multivariable logistic regression model examining vehicle- and pedestrian-related predictors of non-yielding behaviour, excluding traffic control scenario (MS). Vehicle speed (OR = 1.15, 95% CI = 1.12-1.19, p < 0.001) and vehicle-pedestrian gap distance (OR = 1.20, 95% CI = 1.17-1.23, p < 0.001) were positively associated with non-yielding. Pedestrian volume was negatively associated with non-yielding (OR = 0.81, 95% CI = 0.73-0.88, p < 0.001), whereas pedestrian crossing speed showed a modest positive association (OR = 1.29, 95% CI = 1.01-1.64, p = 0.04). Vehicle type was not statistically significant (OR = 0.84, 95% CI = 0.60-1.18, p = 0.31). The model demonstrated good fit and predictive ability (LR χ² = 719.12, p < 0.001; McFadden’s pseudo R² = 0.45; accuracy = 82.4%; AUC = 0.912).
Discussion
This field study shows that pairing visible monitoring (Radar speed-display signs and CCTV) with visible enforcement delivers the greatest safety gains at a school-zone crosswalk, increasing yielding behaviour (from 24.9% to 71.7%) and reducing mean approach speed (from 37.5 km/h to 28.3 km/h). These twin effects are particularly important because pedestrian injury severity rises sharply as impact speed increases, and speed management remains one of the most effective tools for reducing crash harm (Elvik et al., 2004). In this respect, the present findings support the broader road-safety literature showing that interventions capable of simultaneously lowering approach speed and increasing driver compliance offer the strongest protection for pedestrians in conflict-prone environments.
The present findings are also broadly consistent with previous studies on driver yielding behaviour at unsignalised or uncontrolled crossings. Anciaes et al. (2020) showed that driver yielding behaviour is influenced by contextual and behavioural factors rather than by a single design element alone, while Pechteep et al. (2024) similarly reported that traffic and pedestrian characteristics significantly influence yielding behaviour at urban midblock crosswalks in Thailand. In our study, yielding was more likely under lower approach speeds and shorter pedestrian-vehicle gap distances, reinforcing the interpretation that conflict immediacy plays a central role in drivers’ stopping decisions. This pattern is also compatible with studies from India and other mixed-traffic settings showing that pedestrian safety margins are strongly affected by interaction timing, traffic composition, and driver response under unsignalised conditions (Chaudhari et al., 2019; Pawar & Patil, 2015, 2016).
The intervention-specific analysis showed that all three traffic-control scenarios significantly improved compliance relative to the no-control condition, with the combined monitoring-and-enforcement treatment producing the strongest effect. This finding is stronger than the more modest improvements typically reported for single interventions such as visible speed feedback or environmental school-zone treatments alone (Jevremović et al., 2019; Rothman et al., 2022). It therefore suggests that visible monitoring and enforcement may operate synergistically rather than merely additively when deployed together in a live school-zone environment. In practical terms, the combined presence of speed feedback, CCTV surveillance, and traffic police may have increased both monitoring salience and enforcement credibility, thereby producing a stronger compliance response than any single cue alone.
Descriptively, motorcycle riders were less compliant than car drivers across the observed scenarios, consistent with evidence that two-wheeler users may exhibit lower compliance with right-of-way rules in mixed-traffic environments (Hanan, 2019; Raoniar & Perumal, 2025). However, vehicle type was not statistically significant in the adjusted multivariable model, suggesting that the observed differences between motorcycle riders and car drivers may be partly explained by interaction dynamics such as speed and pedestrian-vehicle gap distance rather than reflecting an independent effect of behaviour by vehicle type.
The separate multivariable model further clarifies the role of behavioural and traffic-related predictors. Higher vehicle speeds and longer pedestrian-vehicle gap distances were associated with greater odds of non-yielding behaviour, which is consistent with prior work showing that faster vehicles and larger available gaps can reduce the perceived urgency to stop (Pawar & Patil, 2015; Sun et al., 2015). By contrast, higher pedestrian volumes were associated with lower odds of non-yielding behaviour, suggesting that larger pedestrian groups may increase the salience of pedestrian priority and make non-compliance more socially and operationally difficult. This interpretation is consistent with studies showing that pedestrian conspicuity and collective crossing behaviour can influence driver response at uncontrolled crossings (Kaparias et al., 2012; Zhuang & Wu, 2014).
Pedestrian crossing speed also emerged as a significant predictor in the adjusted model, with faster pedestrian crossing speeds associated with greater odds of non-yielding behaviour. One plausible interpretation is that drivers or riders may perceive faster-moving pedestrians as more likely to clear the conflict zone quickly, thereby reducing the perceived need to stop completely. Although this mechanism cannot be directly confirmed from the present observational design, it is consistent with the broader view that road users assess interaction timing, vehicle speed, gap distance, and clearance opportunity when negotiating pedestrian-vehicle conflicts (Oxley et al., 2005; Sun et al., 2015). The significance of pedestrian crossing speed only after multivariable adjustment also suggests that its effect may be context-dependent and intertwined with other interaction variables.
From a compliance- and deterrence-oriented perspective, these results are consistent with the idea that conspicuous monitoring and visible enforcement increase self-regulation among drivers and riders. When road users are exposed to speed feedback, CCTV surveillance, and police presence at the same location, they may perceive a greater likelihood that unsafe behaviour will be noticed and potentially sanctioned. This explanation is more directly supported by the present behavioural data than a latent attitudinal framework, because the current study measured observable interactions rather than self-reported psychological constructs. In this sense, the findings extend earlier research on traffic monitoring and automated speed control in Thailand, which has shown that visible control technologies can influence road-user behaviour under real-world conditions (Tankasem et al., 2019, 2022).
The World Health Organization (WHO, 2018) emphasises that pedestrian-priority environments should aim for impact speeds at or below 30 km/h. Achieving a mean speed of 28.3 km/h under the combined condition aligns closely with international injury-prevention principles. For resource-constrained agencies in LMICs, mobile speed-display signs and CCTV trailers may offer a practical way to strengthen the effects of periodic traffic-police deployment, particularly in school environments where permanent engineering upgrades may not be immediately feasible. Additional measures aimed specifically at motorcycles, such as high-visibility markings, lane-based warnings, or tactile speed-reduction treatments, may further improve compliance in mixed-traffic settings.
Study strengths and limitations
This study provides important evidence of the effectiveness of three treatment options in increasing yielding behaviour and reducing approach speeds at school-zone crosswalks. The combination of varied-cost interventions offers practical options for other areas in Thailand and countries with similar road and crossing configurations in school precincts. The high number of pedestrian–vehicle interactions was a key strength of the study, as the statistical analysis provided robust findings on the significance of changes in yielding behaviour and approach speed.
Several limitations should also be acknowledged. First, the study was conducted at a single school-zone crosswalk, which limits external validity across roadway types, enforcement cultures, and pedestrian environments. Second, although observations were conducted across weekday morning and afternoon periods and included both peak and off-peak conditions, the study did not retain a scenario-specific timetable with date- and block-level reporting. Accordingly, temporal variation across observation periods cannot be fully ruled out and should be considered when interpreting between-scenario comparisons. Third, because the site likely included repeat users, some spillover or learning effects may have occurred across scenarios, particularly where drivers or motorcycle riders became aware of monitoring or police presence from earlier periods. Fourth, the study relied on observational video data in a public traffic setting and did not directly measure driver attitudes, intentions, or perceptions; therefore, the behavioural mechanisms discussed here should be interpreted cautiously and not as direct evidence of latent psychological states. Finally, while the intervention package demonstrated strong short-term effects, longer-term studies are needed to assess behavioural adaptation, implementation sustainability, crash outcomes, and cost-effectiveness across multiple sites.
Conclusion
Overall, the present study provides field-based evidence that a low-cost combination of visible monitoring and enforcement can substantially improve yielding compliance and reduce approach speed at a school-zone crosswalk. In doing so, it offers practical guidance for agencies seeking scalable and context-sensitive strategies to reduce child pedestrian risk in mixed-traffic environments.
The findings show that the combined intervention of radar speed-display signs, CCTV, and traffic police produced the most favourable safety outcomes, increasing yielding and reducing mean approach speed. These results indicate that a low-cost package combining monitoring, feedback, and enforcement can substantially improve driver compliance in a live school-zone environment.
All three treatment scenarios improved compliance relative to the no-control condition, with the combined monitoring-and-enforcement treatment showing the strongest effect. A separate multivariable model further showed that vehicle speed, pedestrian-vehicle gap distance, pedestrian volume, and pedestrian crossing speed were significant predictors of non-yielding behaviour, whereas vehicle type was not statistically significant after adjustment. Higher vehicle speeds, longer pedestrian-vehicle gaps, and faster pedestrian crossing speeds were associated with greater odds of non-yielding, whereas higher pedestrian volumes were associated with lower odds of non-yielding.
Taken together, these findings suggest that school-zone safety can be improved through both direct intervention measures and strategies that address the behavioural and traffic dynamics underlying yielding decisions. For resource-constrained agencies, mobile speed-display signs and CCTV units, combined with visible traffic-police deployment, represent a practical and potentially scalable approach to improving pedestrian safety where permanent engineering upgrades are not immediately feasible. Future multi-site studies should integrate behavioural, temporal, and crash-based data to assess long-term effectiveness, adaptation effects, and cost-efficiency across a wider range of school-zone settings.
AI tools
Grammarly was used solely to support English language editing, grammar checking, and clarity of expression. No AI tools were used for idea generation, study design, data coding, data analysis, interpretation of results, or manuscript content development.
Acknowledgements
This research project was financially supported by Mahasarakham University.
Author contributions
Piyanat Jantosut: Collecting data, Writing – original draft. Phongphan Tankasem: Conceptualization, Methodology, Supervision, Writing – original draft. Jetsada Kumphong: review and editing. Phongsavanh Inthavongsa: review & editing. Ekarin Surinaud: Collecting data
Funding
This research project was financially supported by Mahasarakham University.
Human Research Ethics Review
This study was approved by Mahasarakham University ethics committee for research involving human subjects under ethics approval no. 115-149/2023. Permission to conduct field observations and deploy temporary monitoring equipment was obtained from the relevant local and institutional authorities prior to data collection. The study relied on video-based observation in a public traffic environment and did not seek to identify individual road users. Video footage from CCTV and drones was used solely for behavioural coding and measurement of interaction variables. No facial recognition, licence-plate identification, or personal identity tracking was undertaken. All recorded files were stored in password-protected devices accessible only to the research team and were retained solely for research and verification purposes. Because the interventions were temporary and low-risk, and because no measure reduced the existing level of site safety, the staged field design was considered ethically appropriate for evaluating practical road-safety treatments under real-world conditions.
Data availability statement
The data and protocols supporting the findings of this study are available from the corresponding author upon reasonable request. Due to privacy and ethical restrictions related to video-based observations of road users in a public traffic environment, the raw video recordings are not publicly available. Aggregated and de-identified data used for statistical analysis may be made available upon reasonable request.
Conflicts of interest
The authors declare that there are no conflicts of interest.