Glossary
AiRAP Accelerated and Intelligent Road Assessment Programme
BCR Benefit-cost ratio
BND Brunei dollar (1BND worth 1.33 New Zealand dollar at time of publication)
BruRAP Brunei Road Assessment Programme
DOR Brunei Department of Roads
iRAP International Road Assessment Programme
SRIP Safe Roads Investment Plan
VRU Vulnerable Road Users (i.e., pedestrians, cyclists, motorcyclists)
Introduction
Death and serious injuries caused by crashes on our roads are a public health emergency. We must take decisive, evidence-based action to stop further escalation and reverse the trend. The International Road Assessment Programme (iRAP) has leveraged the extensive global knowledge base to devise a road survey methodology applicable to all nations. iRAP employs a star rating system to identify risk on the roads from highest risk (1-star) to the lowest risk (5-star).
Two of the United Nations voluntary road safety goals encourage countries to focus on the safety of their strategic road network. Specifically, “Target 3, By 2030, all new roads achieve technical standards for all road users that take into account road safety or meet a 3-star rating or better” and “Target 4, By 2030, more than 75 percent of travel on existing roads is on roads that meet technical standards for all road users that take into account road safety”. The strategic road network is the high-volume routes that typically carry 75 percent of a country’s vehicle-kilometres travelled. The goal is to upgrade these roads to a 3-star or better rating. If all countries were to achieve this goal, this would go a long way to achieving the United Nations 50 percent reduction goal by 2030 (WHO, 2021).
Brunei is one of only ten countries (along with Denmark, Japan, Norway, Russia, United Arab Emirates, Venezuela, Belarus, Lithuania, Trinidad and Tobago) to achieve the 50 percent reduction goal or greater for fatalities in the first decade-of-action for road safety, from 26 (2010) to 13 (2019) (WHO, 2023). Brunei has formally set a national policy goal of reaching zero road fatalities by 2050 (MKKJR, 2020). Conducting a second iRAP assessment is part of Brunei’s strategic national road safety actions (BNRSC, 2025). With the first assessment undertaken in 2015 (Turner et al., 2016), insights are providing an evidence base for ongoing actions to maximise road safety benefits.
The Brunei Department of Roads (DOR) undertook its second national iRAP assessment in 2024. This assessment evaluated the safety performance of 800 kilometres of the strategic road network. Using the 2015 baseline, this paper summarises the outcomes of the 2024 assessments and used performance tracking to assess progress and inform ongoing improvements to safer roads. It also explores the potential application of AiRAP to enhance future assessments by addressing limitations in traditional methodologies, such as manual data collection and coding consistency. AiRAP is an automated, intelligent assessment method that improves data accuracy, reduces costs, and ensures consistent performance tracking over time (iRAP, 2021).
International Road Assessment Programme (iRAP)
The International Road Assessment Programme (iRAP, 2025) has drawn upon the extensive knowledge base of the developed world’s Road Assessment Programmes (Europe (EuroRAP), Australia (AusRAP) and United States of America (usRAP)), to develop a road survey methodology for all countries. The iRAP approach has been applied in over 100 countries.
The iRAP Protocol used internationally has four stages.
-
Risk Maps: where detailed crash data are available, road network maps are used to illustrate the location of crashes that resulted in death and serious injuries.
-
Star Ratings: road design is assessed and rated from 1-star to 5-star to provide a simple and objective measure of the level of safety.
-
Safer Roads Investment Plans: 94 road improvement options are included in the iRAP model. The iRAP VIDA software tool selects suitable countermeasure(s) to address a safety issue and improve the star rating, based on a benefit-cost analysis.
-
Performance Tracking: Star Ratings and Risk Maps (when available) can be used to track road safety performance and establish policy positions.
However, in Brunei, detailed crash location data were not available and risk maps could not be produced in 2024. This is typical of many countries where crash data are not readily available due to privacy concerns and/or poor quality of crash reporting. Risk maps are typically only generated in some developed countries.
Star Ratings provide a simple and objective measure of the relative level of risk associated with road infrastructure for an individual road user. In addition to the stars, the ratings are also colour coded from the safest ‘green’ roads (5-star) to the least safe ‘black’ roads (1-star). Importantly, when assessing the star rating for a section of road for the safety of motor vehicle occupants, the assessment considers roadside hazards (location, type). For the higher standard higher speed roads, both shoulder and median barriers provided extra protection for drivers and passengers. Importantly, star ratings can be produced without reference to detailed crash data, only aggregated information.
iRAP Star Ratings are based on the engineering features of the road and the degree to which they impact on the likelihood and severity of a crash. These features include a range of factors such as lane and shoulder width, the location and type of roadside features (eg. poles and ditches), location and design of intersections, road surface condition, horizontal road alignment (eg. curvy or straight), traffic signage and marking provided and presence of pedestrian and cyclist facilities (eg. bike lanes). Data on engineering features are coded at 100 metre intervals along the surveyed roads. The focus is on the features that influence the most common and severe types of road crash for motorcyclists, pedestrians, motor-vehicle occupants and cyclists. The volume and speed of motor vehicles is also a key factor in crash occurrence.
The iRAP package of tools includes the development of Safer Roads Investment Plans (SRIPs) to reduce crash risk, typically through infrastructure improvements. Finally, performance tracking is essential so that road-controlling jurisdictions can understand the effect their road safety investment has had across their network and what changes should be made in future road safety investment plans.
Method
Setting
Brunei, officially Brunei Darussalam, is located in the northeast of the island of Borneo in Southeast Asia. With a land area of 5,765km2, physically it is slightly larger than the city of Auckland, New Zealand but only about a quarter of the population. At just over 460,000 people (World Bank, 2025), Brunei has a low population density (89 people per km2) (World Bank, 2026) that is concentrated along the northern coast, particularly around the capital of Brunei-Muara. The rest of the population is dispersed in the interior and eastern regions. Brunei is distinct from many of the neighbouring countries in Southeast Asia. Only Brunei and Singapore are classified as high-income countries while the rest of the region is middle-income countries.
Notably, mode share in Brunei is distinct from other countries in Southeast Asia where motorcycles are a dominant mode of transport. However, in Brunei in 2016, motorcycles were only 1.3 percent of registered vehicles (MIROS, 2022) making it the least preferred mode of motorised transport.
The Brunei Road Assessment Programme or BruRAP is the implementation of the iRAP assessment, adapted to align with local priorities. In Brunei, that included speed management which was a core strategy in the road safety investment program, with a focus on encouraging compliance with existing speed limits. With two iRAP assessments (BruRAP1, baseline 2015; BruRAP2, 2024) it was possible to do iRAP performance tracking; this compared iRAP data from one period to another to determine what changes have occurred to the underlying crash risk across the assessed network, and what underlying safety attributes affect this change.
Data collection: BruRAP1 (2015) and BruRAP2 (2024)
The first BruRAP assessment (BruRAP1) was conducted in 2015. The surveyed network consisted of 535 km of strategic routes and main arterials (single and dual carriageway). These roads were selected by the DOR and were surveyed from 3 to 16 December 2014.
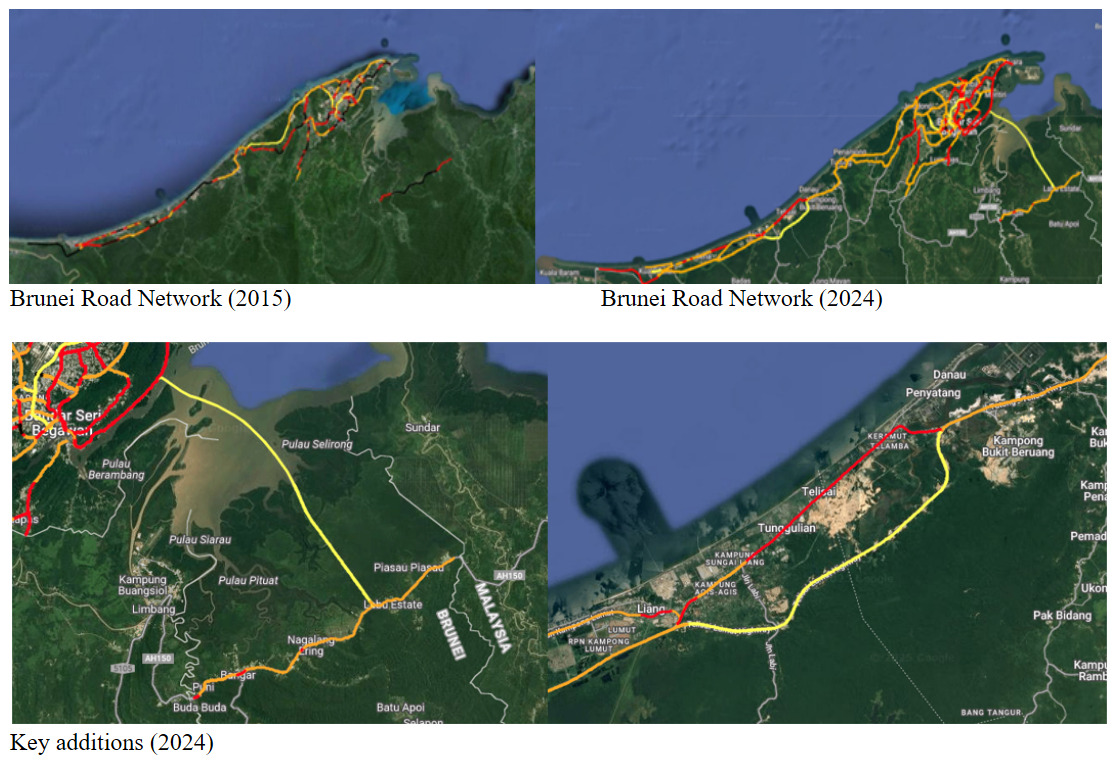
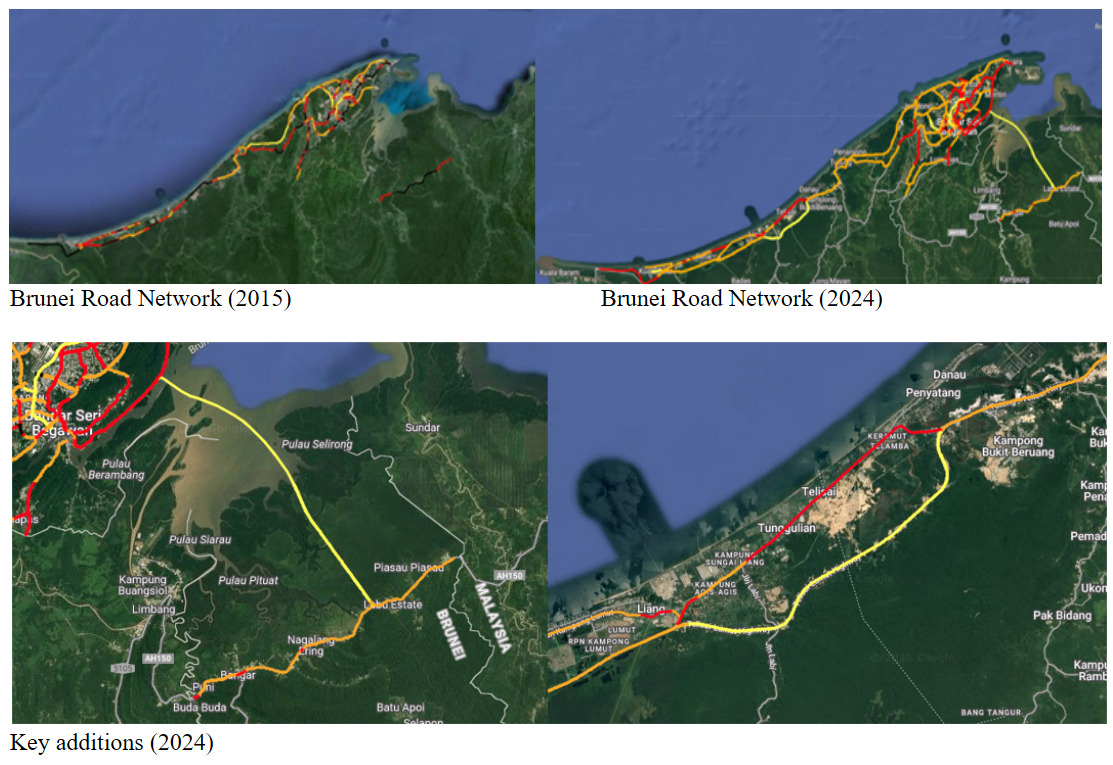
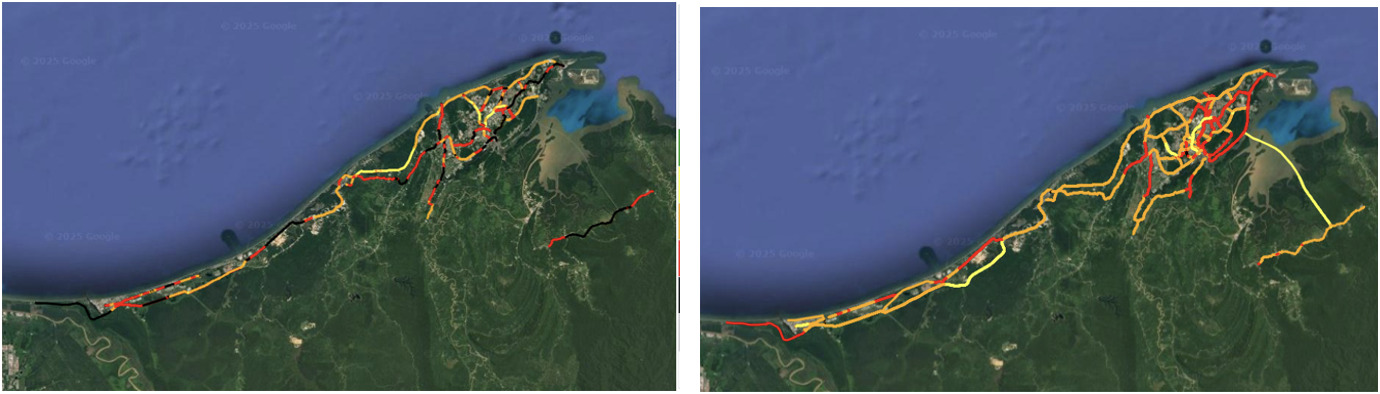
Figure 1 shows all the locations surveyed for the two BruRAP assessments. The top left shows the 2015 assessed roads with the main highway/motorway travelling along the coast. The separate section of black and red highways is in the Tempurong region, which at the time was separated from the other regions of Brunei (Muara, Tutong and Belait). Access to this area was by boat or a vehicle trip through the Malaysian State of Sarawak.
The top right shows the network surveyed in 2024 for BruRAP2. This assessment was longer and consisted of 802 km of strategic routes and main arterials (single and dual carriageway). The total length of the Brunei road network covered is 530km (i.e., for each 1km section of dual carriageways 2km were surveyed). These strategic roads were selected by the DOR and were surveyed between 13 November 2023 and 12 February 2024. The surveyed network includes the majority of strategic and higher-volume roads.
The main additions to the strategic network from 2015 to 2024 are the 30km Jambatan Sultan Haji Omar Ali Saifuddien (Bridge) and Telisai-Lumut Bypass. Both were 4-star (yellow) sections, as shown in more detail in the bottom images in Figure 1. The bridge connects the Brunei-Muara District to the Temburong District.
To calculate the star rating of each section of route, the entire survey network was videoed using the same approach as in 2015. The local Brunei team used a dash mounted camera linked to GIS coordinates. This video collection method met the data collection requirements of the iRAP organisation. Dual carriageway routes (e.g. freeways) were videoed in both directions. In total, 817km of carriageways length was videoed. Using the video data an iRAP certificate company in India extracted approximately 50 road features at 100m intervals.
Speed and traffic volume data were collected for a representative sample of routes by the local survey team during the same period in 2024 that the video data were collected as they were not readily available in Brunei. The number of sites selected was aligned to the iRAP requirements for the length of the network assessed. To enable a comparison of speeds and traffic counts between 2015 and 2024, the majority of the data were collected at the same locations that were surveyed in 2015. Some additional counts were collected given the expanded road network assessed in 2024. The count and speed data were in most cases collected manually over a day for the periods 7am to 10am, 11am to 2pm and 3pm to 6pm using a speed gun and hand counters. At several of the new speed count sites (especially on freeways) fixed cameras were used to collect speed data. The traffic counts were scaled to annual average daily traffic (AADT) flows using factors developed in the 2015 assessment.
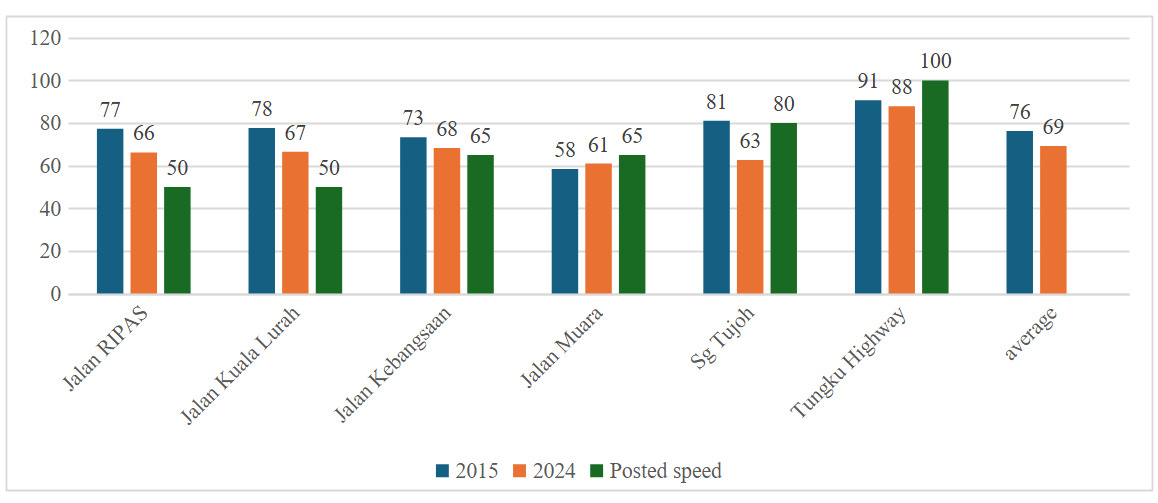
The speed survey data were also used to determine if operating speeds had changed between 2015 and 2024. The comparison shown in Figure 2 indicates that the mean speed at all sites except one (Jalan Muara) has come down.
__data_comparison_between_2015_and_2024_networks.png)
While motor vehicles are the primary mode of transportation in Brunei, star ratings were also developed for pedestrians, bicyclists, and motorcyclists so that safety for these road user groups could be considered in the design of new roads and safety improvements. Given the low rates of walking and cycling in Brunei, the weight being placed on a safer design for each mode should anticipate the likely future use of each corridor. For example, routes that may be promoted for cycling need a better star rating for cyclists compared with routes where cycling is less likely or will not be promoted
The cost of countermeasures were also considered from the 2015 BruRAP1 data and adjusted for 2024. The DOR provided unit costs for some interventions and construction of road safety solutions, which were then compared to the scaled 2015 Brunei iRAP countermeasure costs. Construction costs were also validated using data gathered from other Southeast Asian countries, including Singapore.
The next two sections present the star rating performance results of both BruRAP assessments and the performance tracking for those locations where the assessments overlapped.
Performance tracking
The Performance tracking followed a three-stage process.
Stage 1. Data collection and preparation
BruRAP data were gathered for 2015 and 2024. Historical data from 2015 were obtained from the iRAP VIDA tool while the 2024 data were collected manually as part of the current project. Both datasets were uploaded into VIDA and underwent standard checks to ensure they were correctly formatted and imported. Although the data from both years followed the same structure, they were stored in a coded numerical format, which made connection difficult. To address this, a custom translation tool was developed to convert the coded values into text, improving clarity and usability for analysis and reporting.
Stage 2. High-level data analysis
A high-level comparison of the 2015 and 2024 datasets was conducted to observe general trends and changes across the network. This initial analysis aimed to provide a broad understanding of how safety performance had evolved over time. The results were summarised in tables and formed the basis for the overall network comparison.
Stage 3. Site-by-site analysis
The final stage was a detailed site-by-site analysis. The two datasets were spatially joined by matching the nearest points between the 2015 and 2024 records, using a one-to-one approach to avoid duplication. Only road sections with corresponding data in 2015 and 2024 were included. This allowed for a more accurate and targeted evaluation of changes at specific locations. The results were aggregated to produce the historical network comparison, and two case study locations, the AH150 bypass and the northern approach to the Temburong Bridge, were explored in greater depth.
Star ratings were calculated for all four road user groups across four scenarios. These ratings are presented together in Table 4 for a direct comparison across the intervention options.
A range of countermeasures was included in the model. The results section (Table 3) presents the most effective and impactful countermeasures for each scenario and are described below (refer to iRAP Road Attribute Risk Factors Factsheets for more details on each countermeasure, iRAP (2026)).
-
Clearing roadside hazards: Roadside hazards can increase crash severity. But creating completely clear zones free of hazards is not always possible. During the sense check of improvement options to sections of the network, it may be necessary to replace the clear-zones treatment with a semi-rigid barrier system.
-
Rumble strips: Rumble strips provide audio and tactile awareness to vehicle drivers that they are straying from the traffic lanes. Centreline rumble strips are also an effective low-cost short-term treatment.
-
Route and curve delineation: On curves, chevrons and curve advisory signs can reduce loss-of-control crashes. On straight route section edge-lines, edge-marker posts and raised reflectorised markers can reduce crashes.
-
Speed management (both enforcement and lower speed limits): Both lower speed limits and enforcement of current speed limits reduce the likelihood and severity of crashes.
-
One-way road network: One-way roads have lower crash rates than two-way roads (at the same operating speeds) as they eliminate high severity head-on crashes. They also simplify intersections with fewer crashes.
-
Protected turn lanes at unsignalised intersections: Protected turning lanes allow left and right drivers to stop their vehicles clear of through vehicles, and this reduces pressure on driver to taking small gaps and crash.
-
Central hatching: Central hatching provides an area clear of through traffic for drivers to position their vehicle before turning right into accesses and sideroads, reducing crashes risk associated with these manoeuvres.
Results
Star Rating Performance of Network in 2015
BruRAP provides star ratings for the assessed roads for all four road user types: pedestrians, cyclists, motorcyclists and motor vehicle occupants. Table 1 presents the ratings in 2015 before any treatments are applied.
Table 2 shows the star rating maps for vehicle occupants. The star rating of the road, both urban and rural, in Brunei compared well with those of other developed countries and was generally above that of other countries in Southeast Asia (Turner et al, 2016). BruRAP1 showed that 45 percent of strategic roads had a star rating of three or better for vehicle occupants. Using the iRAP VIDA software, we identified that 63 percent of motorways were rated three-star or better.
An initial assessment of the 1- and 2-star routes (using the iRAP VIDA tool) indicated that the proportion of roads, particularly urban roads, rated 3-star for vehicle occupants would increase markedly if the high observed operating speeds could be reduced. The benefits of achieving lower operating speeds on each route are presented in the scenario testing. The infrastructure for walking, cycling and motorcycling was poor with the majority roads rated 1-star (excluding roads that were not applicable). Fortunately, there were few serious and fatal crashes involving these modes, though this is more likely to be a function of exposure with few people walking, cycling or riding motorcycles on these routes. Further work is needed to address the safety needs of these road user groups. For example, pedestrians can be protected through the provision of safe crossing places such as at signalised crossings and overpasses and protected at mid-point locations through wider and increased separation of footpaths and pedestrian fencing. However, a comprehensive review of the network level needs for pedestrians, cyclists and motorcyclists is needed to ensure people’s safety when they use these modes.
Performance Tracking: Comparing 2015 and 2024 Networks
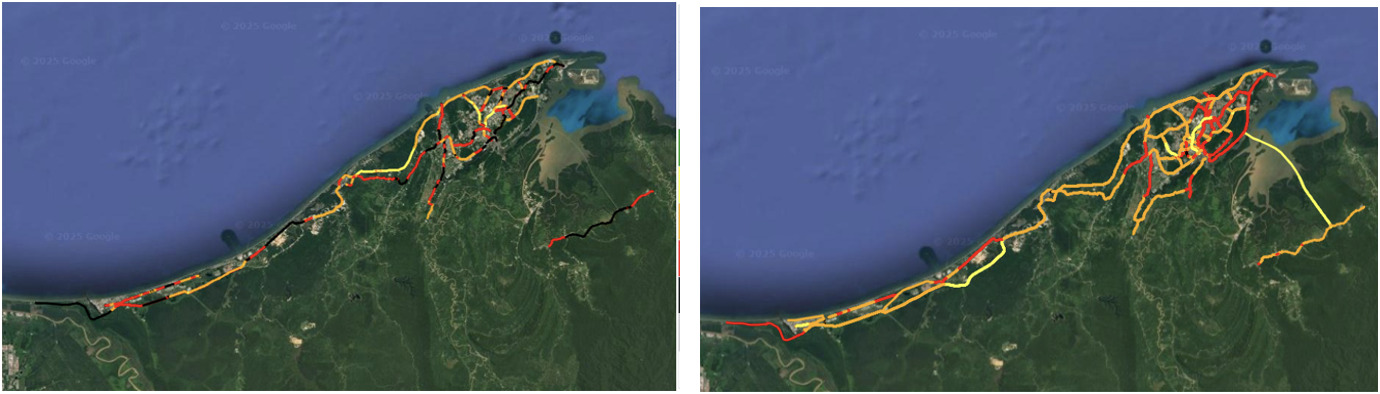
The performance tracking analysis revealed a substantial improvement in vehicle star ratings on the common roads (around 600km) between the baseline, untreated network assessed in 2015 and 2024, especially from ratings of 1- and 2-star to 3-star or better (Figure 3, Table 2). For example, less than half the network was rated 3-star or better for vehicle occupants in 2015 (46%) and this increased to 76 percent in 2024. Further examination of the data showed that this improvement was mainly due to lower average and 85 percentile vehicle operating speeds. Improved surface condition of the roads also contributed to the improved star rating.
While there were some improvements for people walking, cycling or riding motorcycles (i.e., vulnerable road users (VRU)), in the 2024 assessment most of the network was still 1- or 2-star. This is a concern for those that do walk or cycle, although VRU volumes are very low or zero on many of these roads. Even motorcycle volume was very low, especially compared to surrounding countries in Southeast Asia where motorcycle mode share is over half the total vehicle fleet (MIROS, 2022). Brunei, with motorcycles comprising less than 5 percent of all registered vehicles, is more like New Zealand (Ministry of Transport, 2026) and Australia (ABS, 2022).
In Brunei, the Police record national deaths and serious injuries statistics, including VRU fatalities. These data are not publicly available. We can confirm through our study that there were few VRU deaths and serious injuries. But these were not on the strategic roads and occurred in crashes across the network. Much of the pedestrian activity was concentrated on local roads, like strip shopping malls. However, Brunei will need to improve VRU safety to achieve zero fatalities.
Overall, the performance tracking results were promising given the high proportion of the network (76%) that was 3-star or better for vehicle occupants. This success indicates that targeting the remaining 2-star routes will lead to further improvements, fostering a sense of optimism among stakeholders for the future of road safety.
Safer Road Investment Plans (SRIPs) for 2024 onwards
A Safer Roads Investment Plan (SRIP) contains a list of affordable and economically sound road safety treatments (or countermeasures), specifically tailored to reduce risk on the surveyed network. Appropriate countermeasures are selected from over 94 options in the iRAP model. Each countermeasure is supported by strong evidence that, if implemented, will prevent deaths and serious injuries in a cost-effective way measured by the benefit-cost ratio (BCR). That is, the countermeasures will save more in prevented crash costs than they cost to build and maintain. However, each countermeasure should be regarded as a recommendation and requires investigation, prioritisation, concept planning and detailed design before implementation.
In the 2024 Brunei assessment, four scenarios were run to produce two SRIPs, with different BCR cutoffs, costs and outcomes. Each scenario involved the application of a series of countermeasures to the surveyed (or baseline) road network based with a specific BCR cut-off. For each scenario the reduction in fatal and serious crashes (for a given cost) was predicted. The crash reduction is the sum of crash reduction benefits of a large number of upgrade treatments.
Speed management played a central role in Brunei’s original 2015 iRAP assessment and was considered an innovative element of the SRIPs. Unlike traditional infrastructure-focused strategies, the 2015 approach incorporated both passive measures (e.g., signage, road markings, gateway treatments) and active measures (e.g., targeted enforcement). This holistic approach recognised that behaviour change and compliance are as crucial as engineering solutions. In the 2024 assessment, speed management remained an important lever for achieving higher safety ratings in two of the four scenarios, although it is no longer considered a novel approach. Nonetheless, it remains a key tool, particularly for the small proportion of the network that cannot economically be upgraded through infrastructure alone. As such, enforcement and lowering some posted speed limits, so that they are safe and appropriate, continue to be critical components of the broader safe system response.
Like many countries in Southeast Asia, speeding is a major issue in Brunei which contributes to a substantial number of serious and fatal crashes. Table 3 shows the improvement in operating speed (85th percentile and mean speeds) by speed limit that have been assumed for Scenario 1 and Scenario 2. This level of speed reduction is a reasonable short to medium term goal.
Ideally, speeds could be reduced further, especially in urban areas. Further refinement of Scenario 1 and Scenario 2 and the assumed speed changes would need to be undertaken after a speed management strategy is developed for Brunei. A speed management strategy needs to consider the level of investment in passive and/or active enforcement that might be required to achieve safe operating speed targets.
Scenario 1. Speed management improvement only
In this scenario, the focus was on better compliance with current speed limits only. No infrastructure improvements were proposed. Improved compliance with current speed limits is expected to achieve improvements to star rating and reductions in fatal and serious crashes that are comparable to a mix of infrastructure improvements. The mean and 85th percentile vehicle operating speeds across the network significantly affect the star rating and the number of fatal and serious injury crashes.
Table 4 shows the expected star rating when Scenario 1 is fully implemented. This proposed scenario is estimated to reduce deaths and serious injuries by seven annually. A speed management strategy may have additional crash saving benefits across the rest of the Brunei road network, if speeds do reduce on other non-strategic roads that are not included in this analysis. The set-up and ongoing costs of speed management (speed enforcement) will need to be estimated if this scenario is pursued as VIDA does not provide costing on this type of treatment.
For vehicle occupants, the implementation of Scenario 1 will increase the proportion of roads that are 3-star or more across the entire network. By road length, this increase would be for both 3-star (increased from 76% to 80%) and 4 or 5-star (17%). Scenario 1 estimated smaller improvements in star ratings for motorcyclists, cyclists and pedestrians.
Scenario 2. Infrastructure with speed management (based on BCR of 3)
In Scenario 2 (also in Table 3) both speed management and infrastructure treatments were considered. After the operating speeds were adjusted as shown in Table 2, the iRAP tools (in VIDA) were used to develop the SRIP for this lower speed network with a BCR cut-off of 3 for each treatment.
This proposed SRIP is estimated to reduce annual deaths and serious injuries by 44 annually. The cost of infrastructure works is estimated to be BND$90M. Scenario 2 would provide vehicle occupants with an almost complete network of roads rated 3-star or better by road length (increase from 76% to 99%). This includes over half (58%) of the road length that would be rated as 4- or 5-star for vehicle occupants.
Scenario 3. Infrastructure, no speed management (based on BCR of 3)
Scenario 3 only included road safety infrastructure treatments with an initial BCR of at least 3. This program had an overall cost-benefit ratio of 6.
This proposed SRIP is estimated to reduce deaths and serious injuries by 41 annually including approximately four deaths with a total of approximately BND$568M in safety benefits over 20 years for a capital expenditure of BND$95M. For vehicle occupants, Scenario 3 increases the length of road with a star rating of 3 or more to almost the entire surveyed network (from 76% to 97%). This includes the majority of road length (61%) being rated at 4- or 5-star and a small percentage of roads with 1- or 2-star (3%).
Scenario 4. Infrastructure, no speed management (based on BCR of 1)
The fourth scenario includes road safety treatments with at least an initial cost-benefit ratio of 1 and no change in operating speed for each speed limit and road type (i.e., no new speed management initiatives or increase in speed after improved road conditions). This program had an overall BCR of 3.
This proposed SRIP is estimated to reduce deaths and serious injury crashes by 52 annually, including approximately five deaths with a total of approximately BND$683M in safety benefits over 20 years for a capital expenditure of BND$233M. Under scenario 4, the length of road with a (vehicle occupant) star rating of 3 or more improves from 76 percent to 99 percent of the surveyed network. This includes 66 percent of the road length being rated at 4- or 5-star. The length of roads with 1-star is very low and 2-star is 1 percent.
The four scenarios were presented to the DOR and National Road Safety Council in November 2024. At this stage the Brunei Government have not decided which option they prefer. However, the Government has started to implement speed management initiatives. Passive speed enforcement cameras have been installed across the network to lower speeds.
Table 5 provides a summary from the BruRAP assessments including the proportion of road lengths by star ratings, costs and projected reduction in fatal and serious injury crashes.
Discussion
The 2024 iRAP assessment of Brunei’s strategic road network showed that the majority of the strategic urban and rural roads had a star rating of three or better for vehicle occupants (approximately 76%), a sizable increase from 2015 (46%). There was also an improvement in the length of the network that was 4- and 5-star which doubled from 2015 to 2024.
The 2024 assessment provides valuable insights into Brunei’s progress and the effectiveness of various interventions. One of the most significant contributors to the improved star ratings between 2015 and 2024 was the reduction in operating speeds. Targeted surveys of motor vehicle speeds validated that these reductions were not isolated to a few locations. The findings confirmed that speeds had decreased across most surveyed sites, supporting the reliability of the performance tracking.
Another key factor in the increased star ratings across the strategic road network was the improvement in road conditions, largely due to better maintenance practices. While there were still defects in the road surface, a site drive revealed that most of the damage (e.g., potholes) had been repaired. However, some condition variables (e.g., skid resistance) were more difficult to assess through video or photographs and the accuracy of this input could not be verified. This uncertainty around a key road surface factor highlights one of the challenges with traditional iRAP assessment methods. In parallel with improvements in the infrastructure star rating in Brunei has been a substantial and sustained reduction in the annual number of fatal crashes on the road. Since 2015, the number of fatal crashes has reduced by more than half, maintained from 2019 onwards. While multiple factors likely contributed to this outcome, the safety performance of the road network is considered an important influence.
At a broader level, the comparison between the 2015 and 2024 iRAP assessments highlighted more of the limitations of the traditional iRAP methodology. Although both assessments followed the specified coding method and were carried out by iRAP-trained and accredited organisations, they were completed by different teams. Despite efforts to apply a consistent methodology, the manual nature of the coding process and the subjectivity involved in assessing certain variables, particularly condition ratings, introduced uncertainty. Some of the observed differences between the two assessments were due to changes in actual road conditions and operations but others were inconsistencies in how those conditions were coded.
These findings underline the challenges of relying solely on manual, human-coded data for performance tracking over time. Even with training and guidance, maintaining complete consistency between assessments is difficult. This is where the use of AiRAP becomes increasingly valuable. By applying automated data collection (e.g., feature extraction from lidar) and other sources of condition data (e.g., skid resistance measurements), AiRAP has the potential to improve the accuracy, consistency, and repeatability of future assessments. AiRAP would provide a stronger foundation for tracking progress, informing investment decisions, and ultimately enhancing road safety outcomes.
In this project, four safer road scenarios were developed to show how the risk of serious injury and fatal crashes could be reduced on Brunei strategic road network. Scenario 1 was speed management only. Scenario 2 included both speed management and infrastructure improvements. Scenario 3 and Scenario 4 included infrastructure improvements with no change in operating speeds. While many costs were estimated, speed management costs are yet to be priced.
In Scenario 1, the focus was on better compliance with current speed limits through enforcement and education initiatives. Improved compliance with current speeds, if fully implemented, would increase the number of 3-star plus roads to 80 percent and is expected to reduce the number of deaths and serious injuries by seven per year (in 2024 there were 13 deaths and approximately 100 serious injuries).
Scenario 2 included both speed management, typically reducing operating speeds by 5 to 10km/h on all highways and main roads as well as infrastructure upgrades at a BCR qualifier of 3. The SRIP infrastructure upgrades will cost around BND$90M. Scenario 2, if fully implemented, would increase the number of 3-star plus roads to almost the entire strategic road network (99%) and is expected to reduce the number of deaths and serious injuries by 44 per year.
Scenario 3 included road safety treatments only with a minimum BCR qualifier of 3. Costing BDN$95M, if this programme was fully implemented, the number of 3-star-plus roads would increase to almost the entire strategic road network (97%), reducing the number of deaths and serious injuries by 41 per year.
Scenario 4 included road safety treatment only with a BCR qualifier of 1. This programme would reduce fatal and serious injury crashes by approximately 52 per year (1,000 over 20 years). Costing BDN$233M, again if fully implemented, the number of 3-star plus roads would increase to almost the entire strategic road work (99%).
For the improved safety to motor vehicle occupants travelling on the strategic road network in Brunei, the best return on investment in terms of increased star rating and crash prevention is either Scenario 2 or Scenario 3.
Next Steps
The next step, led by the DOR, is to review and refine upgrade plans for all the remaining 1- and 2-star sections, starting with those on the Trans-Borneo Highway.
Key actions to achieve and sustain a minimum 3-star network rating in Brunei:
-
Refine data and investment planning: Update iRAP inputs (including Brunei-specific construction costs and skid resistance data), undertake scenario testing, and share findings internationally to identify the most effective investment pathways.
-
Deliver systematic upgrades: Implement a mass-action program (rumble strips, barriers, guardrail upgrades), alongside targeted site-specific treatments, with the goal of eliminating all 1- and 2-star roads within five to 10 years.
-
Embed safety in new projects: Ensure all new road designs achieve at least a 3-star (preferably 4-star) rating through design-stage safety audits.
-
Integrate and sustain programs: Combine speed management, mass-action upgrades, and site-specific improvements into a unified road safety program with phased, costed delivery plans.
-
Monitor and communicate progress: Conduct a BruRAP3 assessment, review network star ratings after four years and publicise safety improvements locally and internationally.
Conclusion
The 2024 assessment suggests Brunei is on track to achieve a minimum 3-star vehicle safety rating across its strategic road network within the next decade, a milestone that reinforces its place as a global leader in road safety. Continued progress will require a combination of widespread treatments, targeted upgrades at high-risk locations, and a long-term shift toward higher safety standards on key corridors. Looking ahead, achieving 4-star on major highways is a key ambition with all new designs aiming to exceed this level.
In addition, the DOR are also keen to adopt the AiRAP approach for future assessment to improve the accuracy of their star rating. According to the International Road Assessment Programme (2025), AI is expected to play an increasing role in road safety assessments. AiRAP for iRAP assessments standardises data outputs, making assessments more reliable and validating performance tracking. This is both in terms of the attributes that need to be coded, but also being able to utilise other databases, for example, skid resistance maintenance records and probe data for traffic volume and speeds. We would highly recommend the use of AiRAP for the BruRAP3 planned in four or five years’ time.
AI tools
Copilot was used for English expression and clarity.
Acknowledgements
We would like to acknowledge the Brunei Department for Roads, who provided data for this project and were the main client contact.
Author contributions
The authors confirm contribution to the paper as follows: study conception and design: O. Heer, S. Turner, L Martin. draft manuscript preparation: O. Heer, S. Turner. All authors reviewed the results and approved the final version of the manuscript.
Funding
Brunei National Road Safety Council
Conflicts of interest
The author (s) declare that there are no conflicts of interest.
Australasian Road Safety Conference 2025
Portions of this paper were first submitted in an Extended Abstract to the Australasian Road Safety Conference 2025 (ARSC2025) held in Perth, Western Australia, Australia from 20 to 23 October. The anonymised peer-review process recommended that Extended Abstract be accepted as an Oral Presentation and the Extended Abstract was published in the ARSC2025 Proceedings. This paper extends the Extended Abstract and was underwent further peer-review by two independent subject matter experts. This paper includes content already published in the ARSC2025 Proceedings and is reproduced here with permission.