Introduction
Globally, speeding is recognised as a leading contributor to road traffic fatalities, reflecting both behavioural risks and systemic deficiencies in speed management (Elvik et al., 2019; WHO, 2023). Excessive or inappropriate speeds significantly increase crash risk and injury severity, particularly in low- and middle-income countries (LMIC), where road infrastructure, traffic composition, and enforcement practices may be highly variable (Fondzenyuy et al., 2024). Studies in LMIC settings indicate substantial variations in vehicle speeds across urban and rural environments, influenced by factors such as road type, vehicle mix, and enforcement, with speed dispersions further increasing crash risk (Fondzenyuy et al., 2025).
The safe system approach for speed management suggests a 30 km/h speed limit in built-up areas where there is a mix of vulnerable road users and motor vehicle traffic (WHO, 2008). Human tolerance to injury diminishes if a vehicle exceeds 30 km/h, and pedestrians face an 80 percent risk of fatality at a collision speed of 50 km/h (WHO, 2008).
Urban and rural ecosystems are expected to differ in road conditions, type of roads, vehicle user types, engine capacities, road user behaviours, enforcement, and post-crash care response. For instance, the speed limits on highways in rural areas range from 70 to 100 km/h and in contrast, speed limits on urban roads vary between 25 and 80 km/h, depending on the type of road. Additionally, the speed limits vary based on the type of roads such as 50 km/h for arterial roads, 80 km/h for state highways, 30 km/h for inner roads and 80-100 km/h for national highways.
During 2022, India reported a total of 461,312 crashes on the road, resulting in 168,491 fatalities and injuries to 443,366 individuals (Government of India, (MoRTH, 2023)). That year, the population of India was 1.43 billion people and these crash data equate to a daily rate of 1,264 crashes and 462 fatalities, or 53 road crashes and 19 fatalities every hour across the country (World Bank Group, 2026).
With a population of over 61 million (2011 census, (NDAP, 2026)), the state of Karnataka is the nineth largest in India, yet it ranks fifth among all states and union territories in terms of fatalities (Government of India, (MoRTH, 2023)). Nationally, speeding was a reported factor in the majority of crashes on the road (72%), including both fatal (71%) and injury crashes (73%). Yet the crashes attributed to speed were higher in Karnataka across all crash types (all crashes: 89%; fatalities: 92%; injuries: 88%) (Government of India, (MoRTH, 2023)). Notably in 2022, within the state of Karnataka, in the capital city of Bengaluru accounted for injuries from road traffic crashes in both the urban (n=3,822; 10%) and rural areas (n=3,539; 9%) (Government of Karnataka, Department of Police, 2025). Specifically, in 2022, almost all crashes that resulted in injuries were attributed to speed in both Bengaluru urban (92%) and rural (94%) areas. During the same period, fatalities resulting from speeding in Bengaluru in urban regions were 711 and even higher in rural regions (918) (Government of Karnataka, Department of Police, 2025).
Given that speed is directly linked to crashes and fatalities, understanding vehicle speed differentials, prevalence of speeding, and factors associated with speeding (e.g., vehicle type, road type, time of day) is critical for designing targeted interventions. However, data are limited on these factors in Bengaluru, particularly when disaggregated by urban/rural areas, vehicle categories and times of day. As the greater injury severity in crashes involving speed, it is also crucial to understand speed variance within the context of diverse healthcare systems to increase the likelihood of survival following a crash.
In this context, as a part of a larger government-led initiative, Johns Hopkins International Injury Research Unit (IIRU) and the National Institute of Mental Health and Neuro Sciences (NIMHANS) have conducted speeding assessments in the Bengaluru Metropolitan Region (BMR). This assessment was supported by the Bloomberg Philanthropies Initiative for Global Road Safety (BIGRS). The present paper examines:
-
The differentials in the prevalence of speeding and average speeds of vehicles between urban and rural parts; and
-
The factors associated with speeding in urban and rural parts of Bengaluru Metropolitan Region (BMR).
Method
The study on urban-rural differences in vehicle speeds and its associated factors in the BMR was conducted through a roadside cross-sectional observation of speeding from May to October 2022. Motorised vehicles travelling in the same direction at 25 randomly sampled locations Bengaluru were defined as study units (Bengaluru, urban: n=15; Bengaluru rural and Ramanagara districts, n=10). In this paper, we operationally defined observations in Bengaluru Urban (administered by BBMP) as ‘urban’ and observations in Bengaluru rural and Ramanagara districts as ‘rural’. ‘Speeding’ was defined as speeds recorded more than the posted speed limit for the road and ‘Speed limit’ for the different types of roads refers to point estimates in specific locations and not for the entire length of the road.
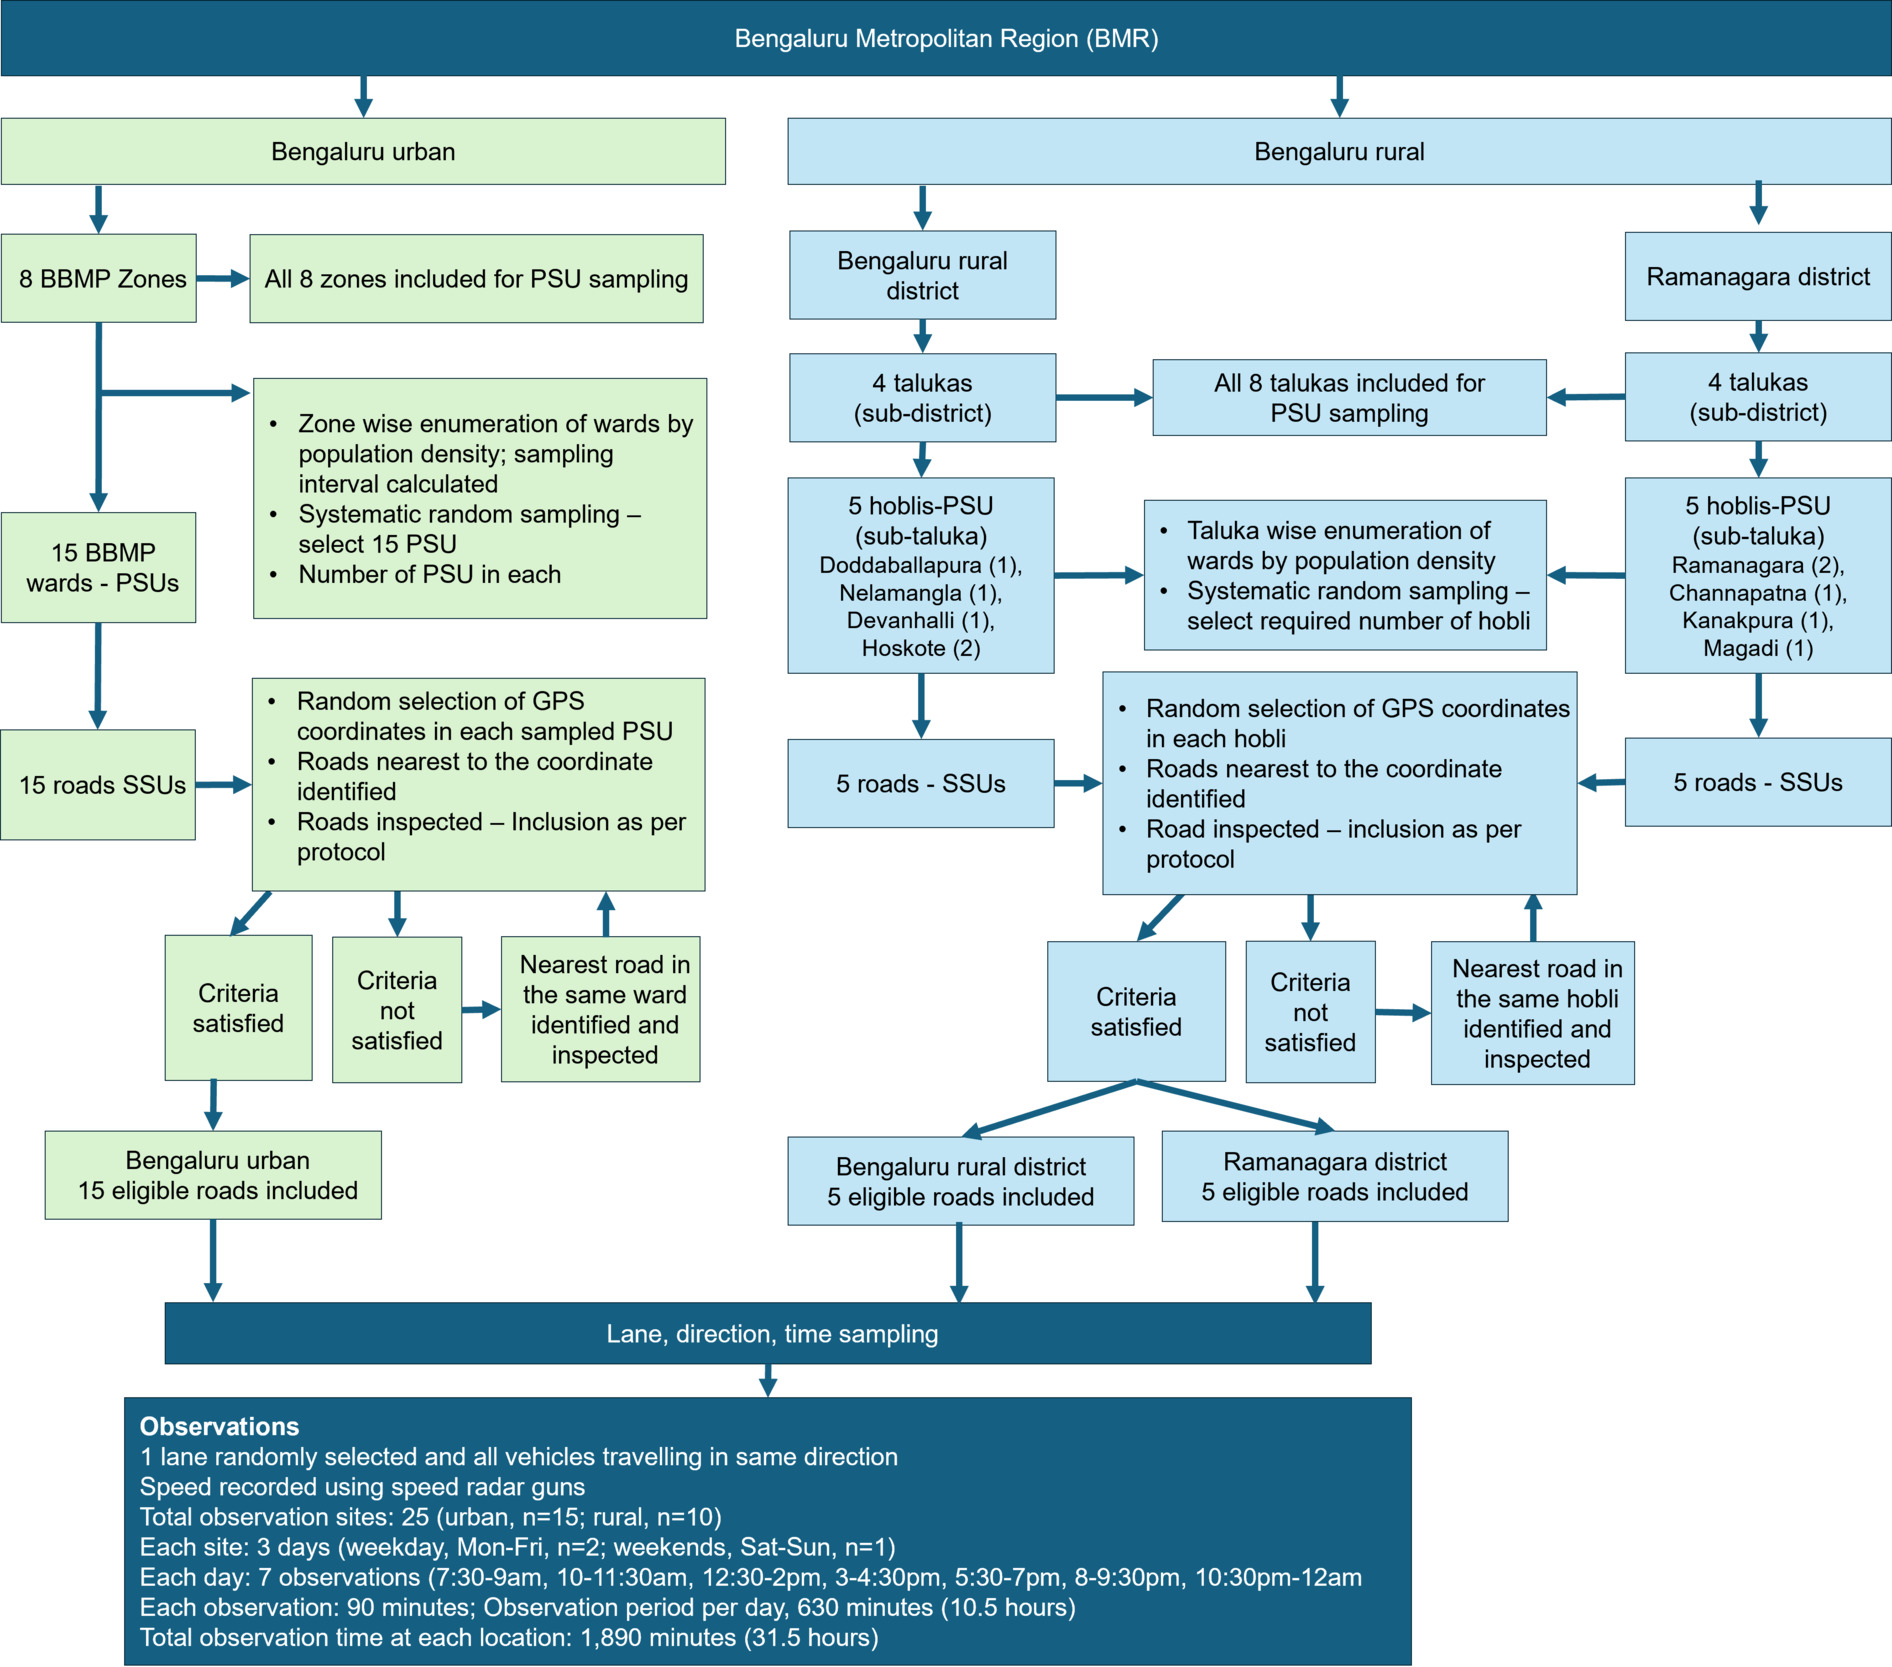
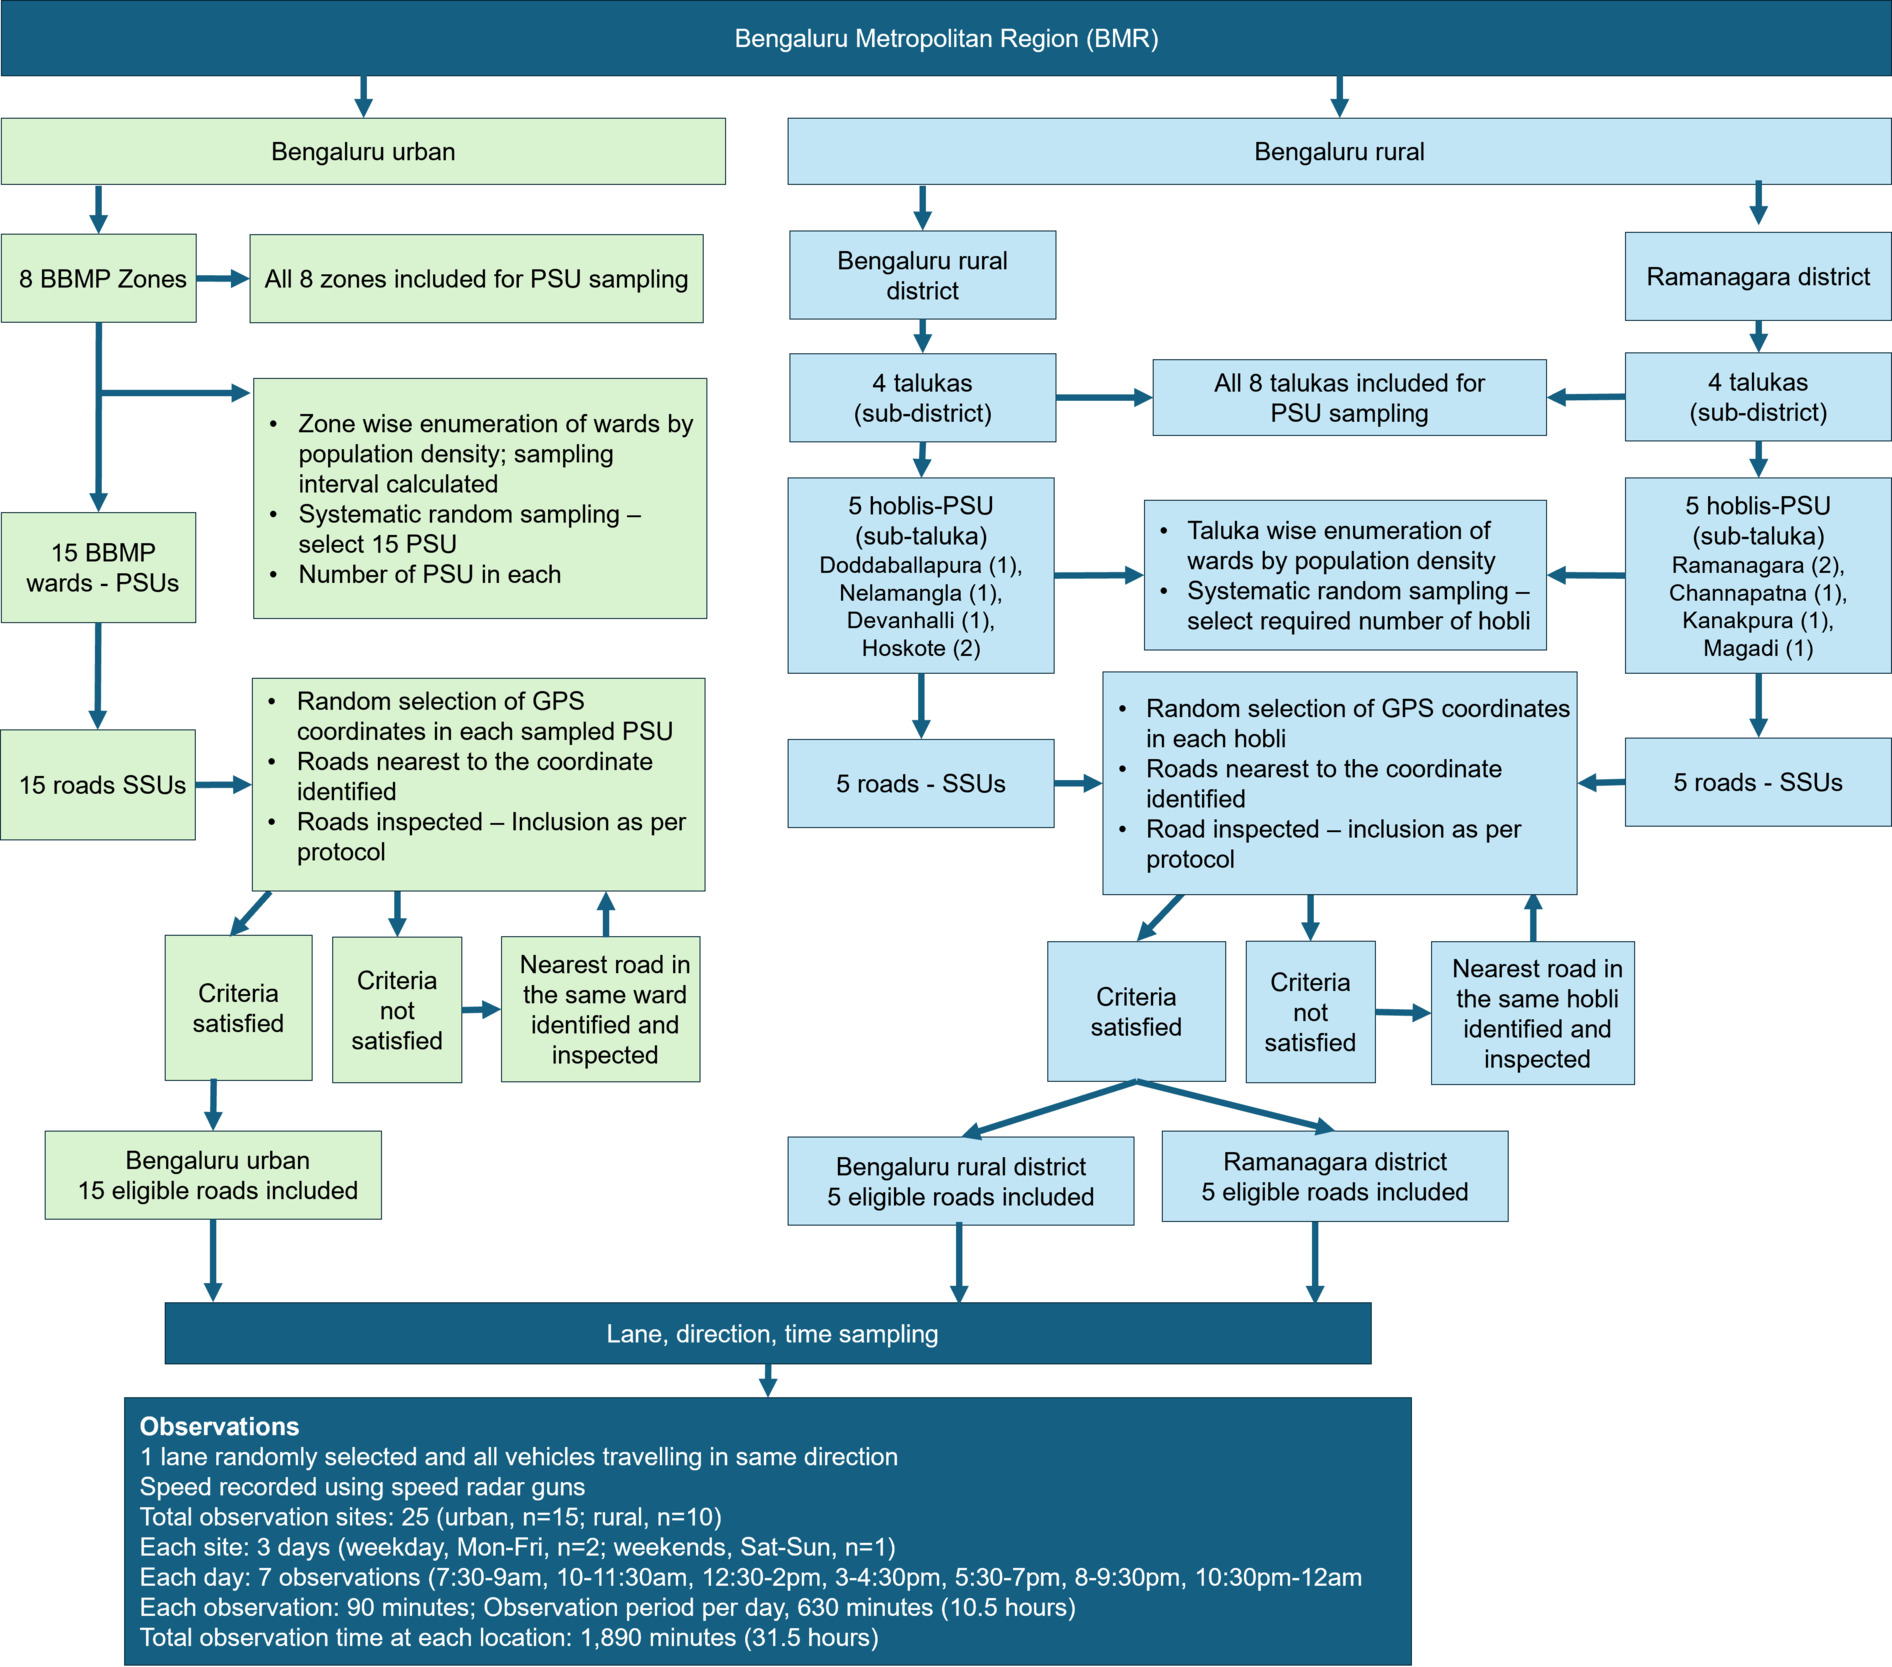
Detailed methodology of speeding assessment is published elsewhere (Johns Hopkins International Injury Research Unit, 2020) and study-specific details are provided here. A multistage cluster sampling method was employed (Figure 1). In Bengaluru Urban, 15 wards (Primary Sampling Units (PSU)) were selected by systematic random sampling from the eight administrative zones, based on population density using the probability proportional to size (PPS) method. Within each sampled ward (PSU), random GPS coordinates were drawn up in Google Maps and the road nearest to the coordinates was inspected to assess eligibility for study inclusion.
Each road (Secondary Sampling Units (SSU)) was chosen based on specific criteria. A standardised global protocol (Johns Hopkins International Injury Research Unit, 2020) was followed for speeding data collection. As per the protocol, roads amenable to speeding were selected, characterised by free traffic flow, absence of visible police enforcement, straight road stretches (minimum 200 metres) without curves or bends, and no nearby schools, junctions, speed bumps, crosswalks, or rumble strips. During data collection, the recorder and observer, regardless of traffic density, measured the speed of one vehicle at a time, specifically the vehicle closest to the observer.
After being satisfied with the assessment criteria for site inclusion, SSU details were uploaded using a hand-held Android device on the KoboCollect application v2021.2.4 for verification and review by the Johns Hopkins International Injury Research Unit (JH IIRU) team. The next nearest similar road in the same ward was sampled in case the criteria failed during the site inspection.
In a similar manner in Bengaluru urban, the ten rural observation sites were sampled from Bengaluru rural and Ramanagara districts. Population density was calculated at the taluka (sub-district) and hobli (sub-taluka) levels. Within each district (Bengaluru urban and Ramanagara) all talukas/sub-districts were considered PSU. Sub-districts are further divided into administrative zones called hoblis (sub-talukas). Hobli/sub-talukas were selected based on systematic random sampling from each district. During the sampling process locations sampled adjoining forest areas and those locations advised as not safe by local police were not included. Alternate similar roads in the same hobli were sampled, assessed, and included (Figure 1).
With each SSU (road), simple random sampling included two weekdays (Monday-Friday) and one weekend day (Saturday, Sunday). Simple random sampling of the direction of the observation site for a two-way road was done and fixed.
Study instruments
Study Instruments were provided by JH-IIRU (i.e., speed observation form using speed radar guns) and after completion of verification of survey sites were uploaded into the KoBocollect application v2021.2.4. The study instrument collects information on time and date stamp, location stamp, type of vehicle, observed sex of driver/rider, and speed in km/h. An automatic handheld speed radar gun was used for recording the speed of vehicles (Model Bushnell 101911 Velocity). They were procured and calibrated for accuracy, standardisation, and repeatability in measurements. Pilot testing was conducted in two locations before data collection.
Data collection
Two trained field data collectors (one recorder and one observer) observed all motor vehicles travelling in the same direction at the study location, measured speeds, and collected data as per the study checklist. Data for speeding were collected session-wise for 3 days and 3 nights between 7:30 am to 12:00 am (7 sessions per day, 90 minutes per session) in each location and entered on the KoBoCollect application v2021.2.4 using a hand-held Android tablet. The data collectors positioned themselves in an inconspicuous location to minimise their visibility to drivers and to avoid influencing vehicle speeds. This positioning allowed the observer to clearly view oncoming vehicles while maintaining accurate and unobtrusive data collection.
If more than one motor vehicle was passing in the direction of observation at the same time, the vehicle closest to the curb/side of the road was observed. Data were collected (by observation) regarding location, observed sex (male, female), type of vehicle, vehicle ownership (based number plate colour: Black, personal; Yellow, commercial), vehicle speed (kilometres per hour, km/h).
Data management
Once a week, data were downloaded from the KoBoCollect application v2021.2.4 and checked for completeness and quality of data collection. Routine and surprise field visits were made to monitor the data collection process. All incomplete sessions, sessions rained out or stopped due to local interference were repeated for a full 90 minute duration to ensure completeness in data collection.
Statistical analysis
Data were checked for normal distribution using the Shapiro-Wilk test and based on the distribution, mean (SD) or median speeds (IQR) were presented for each type of vehicle, type of road, rural and urban/rural location, and by time. The proportion of drivers speeding (%) is presented with 95 percent confidence intervals. Differences in median speeds between urban and rural areas were compared using the Mann-Whitney U test. Further, univariate and multivariate logistic regression analyses were conducted for different types of vehicles, roads, and time of observation to understand the factors associated with speeding. For the regression analyses, sedans/saloons and SUVs were grouped under ‘Four-wheelers’; pickup/light trucks, trucks/large trucks, bus, and minibus were combined into ‘Buses and trucks’; and three-wheelers and other vehicles were merged into a single category, 'Three-wheelers and others.
Results
Baseline differences in urban and rural vehicles
Table 1 presents the baseline characteristics of the observed vehicles in urban and rural areas. Approximately 60 percent of the assessed buses, minibuses, motorcycles, light pickup trucks, sedans, and SUVs were from urban Bengaluru. Motor vehicles classified as others (including tractors, tillers, and cranes) were more common in rural areas (62%) than urban areas (38%). The majority of three-wheelers (78%) were from urban areas.
The proportion of vehicles observed on national highways was similar in both urban and rural districts of the BMR. However, a significantly higher proportion of vehicles were seen on state highways, collector roads, arterial roads, and inner roads in urban Bengaluru (p<0.05). Urban areas also had a significantly higher proportion of female drivers compared to rural areas. The peak vehicle counts in urban areas occurred between 5:30 pm and 7:00 pm, while in rural areas, the highest number of vehicles was observed between 12:30 pm and 2:00 pm.
Vehicular speeds in urban and rural areas
The detailed breakdown of average vehicle speeds in urban and rural areas by vehicle type, road type is presented in Table 2. Drivers’ overall median vehicle speed in the Bengaluru Metropolitan Region was 50 km/h. In rural areas, drivers’ median speed is statistically significantly higher, at 57 km/h, which is 7 km/h faster than the overall median speed in BMR. The median speed for motorcycle riders was consistent across both rural and urban areas. Among all vehicle types, the highest average speeds were recorded for drivers of SUV (urban areas, 52 km/h; rural areas 72 km/h).
Drivers’ average speed varied throughout the day. In both urban and rural districts, speeds tend to be higher in the morning, followed by a decline, and then an increase around 2pm in rural areas and around 4pm in urban areas. Another decrease in speeds occurred in the evening, with speeds rising again at approximately 7pm in rural areas and 8pm in urban areas. The highest average speeds were recorded in late night (11pm), reaching 60 km/h in rural districts and 51 km/h in urban districts.
Prevalence of speeding (%)
Table 3 presents the specific prevalence of drivers who were recorded speeding in urban and rural vehicle speeds, by different covariates such as type of vehicle and road in Bengaluru Metropolitan Region. Nearly one-third (30%) of drivers were observed to be speeding, exceeding the prescribed road speed limits in the BMR region. The prevalence of speeding is significantly higher in rural areas (39.9%) than in urban areas (24.3%) (p<0.001). Among the various vehicle types, drivers of SUV were observed to have the highest prevalence of speeding, with 44 percent exceeding the speed limit. Significant non-compliance was also observed among motorcycle riders who were recorded speeding in both urban (18%) and rural (30%) areas.
Analysis by road type revealed that on national highways within the BMR region, over a third of all motor vehicles (36%) were exceeding the speed limits. This trend is consistent in urban areas, where nearly half (46%) of vehicles on national highways were observed speeding. This is even higher in rural areas with almost two thirds (65%) of all vehicles on inner roads observed exceeding the speed limit.
The proportion of drivers observed speeding increased markedly in both rural and urban areas after 7pm. Additionally, distinct peaks in speeding are noticeable around 2-3pm in both regions.
Speeding and its associated factors
Table 4 presents the factors associated with speeding for rural and urban regions of BMR. The regression analysis for rural regions reveals significant associations between road type, vehicle type, and time of day with speeding. Among road types, there were markedly higher odds for state highways (Adjusted OR: 2.21) and inner roads (Adjusted OR: 4.14) compared to arterial roads, while National Highways had substantially lower odds (Adjusted OR: 0.19). For vehicle types, drivers of four-wheelers demonstrated elevated odds (Adjusted OR: 5.85) relative to riders of two-wheelers, while drivers of three-wheelers and other vehicles show notably reduced odds (Adjusted OR: 0.46). Regarding the time of day, nighttime was the reference category, with reduced odds (Adjusted OR) for drivers observed speeding in the afternoon (0.93) and evening (0.82).
In the urban region, drivers showed elevated adjusted odds for speeding on national highways (Adjusted OR: 4.41) and inner roads (Adjusted OR: 3.26) compared to arterial roads, whereas drivers on state highways exhibit lower odds (Adjusted OR: 0.75). Regarding drivers of different vehicle types, two-wheelers served as the reference group, with drivers of buses and trucks demonstrating reduced odds (Adjusted OR: 0.87) with slightly higher odds among drivers of four wheelers (Adjusted OR: 1.83) and three-wheelers/others (Adjusted OR: 1.22). For the time of day, nighttime is the reference category, and all other time periods show reduced odds for drivers speeding (morning, Adjusted OR: 0.56; afternoon, Adjusted OR: 0.52; evening, Adjusted OR: 0.53).
Discussion
This large-scale study investigated urban-rural disparities in driver speeds within the Bengaluru Metropolitan Region. Speed measurements were conducted by trained investigators using a globally recognised protocol, ensuring the accuracy and reliability of the study findings. Our study benefits from the randomness of the sample selection, enhancing the generalisability of our results across diverse urban and rural contexts. Also, the methodological rigour of site selection and stringent monitoring protocols ensured data integrity throughout the study. By employing these robust methodologies, our study provides in-depth insights into the complexities of drivers’ vehicle speed variations across diverse settings within the Bengaluru Metropolitan Region. To the best of our knowledge, there is no such study where drivers’ vehicle speed in urban and rural regions has been compared.
These study findings are consistent with evidence from Indian road-traffic studies. For example, speed-flow measurements on undivided rural national highways documented free-flow speeds of cars and two-wheelers under varying roadway widths, supporting our rural speed results under similar heterogeneity (Shah & Gupta, 2016). Further, studies that analysed arterial streets in Indian cities reported speed distributions on urban roads under mixed traffic conditions that broadly align with our urban speed estimates (Patel & Joshi, 2014).
An increase in average speed is directly related to both the likelihood of a crash occurring and the severity of consequences (Doecke, 2020). The correlation between mean speed and crash risk, as emphasised by WHO (2008), highlights the potential consequences of exceeding recommended speed limits. Specifically, for every 1 percent increase in mean speed, there is a corresponding 4 percent increase in fatal crash risk and a 3 percent increase in serious crash risk (Nilsson, 2004). The increased probability is due to elevated speeds heightening the risk of road crashes for several reasons, including increased likelihood of losing vehicle control, failure to anticipate oncoming hazards promptly, and causing other road users to misjudge the vehicle’s speed. Previous literature indicates that drivers report a range of reasons for exceeding posted speed limits, including being in a hurry or responding to emergencies, not realising they were speeding, intentional speeding, perceptions that speed limits are too low, prevailing road or traffic conditions, habitual behaviour, conformity beliefs (e.g., that “everybody does it”), attempts to overtake other vehicles, and confidence in the power or performance of their vehicle (Alonso Plá et al., 2013). Notably, a significant proportion of drivers consider themselves above average in skill, with surveys across multiple countries revealing that up to 90 percent of drivers perceive themselves as low-risk drivers (Elvik, 2013). This perception might lead drivers to believe they can exceed speed limits without significantly increasing their risk. Moreover, external pressures, such as those exerted by fleet managers and employers for increased productivity, can contribute to increased speeds, especially in the realm of public transport where operators and drivers face pressure to adhere to challenging timetables and, at times, rush to pick up passengers and goods (WHO, 2023). Furthermore, the WHO (2008) reported that a mere 5 percent reduction in average speed could yield a substantial 20 percent reduction in fatalities. Applying this model to the BMR context suggests that even small reductions in mean speeds could translate into meaningful decreases in fatalities from crashes, highlighting the strong public health value of effective speed management.
The median speeds observed in our study deviate significantly from the prescribed limits, particularly in rural areas. In India, posted speed limits are not based on whether a region is rural or urban but rather on the type of vehicles and roads. WHO (2008) recommends that urban speed limits do not exceed 50 km/h with even lower limits of 30 km/h recommended for residential and areas with high pedestrian activity. Our findings showed that the median speed in urban areas (46 km/h) aligns with the upper speed of the WHO recommendation. However, the media speed in rural areas averaged 57 km/h but there are no rural specific guidelines for comparison.
The variation in vehicle speeds between urban and rural areas can be attributed to the distinct characteristics inherent in each setting. The fundamental differences between urban and rural areas extend to the density of road networks, land use, and travel patterns (IIHS-HLDI, 2017). Key elements of the driving environment, including roadway alignment, cross-section design, roadside features, advisory speeds, and speed limits, all play pivotal roles in influencing road crash causation (IIHS-HLDI, 2017). The comparison of factors associated with rural and urban vehicle speeding in BMR revealed distinct differences. In rural areas, state highways and inner roads were associated with higher odds of speeding, while national highways have significantly lower odds, likely due to lower traffic density and enforcement differences. Conversely, in urban areas, national highways and inner roads showed higher odds of speeding, whereas state highways have reduced odds, possibly in response to better regulation or infrastructure differences. Four-wheelers show substantially higher odds of speeding in rural areas compared to urban areas, which might be attributed to more open road conditions in rural settings.
Notably, the disparity in traffic density, the prevalence of large trucks, and the presence of bicyclists and pedestrians sharing the road all contribute to variations in vehicle speeds between rural and urban roads (Tingey, 2020). Buses and trucks exhibit reduced odds of speeding in urban areas, likely due to higher traffic congestion and the necessity for frequent stops. In rural settings, farmers, commuters, school buses, trucks, and tourists often traverse narrow roads with limited sight distance, unclear roadsides and reduced enforcement. Unlike urban roads, rural thoroughfares lack the frequent interruption of traffic signals, stop signs, and congestion, allowing for higher sustained speeds (Federal Highway Administration, 2025). Notably, fatality rates on rural roads are significantly higher compared to those on urban roads. This is directly related to post-crash care as in rural areas, the challenging conditions of rough terrain, lower vehicle traffic extending the time between a crash and its discovery, all contribute to the heightened severity of injuries for rural travellers (Federal Highway Administration, 2025). Moreover, the availability of trauma care is often limited in rural areas, further exacerbating the outcomes of road crashes (Morgan & Calleja, 2020). This interplay of road conditions, regulatory factors, and environmental characteristics creates a diverse driving experience, influencing the speed dynamics observed in urban and rural areas.
Study findings also revealed that speeding was more prevalent in rural areas compared to urban regions of BMR across all types of motor vehicles. Notably, drivers of SUVs had the highest propensity for speeding in urban (52 km/h) and rural areas (72 km/h).
This finding is especially important given the evolving market dynamics and the rising dominance of SUVs in India. The SUV market share has increased in fiscal years from 2022 fiscal year (40.1%) to 2024 (50.4%) with projections indicating a further rise by the end of the fiscal year 2025 (54-55%). This trend evidences the ongoing trend in buyer preference for SUVs (Jacob & Patel, 2024) and underscores that there is likely to be a persistent risk of speeding behaviours across the nation, given SUV drivers’ increased propensity for exceeding speed limits.
Time of day patterns indicate a consistent trend across rural and urban regions, with significantly reduced odds of speeding during the afternoon, and evening compared to nighttime. However, the magnitude of reduction differs slightly between urban and rural areas, which could reflect variations in traffic flow, lighting conditions, and enforcement activities during these periods. Furthermore, when analysing speed patterns by road type, speeds tend to be higher in rural areas across all categories, except national highways. Interestingly, our findings indicate that there is minimal disparity in speeding tendencies in both rural and urban areas across different times of the day. This suggests a consistent trend of speeding behaviour regardless of the time, emphasising the need for targeted interventions to address this issue.
Acknowledging the previously stated statistics, it’s evident that speeding significantly contributes to road crashes and associated fatalities and injuries both nationally and within BMR. The distribution of healthcare facilities between urban and rural areas presents a significant disparity, with rural regions often experiencing limited access to critical care services. This discrepancy becomes particularly concerning when considering the higher likelihood of road crashes in rural areas, largely attributable to speeding. Despite the elevated risk of crashes, the lack of proper healthcare facilities in rural settings increases the likelihood of fatalities resulting from road crashes.
The UN Decade for Road Safety specifies 12 voluntary targets, one of which was to halve the proportion of vehicles travelling over the posted speed limit and achieve a reduction in speed-related injuries and fatalities by 2030, as decided by the United Nations General Assembly (WHO, n.d.). We recommend median speed as an indicator to monitor progress toward shifting average speeds to the left of the curve.
Understanding speeds in urban and rural areas need to be correlated with injuries and fatalities between urban and rural in terms of the type of crash, severity, part of body injury, health-seeking behaviour, treatment, and outcomes. This needs a robust trauma registry in urban as well as rural areas which are linked with vehicle speed surveillance systems in place. While the development of hospital-based trauma registries is feasible through existing health information systems, challenges such as limited digital infrastructure, data standardisation, and inter-agency coordination may hinder implementation. Integrating trauma registries with existing digital reporting platforms (e.g., electronic health records, emergency medical services databases, police crash reporting systems) can improve real-time case capture, interoperability, and coordinated data use across sectors. Strengthening institutional capacity and ensuring policy-level commitment are essential to overcome these barriers. Additionally, speeding rates may be correlated with speed fines to monitor enforcement as well as measure the effectiveness of enforcement in the BMR region.
The primary focus of our study was to document speed differentials across urban and rural settings and also provide actionable insights to inform efforts to reduce road traffic injuries and fatalities. Higher median speeds and speeding prevalence in rural areas, where access to trauma care is limited, translate to a greater risk of severe injury or death in the event of a crash. By identifying the specific road types, vehicle categories, and times showcasing highest speeding rates, our data enable the implementation of context-specific interventions. For example, increased enforcement on specific road types, such as inner roads and state highways, could be prioritised. Feasible evidence-based speed-calming measures include installing speed humps and rumble strips on high-risk road segments, improving speed-limit signage and road markings, and expanding the use of enforcement tools such as average-speed cameras and automated speed detectors.
Strengths and limitations
Our study provides a rigorous methodology for speed observations that can be applied globally, particularly in locations where the conditions vary in urban compared to rural areas. In the local context, our study provides a baseline benchmark for future comparisons in BMR, with scope for expansion to other parts of the state.
Limitations of our study include the inability to record some parameters during nighttime due to poor visibility. In a couple of instances, data collection was stopped due to rain or security issues. Weighting for traffic volume or road length was not applied, as the primary aim was to estimate the prevalence of speeding among all observed vehicles across representative sites rather than to model network-level exposure. Additionally, the study did not distinguish between free-flow and congested traffic conditions, which may influence observed speed patterns and could be explored in future stratified analyses.
Conclusions
Our study shows a prevalent trend in high prevalence of speeding in BMR that was higher in rural areas than in urban areas. The median speed was nearly 18km/h higher in rural areas. Median speeds were significantly higher in SUVs and on all types of roads except national highways.
We recommend the government conducts annual or biennial observational assessments as part of routine road safety surveillance activities. This recommendation aligns with national and global road safety frameworks. India’s National Road Safety Policy and Ministry of Road Transport and Highways (MoRTH) action plans call for systematic, data-driven monitoring of key risk factors that includes speeding. Similarly, the WHO Global Plan for the Decade of Action for Road Safety 2021-2030 (WHO, n.d.) emphasises routine observational assessments of behavioural risks, including speed, as essential to achieving the 2030 fatality-reduction targets. Our proposed surveillance approach is consistent with these national priorities and global targets. These could be implemented through MoRTH in collaboration with state transport and traffic police departments and supported by public health and academic institutions for data analysis and reporting.
Additionally, we recommend the implementation of evidence-driven speed calming measures with a specific focus in rural areas. Our findings support the use of median speed as an evaluation indicator to monitor the shift of average speed to the left of the speed curve and reduce crash risk. Establishing trauma registries in urban and rural Bengaluru is essential to correlate vehicle speed data with hospital outcomes, enabling impact assessment of interventions on fatality, injury patterns, and associated burdens. These data-driven strategies, derived from real-world observations, can inform enforcement timing, target specific vehicle categories and road types, and ultimately contribute to the prevention of crashes, fatalities, and associated trauma on roads in BMR and similar settings.
Acknowledgements
We extend our gratitude to the NIMHANS management, including the Director, Registrar, Project Section, Principal Investigator, Project Coordinators, and field data collectors, for their contribution. We also appreciate the Johns Hopkins International Injury Research Unit and the Bloomberg Philanthropies Initiative for Global Road Safety (BIGRS) for their invaluable support. Additionally, we thank the Karnataka State Police, the Superintendents of Police of Bangalore Urban, Rural, and Ramanagara, the Bangalore Traffic Police, and the Karnataka State Road Safety Authority for their assistance.
AI tools
AI tools were not used in this study nor in the preparation of this paper.
Author contributions
PB was the primary author of the manuscript and helped in data analysis. GMS conceptualised the study and played an active role in data collection, monitoring, and analysis. NP contributed to the study’s ideation. PM was closely involved in both data collection and monitoring. RK coordinated the data collection. AP, AMN, and RG facilitated seamless data collection. GG and AB provided overall supervision for the study. All authors have read and agreed to the published version of the manuscript
Funding
This project is supported by Johns Hopkins International Injury Research Unit through Bloomberg Philanthropist Initiative for Global Road Safety (BIGRS).
Conflicts of interest
The authors declare that there are no conflicts of interest.