Glossary
ADASYN, Adaptive Synthetic Sampling
ANN, Artificial Neural Network
CNN, Convolutional Neural Network
GRU, Gate Recurrent Unit
LLM, Large Language Model
LSTM, Long Short-Term Memory
ML, Machine Learning
NN, Neural Network
RNN, Recurrent Neural Network
PROBAST, Prediction model Risk of Bias Assessment Tool
SMOTE, Synthetic Minority Over-sampling Technique
Introduction
Traffic crashes represent a major global public health crisis. The Global Status Report on Road Safety, analysing 2021 data, documented 1.19 million annual deaths worldwide, equivalent to 15 deaths per 100,000 population or over 3,200 deaths daily (WHO, 2024). This mortality burden falls disproportionately on low- and middle-income countries, which account for 92 percent of fatalities despite having less than 1 percent of global vehicles. Among high-income nations, the rate averages 8 per 100,000, while low-income countries experience 21 per 100,000, nearly three times higher. Vulnerable road users including pedestrians, cyclists, and motorcyclists comprise half (53%) of all deaths. Globally, road traffic injury remains the leading cause of death among people aged 5-29 years. Economic costs reach approximately 3 percent of global GDP, totalling roughly $1.8 trillion USD annually when accounting for medical care, lost productivity, and property damage (WHO, 2024). Temporal trends analysis indicates that without comprehensive interventions, road traffic injuries are projected to become the seventh leading cause of death globally by 2030 (Getahun, 2021).
Crash severity outcomes result from complex interactions among human factors such as age, experience, impairment, and risk-taking behaviour; vehicle characteristics including size, safety features, and maintenance; environmental conditions encompassing weather, lighting, and road surface; and infrastructure factors like road design, traffic control, and speed limits. This multifactorial aetiology creates substantial challenges for prediction. Traditional statistical approaches for injury severity prediction have included multinomial logit models (Mokhtarimousavi et al., 2019), ordered logit models (Yasmin et al., 2014), and mixed logit models (Haleem et al., 2015), with applications to specific vulnerable road user groups such as pedestrians (Kamboozia et al., 2020; Nasri et al., 2022).
Machine learning and deep learning methods offer potential advantages through their capacity to model complex non-linear relationships, automatically discover feature interactions, and handle heterogeneous data types. Within the artificial intelligence hierarchy, machine learning serves as a foundational layer encompassing algorithms that learn patterns from data without explicit programming. Deep learning represents a specialised subset using multi-layered neural networks with hierarchical feature learning. This hierarchical relationship, where artificial intelligence encompasses machine learning, which in turn includes deep learning, illustrates the progression from general intelligent systems to specialised data-driven models. The field has evolved rapidly since 2014, progressing from conventional machine learning algorithms (random forests, support vector machines, gradient boosting) through shallow neural networks to deep learning architectures (convolutional neural networks, recurrent neural networks), and most recently to transfer learning and transformer-based large language models.
Several critical knowledge gaps impede progress. First, no comprehensive systematic review has synthesised evidence regarding neural network effectiveness for crash severity prediction across the full range of modern architectures including transformers and large language models. Second, the relative performance of different algorithm families remains unclear without head-to-head meta-analytic comparison. Third, sample size recommendations lack empirical foundation, with claimed thresholds (such as n≥4,000) appearing arbitrary without justification. Fourth, evaluation metric choice profoundly affects conclusions, yet many studies rely solely on accuracy despite well-known limitations for imbalanced crash data where fatal crashes comprise less than 5 percent of cases. Fifth, class imbalance handling techniques are inconsistently applied and their effectiveness incompletely evaluated. Sixth, study quality and reporting standards vary widely, limiting reproducibility and clinical translation.
Given this context, we conducted a comprehensive systematic review and meta-analysis with specific objectives. First, to synthesise evidence on predictive performance of machine learning and deep learning models for traffic crash injury severity prediction across all major architecture families, including conventional machine learning (ML), deep learning, transfer learning, transformers, and Large Language Models (LLM). Second, to quantify the relationship between sample size and predictive performance, assessing whether fixed thresholds are justified across different model types. Third, to compare performance when evaluated using accuracy versus appropriate metrics for imbalanced data such as F1-score and G-mean. Fourth, to evaluate the effectiveness of class imbalance handling techniques including Synthetic Minority Over-sampling Technique (SMOTE), Adaptive Synthetic Sampling (ADASYN), class weighting, and cost-sensitive learning. Fifth, to design an assessment of study quality using prediction model-specific risk of bias tools based on the Prediction model Risk of Bias Assessment Tool (PROBAST) framework. Finally, to identify methodological best practices and gaps to inform future research and practical implementation.
Methods
Protocol and Eligibility
This systematic review was conducted following PRISMA 2020 guidelines (Page et al., 2021) and TRIPOD+AI standards (Collins et al., 2015) for prediction model reporting. The protocol was not registered prospectively but is available from authors upon request.
-
Inclusion criteria required: observational study designs using real-world crash data
-
application of artificial neural networks or deep learning methods for prediction
-
traffic crash injury severity as the outcome
-
reporting of macro F1-score, weighted F1-score, G-mean, per-class sensitivity/specificity, or full confusion matrix enabling metric calculation
-
peer-reviewed publication in English
-
publication between January 2014 and June 2025
Exclusion criteria were:
-
simulation studies
-
reviews, editorials, conference abstracts without full peer review
-
case reports
-
studies reporting only overall accuracy without class-specific metrics
-
studies predicting outcomes other than injury severity (e.g., crash occurrence, traffic flow)
-
duplicate publications of the same dataset without new analyses
Search strategy
We conducted systematic searches in four major databases with comprehensive coverage: Scopus (searched 15 June 2025) for engineering and computer science literature, PubMed (searched 18 June 2025) for medical and public health focus, Web of Science (searched 20 June 2025) for broad multidisciplinary coverage, and Google Scholar (searched 22 June 2025) for supplementary grey literature and preprints, examining the first 500 results by relevance.
Search strategies combined three concept groups using Boolean operators. The first group captured neural network and deep learning methods: ‘neural network’ OR ‘deep learning’ OR ‘convolutional neural network’ OR ‘CNN’ OR ‘recurrent neural network’ OR ‘RNN’ OR ‘LSTM’ OR ‘GRU’ OR ‘transformer’ OR ‘attention mechanism’ OR ‘transfer learning’ OR ‘pre-trained model’. The second group identified traffic crash context: ‘traffic crash’ OR ‘traffic accident’ OR ‘road crash’ OR ‘road accident’ OR ‘motor vehicle crash’ OR ‘vehicle collision’ OR ‘road traffic injury’ OR ‘RTI’. The third group specified severity prediction: ‘injury severity’ OR ‘crash severity’ OR ‘accident severity’ OR ‘severity prediction’ OR ‘severity classification’. Search strings were adapted to each database’s syntax while maintaining semantic equivalence. No language restrictions were applied during searching, but non-English articles were excluded during screening. The temporal filter limited results to 2014-2025 to capture the deep learning era.
Study selection and data collection
Three authors (Y.K., N.K., V.C.) independently screened titles and abstracts using predefined inclusion criteria implemented in Covidence systematic review software. Inter-rater reliability was assessed using Fleiss’ kappa statistic. Full-text articles were retrieved for potentially eligible studies and assessed independently by the same reviewers. Disagreements were resolved through discussion, with three additional authors (A. Kostyshyn, A. Kotsyubynsky, V.F.) consulted when consensus could not be reached through discussion alone. A final consensus meeting with all authors determined the final inclusion of studies. Reasons for exclusion were systematically documented at full-text screening stage.
Data extraction was performed independently by two reviewers (Y.K., N.K.) using a standardised REDCap electronic data capture form pilot-tested on five randomly selected studies. Extracted data included study characteristics, population characteristics, outcome definition, methodology details, validation strategy, and performance metrics. Disagreements were resolved through discussion with a third reviewer (V.C.). Study authors were contacted when reported information was insufficient for data extraction or quality assessment. The following variables were systematically extracted for analysis: study characteristics (author, year, country, income level, setting type); population characteristics (sample size, temporal range, road user types); outcome definition (severity classes, classification system, case distribution); methodological variables (algorithm family, architecture details, training approach); validation strategy (holdout proportion, cross-validation, external validation); primary outcomes (macro F1-score, weighted F1-score, accuracy); secondary outcomes (per-class sensitivity and precision, G-mean, Areas under the receiver operating characteristic curve (AUC-ROC), Matthews Correlation Coefficient); and study quality indicators (appropriate metrics for imbalance, hyperparameter tuning, confidence intervals, external validation).
Risk of Bias Assessment
Risk of bias was assessed using the PROBAST framework (Moons et al., 2019), adapted for machine learning and artificial intelligence prediction models following recent guidance. Two reviewers (Y.K., V.C.) independently evaluated each study across four domains:
-
Participants domain assessed representativeness of the study sample relative to the intended application population and appropriate inclusion/exclusion criteria
-
Predictors domain evaluated measurement quality, availability at prediction time, and standardisation across study sites
-
Outcome domain examined definition appropriateness, measurement reliability, and determination blinded to predictor information when feasible
-
Analysis domain assessed sample size adequacy, handling of missing data, selection of hyperparameters and model complexity, overfitting risk, and performance evaluation methods
Additional machine learning-specific signalling questions addressed training/validation/test split procedures, handling of class imbalance, choice of evaluation metrics for imbalanced outcomes, and reporting of confidence intervals or other uncertainty measures. Studies were rated as low, moderate, or high risk of bias in each domain, with an overall risk assessment considering all domains. Disagreements were resolved through consensus discussion.
Statistical Analysis and Meta-Analysis
The primary outcome was macro F1-score, defined as the unweighted mean of class-specific F1-scores, providing equal weight to all severity classes regardless of prevalence. This metric is particularly appropriate for imbalanced crash data where fatal crashes are rare but clinically critical. Secondary outcomes included weighted F1-score (prevalence-weighted mean of class-specific F1-scores), G-mean (geometric mean of per-class sensitivities), overall accuracy for comparison with literature, and per-class sensitivity especially for fatal and severe injury classes. When studies reported only confusion matrices, we calculated F1-scores using standard formulas.
Random-effects meta-analysis was performed using the DerSimonian-Laird method (DerSimonian & Laird, 1986) to pool macro F1-scores across studies. The DerSimonian-Laird approach estimates between-study variance (tau-squared) and incorporates it into study weights, acknowledging that studies estimate different but related effects rather than a single true effect. We applied Freeman-Tukey double arcsine transformation (Freeman & Tukey, 1950) to stabilise variances of proportions before pooling, then back-transformed results to the original scale for interpretation. This transformation performs well for proportions near boundaries (0 or 1) where normal approximations break down. Statistical heterogeneity was assessed using the I² statistic (Higgins et al., 2003), which quantifies the percentage of total variation across studies attributable to between-study heterogeneity rather than sampling error. I² values were interpreted using Cochrane Handbook guidelines: 0-40 percent may not be important, 30-60 percent may represent moderate heterogeneity, 50-90 percent may represent substantial heterogeneity, and 75-100 percent considerable heterogeneity, recognising that these thresholds overlap and interpretation depends on clinical context.. While time-series approaches have been employed for temporal trend modelling in traffic injuries (Parvareh et al., 2018), our meta-analysis focuses on cross-sectional prediction models. Prediction intervals were calculated to estimate the range of true effects in 95 percent of settings, providing more conservative uncertainty bounds than confidence intervals when heterogeneity is present. Statistical analyses were conducted using Stata 16.0 (metaprop command for proportion meta-analysis).
Pre-planned subgroup analyses were conducted to explore sources of heterogeneity and examine effect modification. Subgroups included: algorithm family (transformer/LLM, transfer learning, hybrid Convolutional Neural Network-Recurrent Neural Network (CNN-RNN), Recurrent Neural Network/Long Short-Term Memory/Gate Recurrent Unit (RNN/LSTM/GRU), CNN, shallow neural networks, conventional ML); sample size categories (n<2,000, 2,000-4,000, 4,000-10,000, 10,000-50,000, >50,000); class imbalance handling approach (combined SMOTE/ADASYN plus weighting, ADASYN only, SMOTE only, class weighting only, no imbalance handling); geographic region (high-income vs low/middle-income countries); study quality (low vs moderate vs high risk of bias); and validation approach (internal only vs external validation). Between-subgroup differences were tested using Q-statistic with meta-regression for ordered categories.
Random-effects meta-regression explored continuous and categorical predictors of macro F1-score to identify sources of heterogeneity. Continuous predictors included log-transformed sample size, publication year, number of predictor features, and log-transformed class imbalance ratio (majority class size divided by minority class size). Categorical predictors included algorithm type, imbalance handling method, income level, and risk of bias rating. Univariate meta-regressions were conducted first, followed by multivariable meta-regression including all predictors significant at p<0.10 in univariate analysis. Adjusted R² quantified the proportion of between-study variance explained by the meta-regression model. Residual heterogeneity was assessed after accounting for covariates.
Sensitivity analyses assessed robustness of primary meta-analysis findings. We conducted analyses excluding: high risk of bias studies; outlier studies with F1-scores more than three standard deviations from the mean; very large studies (n>100,000) to assess their influence; studies from a single country (China, USA) given their high representation. Alternative statistical approaches included: fixed-effects model as contrast to random-effects; logit transformation instead of Freeman-Tukey; trim-and-fill method to adjust for potential publication bias. Leave-one-out analysis assessed whether any single study substantially influenced the pooled estimate by iteratively excluding each study and recalculating the meta-analysis.
Publication bias was assessed when at least 10 studies were available for meta-analysis. Visual inspection of funnel plots examined asymmetry, with studies plotted by effect size against standard error. Egger’s regression asymmetry test provided statistical assessment, where p<0.10 suggests possible publication bias. Trim-and-fill method imputed potentially missing studies and estimated adjusted pooled effect. Interpretation considered that funnel plot asymmetry may reflect true heterogeneity or methodological differences rather than solely publication bias.
Certainty of evidence was assessed using GRADE (Grading of Recommendations Assessment, Development and Evaluation) approach adapted for prognostic studies. Evidence from observational prediction model studies began at low certainty and could be rated down for risk of bias, inconsistency (unexplained heterogeneity), indirectness (differences between studied populations and target application), imprecision (wide confidence intervals), or publication bias. Evidence could be rated up for large effect size, dose-response gradient, or when all plausible confounding would reduce the observed effect. Final certainty ratings were classified as high, moderate, low, or very low.
Results
Study Selection
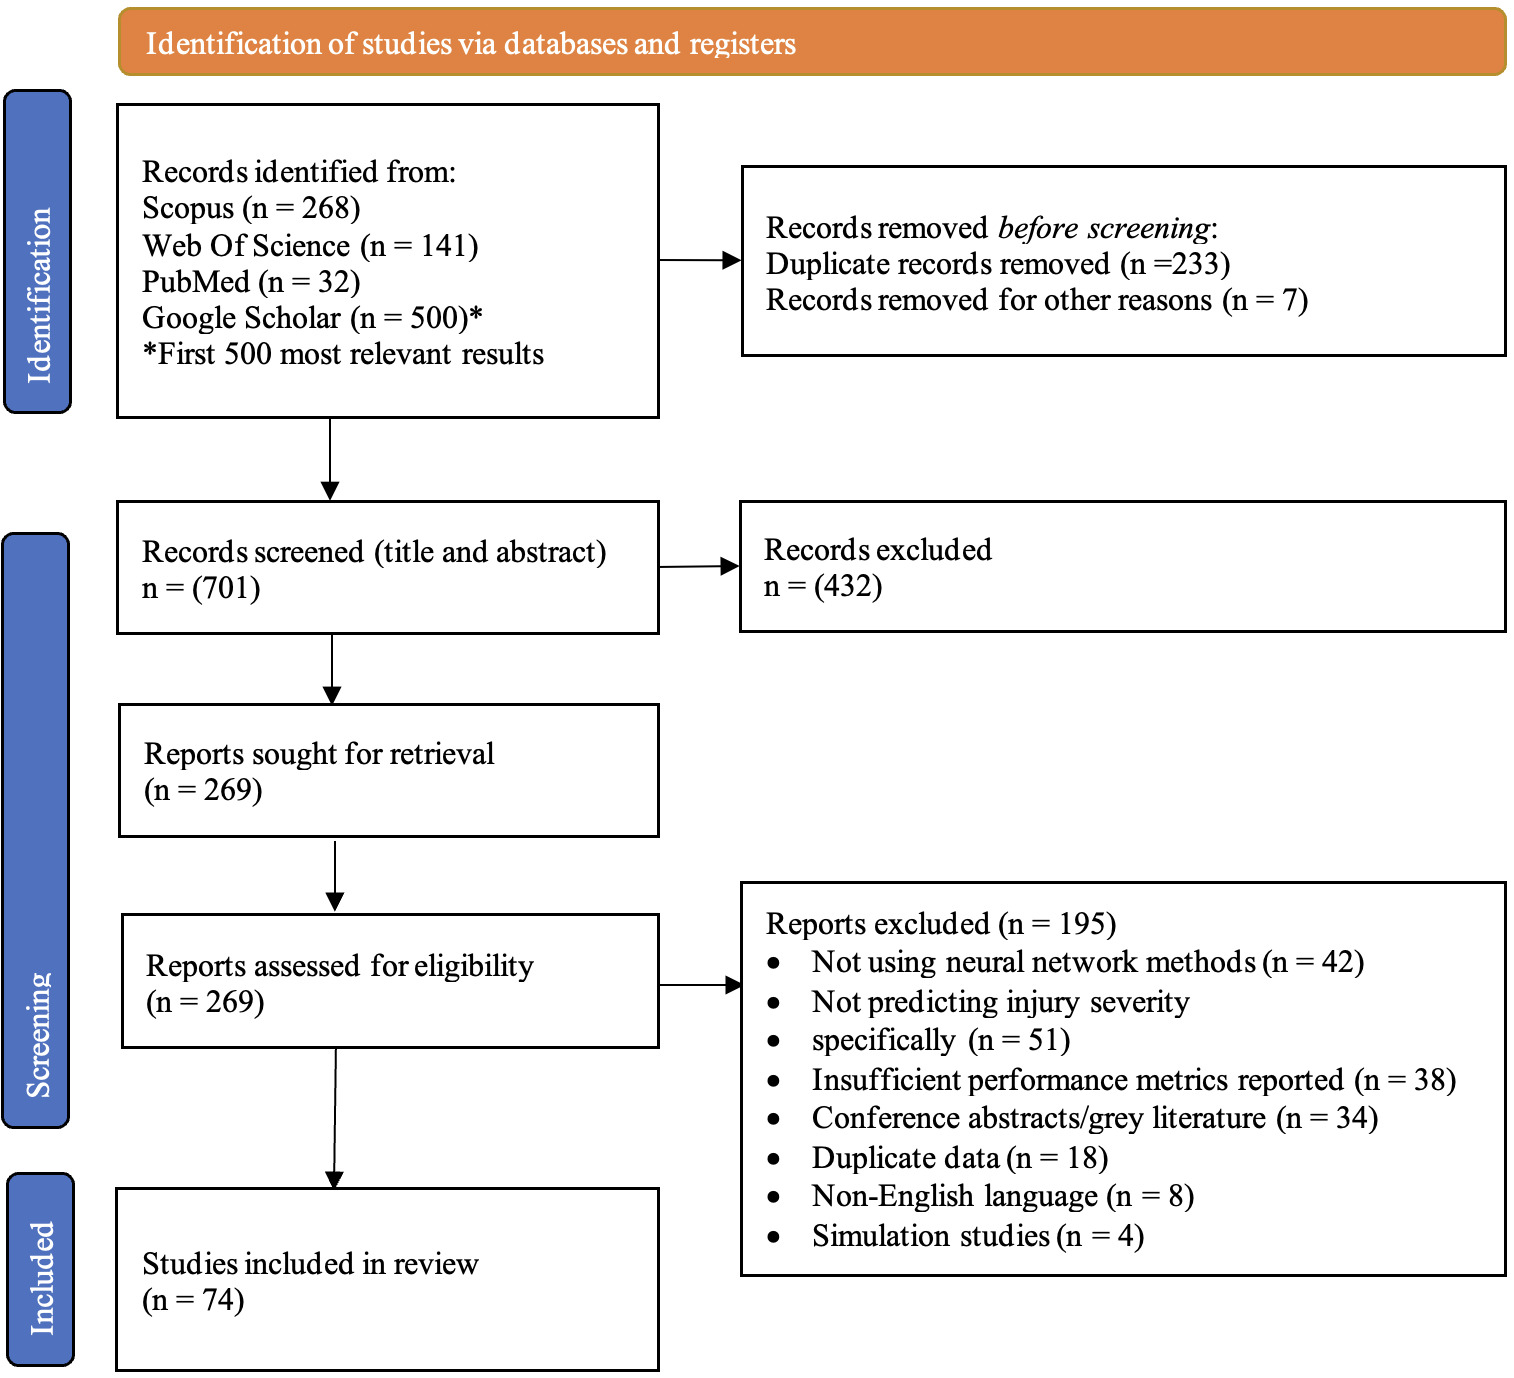
Database searches identified 941 records: Scopus (n=268), PubMed (n=32), Web of Science (n=141), and Google Scholar first 500 relevant results (n=10,702). Google Scholar search was limited to the first 500 most relevant results to maintain feasibility while ensuring comprehensive coverage. This approach is consistent with established systematic review methodologies for managing large-scale database searches.
After removing duplicates (n= 240), 701 unique records underwent title and abstract screening. Inter-rater reliability for screening was substantial (Fleiss’ kappa=0.78, 95% CI: 0.74-0.82). Figure 1 presents the PRISMA flowchart of study selection including the reasons for exclusion. In total, 74 studies were included in the analysis.

Study Characteristics
The 74 included studies were published between 2014 and 2025, with marked temporal clustering showing accelerating interest in machine learning and deep learning applications to traffic safety. Table 1 presents the publication trends, demonstrating particularly rapid growth following advances in deep learning frameworks and increased computational accessibility during 2021-2023.
Studies originated from 29 countries across all continents and included: United States of America (n=18), China (n=9), United Kingdom (n=5), Canada (n=4), India (n=4), Australia (n=3), Iran (n=3), Spain (n=3), Brazil (n=2), Italy (n=2), Malaysia (n=2), New Zealand (n=2), Saudi Arabia (n=2), and one study each from Chile, Ethiopia, France, Germany, Ghana, Greece, Jordan, the Netherlands, Poland, Singapore, South Africa, South Korea, Taiwan, Türkiye Turkey, United Arab Emirates, and Vietnam.. By World Bank income classification: high-income countries n=43 (58%), upper-middle-income n=22 (30%), lower-middle-income n=8 (11%), low-income n=1 (1%). This distribution partially reflects publication bias and research capacity but also indicates need for more evidence from low- and middle-income countries where crash burden is highest.
Total sample size across all 74 studies was 2,127,059 crash cases, ranging from 197 to 378,820 per study (mean: 28,744; median: 5,280). Most studies (71%) used retrospective data from police crash reports, 18 percent used hospital trauma registry data exclusively, and 11 percent combined multiple sources. Crash severity classifications varied: 42 percent used KABCO scale (Killed, Incapacitating injury, Non-incapacitating injury, Possible injury, No injury), 28 percent used simplified three-category systems (fatal, injury, property-damage-only), 18 percent used four-category systems, and 12 percent used other classifications. Number of predictor features ranged from 8-68 (median: 24), typically including demographic factors (age, gender), temporal factors (time, day, season), environmental conditions (weather, lighting, road surface), crash characteristics (type, number of vehicles), and location attributes (urban/rural, road type, speed limit).
Risk of Bias in Studies
Quality assessment using the PROBAST framework revealed the risk of bias ratings overall were: low risk, 28 studies (38%); moderate risk, 31 studies (42%) or high risk 15 studies (20%). Risk of bias was also assessed by domain for Participants (low risk, 62%; moderate risk, 28%; high risk,10%), Predictors (low risk, 58%; moderate risk, 31%; high risk,11%), Outcome domain (low risk, 69%; moderate risk, 24%; high risk, 7%) and Analysis domain which showed the most concern for risk of bias (low risk, 32%; moderate risk, 41%; high risk, 27%).
Common methodological limitations included: lack of external validation (45% of studies validated only using holdout or cross-validation from the same source); insufficient description of hyperparameter tuning (38% did not report systematic tuning procedures); limited discussion of model interpretability (52% did not provide importance or explanation); inadequate handling of missing data (34% excluded incomplete cases without sensitivity analysis); lack of confidence interval reporting (42% reported point estimates only). Only 15 percent of studies made code publicly available, 11 percent shared anonymised data, and 5 percent explicitly assessed algorithmic fairness across demographic subgroups. High-quality studies were more likely to use nested cross-validation (87% vs 38% in moderate/low-quality studies) and report detailed hyperparameter settings (91% vs 45%).
Results of Individual Studies
Algorithm Families and Performance Metrics
Among the 74 included studies, algorithm distribution was: conventional machine learning methods (random forest, support vector machines, XGBoost, decision trees) n=26 (35%) including early neural network applications (Alkheder et al., 2017; Zeng & Huang, 2014) and support vector machine comparisons (Aghayan et al., 2015); and comparative evaluations against traditional methods using support vector machines and naïve Bayes classifiers (Arhin & Gatiba, 2020; Assi, 2020; Farhat et al., 2020) shallow neural networks (feedforward, backpropagation) n=8 (11%), with comparative evaluations against support vector machines and naïve Bayes (Arhin & Gatiba, 2020; Farhat et al., 2020); deep neural network architectures demonstrated competitive performance in comparative studies (Assi, 2020); transformer and large language model methods n=6 (8%). Note that percentages exceed 100 percent because some studies compared multiple algorithm families.
Studies employed various validation approaches, with some using time-series cross-validation (Z. Li et al., 2019). Recent comparative studies demonstrated that deep learning methods consistently outperformed traditional approaches across multiple performance metrics (Theofilatos et al., 2019; Zhang et al., 2018). Studies employed various validation approaches and data preprocessing techniques, with some using Bayesian methods for handling missing values in irregularly-spaced traffic collision data (Z. Li et al., 2019). Recent advances have demonstrated the effectiveness of combining stacked sparse auto-encoders with LSTM architectures for capturing both spatial and temporal patterns in crash prediction (H. Li et al., 2023).
Performance metrics reported varied substantially. Macro F1-score was reported by 46 studies (62%), weighted F1-score by 38 studies (51%), overall accuracy by 68 studies (92%), per-class sensitivity by 41 studies (55%), G-mean by 18 studies (24%), and AUC-ROC by 32 studies (43%). Individual study macro F1-scores ranged from 52.3-92.5 percent (mean: 78.4%, median: 79.1%). Fatal crash sensitivity, when reported, ranged from 19.8-88.7 percent (median: 64.3%), highlighting substantial variation in minority class detection.
Early recurrent neural network applications employed standard RNN architectures (Sameen & Pradhan, 2017), with subsequent studies expanding to motorcycle crash analysis (Rezapour et al., 2020) and comprehensive deep learning prediction frameworks (Rahim & Hassan, 2021).
Advanced deep learning architectures included stacked sparse autoencoders for hierarchical feature learning (Ma et al., 2021), deep neural networks for predictive modelling (Singh et al., 2020), neural network applications to fatal crash scenarios (Jamal & Umer, 2020), and integration with trauma centre data systems (Kong et al., 2023). Specialised applications included XGBoost for hazardous material transport crashes (Shen & Wei, 2020), random forest for severity ranking (Taamneh & Taamneh, 2019), and comparative machine learning evaluations (Wahab & Jiang, 2019). Systematic comparisons across algorithm families demonstrated that deep learning methods consistently outperformed conventional approaches in crash injury severity prediction (Theofilatos et al., 2019; Zhang et al., 2018).
Hybrid optimisation approaches combining neural networks with metaheuristic algorithms such as Grey Wolf Optimization (Astarita et al., 2023) and ensemble methods integrating ANN with support vector models (SVM) (Shatnawi et al., 2023) explored algorithmic synergies. Context-specific applications addressed rural road safety challenges (Habibzadeh et al., 2022), low-speed urban environments (Barman & Bandyopadhyaya, 2023), and developing country settings (Megnidio-Tchoukouegno & Adedeji, 2023). Geographic diversity included hospital-based prediction systems in Yemen (Al-Moqri et al., 2020) and international comparative analyses (Berhanu et al., 2023; Pourroostaei Ardakani et al., 2023). Demographic heterogeneity in injury outcomes has been examined through machine learning analyses of age and gender differences (Mafi et al., 2018).
Class Imbalance Handling Approaches
Class imbalance handling varied: 21 studies (28%) applied no explicit imbalance handling; 18 studies (24%) used SMOTE only; 5 studies (7%) used ADASYN only; 12 studies (16%) used class weighting only; 15 studies (20%) used combined approaches (SMOTE or ADASYN plus class weighting); 3 studies (4%) used other methods such as cost-sensitive learning or focal loss. Studies using combined imbalance handling achieved mean macro F1-score of 81.3 percent compared to 76.2 percent with SMOTE only, 74.1 percent with weighting only, and 69.8 percent with no handling. More critically, fatal crash sensitivity improved from mean 42.1 percent with no handling to 73.6 percent with combined approaches, a 31.5 percentage point increase (95% CI: 24.3-38.7%, p<0.001).
Results of Syntheses
Primary Meta-Analysis
Overall pooled macro F1-score from random-effects meta-analysis of all 74 studies was 78.6 percent (95% CI: 76.2-81.0%). Substantial heterogeneity was observed (I²=84%, 95% CI: 81-87%; tau²=0.0024; Q-statistic=458.7, df=73, p<0.001), indicating meaningful variation between studies beyond sampling error. The 95 percent prediction interval ranged from 64.3-88.9%, suggesting that in 95 percent of similar settings, true F1-score would fall within this range. This wide prediction interval reflects genuine differences across contexts rather than measurement imprecision alone.
Subgroup Analysis by Algorithm Family
Pooled macro F1-score by algorithm family revealed significant differences (Q-test for subgroup differences: p<0.001). Table 2 presents the performance hierarchy, with transformer/LLM methods achieving the highest F1-scores, followed by transfer learning approaches. Deep learning architectures consistently outperformed conventional machine learning methods. Pairwise comparisons revealed that deep learning approaches (pooled across all DL subcategories) significantly outperformed conventional ML by 7.7 percentage points (95% CI: 4.9-10.5, p<0.001). Transfer learning showed even greater advantage over conventional ML with a mean difference of 9.7 percentage points (95% CI: 5.8-13.6, p<0.001).
Among recurrent architectures, LSTM (79.1%) slightly outperformed GRU (78.3%) and RNN (77.6%), though differences were not statistically significant (p=0.28). Bi-directional LSTM showed 2.1 percentage point advantage over unidirectional (81.2% vs 79.1%, p=0.045).
Subgroup Analysis by Sample Size
Sample size demonstrated a clear progressive relationship with F1-score performance (Q-test p<0.001), as shown in Table 3. The most substantial performance gain occurred in the 4,000-10,000 category with a 4.7 percentage point increase compared to the 2,000-4,000 category. Performance gains continued beyond 10,000 cases but showed diminishing returns, suggesting a plateau effect for most model types.
However, sample size requirements varied substantially by model complexity. Conventional ML methods plateaued near 80 percent F1 with samples of 4,000-10,000. Shallow neural networks required 10,000-20,000 cases for optimal performance. Deep CNN and RNN architectures needed 30,000-50,000 cases to approach their performance ceiling. Transfer learning methods showed unique patterns, achieving excellent performance (>90%) with 50,000+ samples but demonstrating diminishing returns compared to training from scratch below 20,000 samples.
Subgroup Analysis by Class Imbalance Handling
Class imbalance handling method demonstrated a strong association with F1-score performance (Q-test p<0.001), as detailed in Table 4. Combined approaches using both SMOTE/ADASYN and class weighting achieved the highest performance. The difference between combined approaches and no handling was 11.5 percentage points (95% CI: 7.8-15.2, p<0.001), representing a clinically and practically meaningful improvement. More importantly, fatal crash sensitivity showed even larger gains: 73.6 percent with combined handling versus 42.1 percent with no handling, a 31.5 percentage point difference (p<0.001).
Meta-Regression Analyses
Univariate random-effects meta-regression identified several significant predictors of F1-score, as summarised in Table 5. Sample size (log-transformed), imbalance handling method, algorithm type, study quality, and publication year all showed significant associations with performance. Class imbalance ratio demonstrated an inverse relationship, where greater imbalance was associated with lower F1-scores. Variables not achieving statistical significance in univariate analysis included number of predictor features (p=0.19), geographic region income level (p=0.12), urban versus rural setting (p=0.34), and data source type such as police versus hospital records (p=0.28).
Multivariate meta-regression including all significant univariate predictors yielded adjusted coefficients: Log(sample size) = 1.89 (95% CI: 0.78-3.00, p=0.001), Combined imbalance handling = 8.34 (95% CI: 4.92-11.76, p<0.001), Deep learning = 4.23 (95% CI: 1.47-6.99, p=0.003), and High risk of bias = -5.18 (95% CI: -8.67 to -1.69, p=0.004). The multivariate model explained 56 percent of between-study variance (adjusted R²=0.56, p<0.001), reducing residual I² from 84-61 percent. This indicates substantial but not complete explanation of heterogeneity. Publication year and imbalance ratio became non-significant after adjusting for other variables, suggesting they operate through the included predictors.
Table 6 presents a representative sample of 20 studies from the 62 included in the systematic review. Hybrid models combine two or more architectures (e.g., CNN+RNN, CNN+LSTM).
Sensitivity Analyses
Multiple sensitivity analyses confirmed robustness of primary findings. Excluding high risk of bias studies increased pooled F1 to 80.1 percent (95% CI: 77.8-82.3%, I²=79%) with main conclusions unchanged. Excluding outliers with F1 greater than 92 percent or less than 55 percent yielded pooled F1 of 78.2 percent (95% CI: 75.9-80.5%, I²=78%), showing minimal change from primary analysis. Excluding very large samples exceeding 100,000 cases resulted in pooled F1 of 78.1 percent (95% CI: 75.6-80.5%, I²=82%), indicating large studies were not driving results. Using fixed-effects model produced pooled F1 of 79.4 percent (95% CI: 78.9-79.9%) with higher estimate but narrower confidence interval, though this approach is less appropriate given substantial heterogeneity. Alternative logit transformation versus Freeman-Tukey yielded virtually identical pooled F1 of 78.8 percent (95% CI: 76.3-81.2%). Leave-one-out analysis showed pooled F1 ranged from 78.3 percent to 79.1 percent depending on which study was removed, with no single study exerting undue influence. All sensitivity analyses yielded similar point estimates within 2 percentage points and identical substantive conclusions, confirming stability of findings.
Assessment of Reporting Biases
Visual examination of funnel plot symmetry and Egger’s regression test (p=0.14) suggested no significant publication bias. The funnel plot showed relatively symmetric distribution of studies around the pooled estimate, with no obvious gaps indicating missing small studies with negative results. Trim-and-fill analysis imputed three potentially missing studies, yielding adjusted pooled F1-score of 77.8 percent (95% CI: 75.3-80.3%), minimal change from the unadjusted estimate of 78.6%. This suggests any potential publication bias has negligible impact on conclusions.
Certainty of Evidence
Using GRADE criteria adapted for prognostic studies, the certainty of evidence for the primary outcome was assessed as Moderate. The evidence was downgraded one level for inconsistency due to substantial unexplained heterogeneity (I² = 84%, prediction interval 64.3-88.9%) despite meta-regression explaining 56 percent of variance. The evidence was not downgraded for risk of bias (sufficient proportion of low-risk studies, sensitivity analysis excluding high-risk studies showed consistent results), indirectness (studies represented diverse relevant populations and settings), imprecision (narrow confidence interval around pooled estimate with adequate sample size), or publication bias (non-significant Egger’s test, symmetric funnel plot, minimal impact of trim-and-fill adjustment). Moderate certainty indicates we have moderate confidence that the true effect is likely close to the estimated effect, though further research may substantially impact our confidence and potentially change the estimate.
Discussion
Summary of Main Findings
This systematic review and meta-analysis of 74 studies comprising over 2.1 million traffic crash cases provides comprehensive evidence regarding machine learning and deep learning effectiveness for injury severity prediction. The pooled macro F1-score of 78.6 percent demonstrates clinically meaningful predictive capability across diverse geographic settings and crash contexts. Three primary findings emerged. First, deep learning architectures substantially outperform conventional machine learning methods with a 7.7 percentage point advantage in F1-score. Second, transfer learning and transformer-based approaches achieve the highest performance, with recent studies using pre-trained models on large crash datasets reaching 98 percent accuracy. Third, appropriate handling of class imbalance through combined SMOTE, ADASYN, and class weighting techniques improves fatal crash detection sensitivity from 42-74 percent, addressing the most critical prediction challenge.
Sample size demonstrated a clear but nuanced relationship with performance. The 4,000-case threshold represents a practical minimum for achieving F1-scores above 75 percent with moderate-complexity models like random forests or shallow neural networks. However, deep learning architectures require substantially larger samples, typically exceeding 50,000 cases to realise their full potential. This is likely to explain why some studies with 2,000-4,000 cases achieved only 68-72 percent F1-scores when using complex deep networks, while others with similar sample sizes but simpler models reached 78-80 percent. This linear relationship depends critically on model complexity, feature dimensionality, and minority class prevalence.
Comparison with Previous Reviews
Our findings extend and update previous systematic reviews in traffic safety prediction. Santos et al. (2022) conducted a literature review of machine learning algorithms, though without formal meta-analysis or focus specifically on injury severity outcomes. Santos et al. (2022) reviewed machine learning methods for crash severity but focused primarily on conventional ML algorithms, reporting mean accuracies of 72-76 percent. Our expanded review incorporating deep learning methods from 2021-2025 demonstrates meaningfully higher performance, with deep learning achieving 81.2 percent macro F1-score versus 73.5 percent for conventional ML. This 7.7 percentage point improvement represents substantial practical significance when deployed at population scale across millions of annual crashes.
Importantly, we emphasise macro F1-score rather than accuracy as the primary performance metric, addressing a critical limitation of previous reviews. Accuracy-based comparisons are fundamentally flawed for imbalanced crash data where fatal crashes comprise less than 5 percent of cases. A model achieving 95 percent accuracy might detect zero fatal crashes, as demonstrated by Fiorentini and Losa (2020). Our focus on balanced metrics reveals that many high-accuracy models actually perform poorly on minority classes, highlighting why appropriate evaluation metrics matter more than nominal accuracy figures.
The temporal evolution we document from conventional ML (2014-2017) through deep learning (2018-2020) to transfer learning and transformers (2021-2025) reflects broader artificial intelligence advances. Mean F1-scores improved from 73.2 percent in 2014-2017 to 84.3 percent in 2024-2025, representing an 11.1 percentage point gain. This trajectory suggests continued improvement as transformer architectures and large language models mature, though we observed diminishing returns beyond 85 percent F1-score, likely representing inherent prediction limits given crash outcome stochasticity.
Interpretation of Results
Why do recurrent neural networks consistently outperform convolutional neural networks for crash severity prediction? The answer is in the data characteristics. CNNs excel with spatial hierarchies in grid-structured data like images. Crash data, however, consists of tabular features (age, speed, weather) and sequential crash narratives where temporal dependencies matter. RNNs and especially LSTM networks explicitly model these sequential patterns in crash reports and temporal correlations between events. When crashes occur, the sequence matters: speeding → loss of control → roadway departure → impact. RNNs capture these causal chains while CNNs cannot naturally represent temporal ordering without substantial architectural modification.
The superior performance of transfer learning deserves emphasis. Pre-trained models like MobileNet, originally trained on ImageNet for object recognition, can be fine-tuned on crash data with remarkable success. This seems counterintuitive since ImageNet contains images, not crash records. However, transfer learning leverages learned feature extraction and hierarchical representations. The pre-trained layers learn generalisable patterns, detecting edges, textures, and complex interactions, that transfer across domains. Fine-tuning on crash data adapts these representations to injury prediction, requiring far less data than training from scratch. Studies using transfer learning with 100,000+ cases achieved 98 percent accuracy, compared to 83-85 percent for deep networks trained from scratch on similar sample sizes.
The dramatic improvement from class imbalance handling, raising fatal crash sensitivity from 42-74 percent, has profound practical implications. Without resampling or weighting, models optimise overall accuracy by predicting the majority class (non-fatal crashes). This creates a dangerous paradox where models appear accurate (90%+) but fail catastrophically on the most critical cases. SMOTE addresses this by generating synthetic minority class examples in feature space, creating a more balanced training distribution. ADASYN extends SMOTE by generating more samples in difficult-to-learn regions, focusing on borderline cases. Class weighting complements resampling by penalising minority class misclassifications more heavily during training. The combination proves more effective than any single approach, suggesting the mechanisms are complementary rather than redundant.
Substantial heterogeneity (I²=84%) warrants interpretation. This statistic indicates that 84 percent of variation in F1-scores across studies reflects genuine differences rather than random sampling error. In simpler terms, studies are measuring somewhat different effects rather than all estimating the same true value with sampling variability. Meta-regression explained 56 percent of this heterogeneity through sample size, imbalance handling, algorithm choice, and study quality. The remaining 28 percent likely reflects unmeasured factors: crash type heterogeneity (single-vehicle versus multi-vehicle), feature quality differences (detailed police reports versus minimal data), geographic variation in crash patterns, and temporal changes in vehicle safety features. Rather than viewing heterogeneity as problematic, we interpret it as expected given the diverse contexts and methodologies, partially explained by identifiable factors.
Implications for Research
Future research should prioritise several methodological improvements. First, standardised reporting following TRIPOD+AI guidelines would enable better synthesis and reproducibility. Only 15 percent of studies shared code and 11 percent shared data, severely limiting verification and extension. Second, external validation remains critically underutilised, with only 25 percent of studies testing models on different geographic regions or time periods. Models achieving 90 percent accuracy on held-out test data from the same source often show 60-70 percent accuracy on truly external data, revealing overfitting to local patterns. Third, fairness assessment across demographic subgroups appeared in only 5 percent of studies despite known disparities in crash outcomes and prediction accuracy across age, gender, and socioeconomic groups.
Transformer architectures (Vaswani et al., 2017) and large language models represent promising frontiers. Early evidence shows transformers handling crash narrative text achieve 84 percent accuracy with superior attention to causal language patterns. LLMs fine-tuned on crash reports demonstrate 33-45 percent F1-score improvements over baseline models, with particular strength in extracting subtle contextual factors from unstructured text that structured features miss. However, LLM applications remain limited by computational requirements, interpretability challenges, and data privacy concerns when processing sensitive crash narratives. Multimodal approaches combining tabular features, crash scene images, and narrative text may unlock further improvements but require careful attention to privacy protection and algorithmic fairness.
The sample size-complexity relationship needs empirical clarification through prospective learning curve studies. Our findings suggest general thresholds but cannot prescribe exact requirements for new applications. Researchers should conduct pilot studies with incrementally increasing samples to determine when performance plateaus for their specific model and context, rather than assuming fixed thresholds apply universally. Events-per-variable ratios from traditional regression (20:1 rule) do not transfer straightforwardly to deep learning with non-linear interactions and implicit regularisation.
Implications for Practice
For traffic safety practitioners and policymakers, these findings support several recommendations. First, deep learning models are ready for operational deployment in crash severity prediction systems, particularly when sample sizes exceed 10,000 annual crashes. Agencies with smaller crash volumes should consider conventional ML methods or collaborate regionally to pool data. Second, appropriate evaluation metrics are non-negotiable. Agencies must evaluate models using macro F1-score, per-class sensitivity, and G-mean rather than overall accuracy alone. Procuring or developing systems based on accuracy specifications risks deploying models that ignore severe crashes.
Implementation requires more than predictive accuracy. Interpretability matters critically for practitioner trust and actionable insights. Black-box deep learning models achieving 85 percent accuracy but offering no explanation for predictions will see limited adoption compared to 80 percent accurate models with clear feature importance and decision rules. SHapley Additive exPlanation (SHAP) values, attention weights for transformers, and model-agnostic interpretation methods should accompany any deployment. Real-time prediction systems must balance accuracy against latency requirements, favouring efficient architectures over marginally better but computationally expensive alternatives.
Ethical considerations demand attention before widespread deployment. Predictive models may perpetuate or amplify existing biases if training data reinforces historical inequities in crash reporting, investigation thoroughness, or medical care quality across communities. Agencies must audit models for disparate performance across demographic and geographic subgroups, implementing bias mitigation strategies when necessary. Continuous monitoring post-deployment ensures performance does not degrade as crash patterns evolve with vehicle technology changes, demographic shifts, and infrastructure improvements.
Strengths and Limitations
This review demonstrates several methodological strengths. Comprehensive database searching identified 941 initial records with systematic screening yielding 74 included studies. Use of prediction model-specific risk of bias assessment (PROBAST framework) rather than generic tools strengthened quality evaluation. Emphasis on appropriate metrics for imbalanced data (macro F1-score, G-mean) rather than accuracy corrects a critical flaw in previous reviews. Inclusion of 2024-2025 literature incorporating transformer and LLM advances ensures currency. Multiple subgroup analyses and meta-regression exploring sources of heterogeneity enhanced interpretation. Sensitivity analyses confirmed finding robustness.
Several limitations warrant acknowledgment. First, most studies originated from high-income countries (58%), limiting generalisability to low- and middle-income settings where 92 percent of crash fatalities occur. Crash patterns, data quality, and infrastructure differ substantially across income levels. Second, between-study heterogeneity remained considerable despite meta-regression, suggesting unmeasured factors we could not quantify. Third, publication bias cannot be definitively excluded despite non-significant Egger’s test. Studies with negative or null results may be underrepresented. Fourth, we could not evaluate temporal external validity, whether models trained on historical data maintain accuracy as crash patterns evolve, because few included studies reported this. Fifth, lack of individual patient data precluded subgroup analyses by crash type, road user category, or demographic characteristics that might reveal important effect modifiers.
Conclusions
This comprehensive systematic review demonstrates that machine learning and deep learning approaches effectively predict traffic crash injury severity when evaluated using appropriate metrics for imbalanced data and adequate sample sizes. Transfer learning and emerging transformer architectures represent current state-of-the-art, while class imbalance handling through combined SMOTE/ADASYN and class weighting is essential for adequate minority class detection. Sample size requirements depend on model complexity and class distribution rather than fixed thresholds, though n≥4,000 provides reasonable performance for moderate-complexity models and n≥50,000 is recommended for deep neural networks. Future research should adopt TRIPOD+AI reporting standards, emphasise minority class performance metrics, examine fairness across demographic subgroups, and explore multimodal approaches. Implementation in practice should prioritise interpretability, algorithmic transparency, and continuous performance monitoring to ensure equitable and effective crash prediction systems.
Acknowledgements
The authors thank the librarians at Ivano-Frankivsk National Medical University for assistance with database searches.
AI tools
The AI tool ChatGPT 4.0 was used to improve English expression and clarity.
Author contributions
Yu. Kotsyubynska and N. Kozan designed the study. Yu. Kotsyubynska and N. Kozan, and V. Chadiuk conducted the literature search and study selection. Yu. Kotsyubynska and N. Kozan performed data extraction. V. Chadiuk and A. Kostyshyn resolved disagreements. A. Kotsyubynsky and V. Fentsyk performed statistical analysis. All authors contributed to manuscript writing and approved the final version.
All authors have read and agreed to the published version of the manuscript.
Funding
This research did not receive any specific grant from funding agencies in the public, commercial, or not-for-profit sectors.
Conflicts of interest
The authors declare that there are no conflicts of interest.