Introduction
Globally, road crashes are the 7th and 10th leading causes of death in low- and lower-middle-income countries, respectively (WBG, 2020; WHO, 2018). Among people aged 5-29 years, road crashes are the leading cause of death (WHO, 2023), surpassing diseases like HIV/AIDS and tuberculosis. Nepal follows these trends, with 2,883 crash fatalities officially reported in 2021 although WHO estimated road traffic fatalities were 8,479 (WHO, 2023).
Nepal, one of the least developed and fastest-urbanising countries, faces substantial road safety challenges due to rapid urban expansion and rising motorisation. With an annual urbanisation rate of 3.2 percent (World Urbanization Prospects, 2019), urban populations are concentrated in cities like Kathmandu Valley, where vehicle registration increased from 76,378 in 1989/90 to over 3.2 million by 2017/18, reflecting a 14 percent annual motorisation rate (Himalayan News Service, 2017). This growth increases traffic crash risks, particularly in densely populated areas. In Nepal from 2008 to 2020, over half the crashes on the road (56.5%) and 8.4 percent of fatality crashes occurred in Kathmandu Valley alone (Rizal & Tiwari, 2023). Urban road networks in Nepal are governed by multiple agencies with inconsistent standards. While the Ministry of Physical Infrastructure and Transport (2021) categorises roads into National, Feeder, District, and Urban types, the Nepal Urban Roads Standard (Ministry of Urban Development, 2020) highlights deficiencies such as missing footpaths, cycle tracks, and signage, critical for reducing crash risks.
As urbanisation and motorisation accelerate, risks associated with shared road spaces rise, particularly in high-traffic areas. Poor road design and inadequate infrastructure create conditions that encourage risky behaviour, such as speeding and unsafe overtaking, further intensifying crash-prone zones or “black spots” (IRTAD, 2021). Vulnerable road users, including pedestrians, accounted for the majority (72%) of road fatalities in Kathmandu in 2020-21, half of whom were pedestrians (Kuikel et al., 2022). Addressing these risks requires urgent improvements in urban road design and management. Despite the effectiveness of drink-driving law enforcement being rated 8 out of 10 (WHO, 2018), infrastructure deficiencies persist. Inconsistencies in sustainable urban transport planning exacerbate safety inequities (Gossling, 2016), and the lack of lane markings, traffic signals, pedestrian segregation, and intersection management contributes to unsafe conditions. While crashes are often attributed to driver error, inadequate infrastructure elements like lane dividers and signage are overlooked (Thapa, 2013). This study examines road crash data and infrastructure in Kathmandu to identify contributing factors and recommend strategies for safer urban environments.
Method
Study Design
This study employed the Branch Index Risk (BIR) and Section Index Risk (SIR) frameworks developed by Demasi et al. (2018) to assess urban road safety in Kathmandu. This approach was selected for its effectiveness in contexts with limited historical crash data, enabling safety evaluation based on direct road inspections and calculated risk indices. The BIR and SIR frameworks allow for a detailed analysis of road safety by segmenting roads into branches and sections, providing an overall risk assessment for each road.
The selection of this framework was informed by a review of existing road safety assessment methods. Studies by Loprencipe et al. (2015) emphasised the importance of analysing road crash data alongside physical characteristics of roads, such as geometry, signage, and user interactions. International programs like the European Road Assessment Programme (EuroRAP) and the International Road Assessment Programme (iRAP) use video-based and statistical inspections to assign standardised star ratings, assessing road safety across regions (EuroRAP, 2009). In Nepal, more recent road safety initiatives, including the Road Safety Action Plan (2013-2020) and the formation of the Road Safety Council (2017), have supported similar efforts through safety audits, traffic law enforcement, and awareness programs, especially in urban settings (Ojha, 2021). However, we recognise there are limitations in using this method in Nepal as disaggregated data are not available for the number of crashes on individual road sections or detailed mobility data (e.g., based on gender).
Case Study Area
This study focuses on key urban roads in Kathmandu where hazardous driving decisions are common, such as navigating crossings without traffic signals and dimly lit areas. The three selected roads represent typical urban safety challenges: Chabahil to Boudha road (Road 1, Length = 1880m, Sections=19), Durbar Marga to Kesar mahal road (Road 2, Length=678m, Sections=7) and Kalimati to Balkhu road (Road 3, Length=1776, Sections=18).
The geometric, functional and traffic data of each road were analysed to assess collision risks for Vulnerable Road Users (VRUs), specifically pedestrians, cyclists and motorcyclists. The methodology enables prioritisation of safety interventions at section and branch levels, providing data-driven insights for urban road safety improvements. This model can also be adapted for intersection-level risk assessments, with potential for broader application across urban road networks.
Data Collection
Data collection involved both primary and secondary sources. Three types of primary data were generated in 2023: (1) semi-structured interviews with 16 professionals including three civil engineers, four urban planners, two transportation engineers, two road safety professionals, three experienced drivers, one traffic police officer, and one trauma doctor; (2) detailed inspections of the selected urban roads during 12PM to 5PM daytime to document missing elements or defects and assess traffic conditions for VRUs, including pedestrians, cyclists, and motorcyclists. Inspections focused on nine defect categories: geometry, cross-section, private access, pavement, lighting, signage, intersections, urban furniture and stopping zones, and (3) observations of motorised vehicle volumes along each surveyed section, considering traffic flow stability and peak congestion times.
For secondary data traffic volume records, average speeds, and crash histories from financial year (FY) 2013/14 to 2022/23 were obtained from the Kathmandu Valley Traffic Police Office (KVTPO). These secondary data points provided context for calculating traffic-related factors and user vulnerability, ensuring consistency with recent trends in urban road crashes and supporting the accurate calculation of risk indices.
Risk Calculation
SFRj,r=n∑i=1Bi×K1i×K2i×K3×K4i×K5i
where,
-
Bi is the base value associated to defects i which are along j.
-
K1i is the priority factor of the category to which the element i belongs.
-
K2i is the vulnerability factor of users (i.e., pedestrians, cyclists and motorcyclists) along r; and it depends on their volume.
-
K3 is the motorised traffic factor of r.
-
K4i is the hazardousness factor; it depends on the consequences of defect i on the most VRUs.
-
K5i is the extension factor; it depends on continuous or discrete elements/defects i along j.
Both SIR and BIR values range between 0 and 1 and depend on the attributed values of K1i, K2i, K3, K4i, and K5i, as well as the identified defects.
Calculation of Risk Indices
The SIR was calculated by normalising SFR values relative to the maximum possible risk within each section.
SIRj,r=SFRj,r/SFRmax,r×100
The Branch Index Risk (BIRr) for each road branch was derived by aggregating SIR values across sections:
BIRr=Rr/Rmax,r×100
-
Where, Rr: values across all m sections within a branch, calculated as Rr=m∑j=1SIRj,r
-
Where, Rmax,r: Reference value of the maximum risk factor for the branch, calculated as Rmax,r=m×SFRmax,r …
Determination and Calculation of Factors
a) Priority Factor K1i
Defects were categorised into nine groups: geometry (G), cross-section (C), private access (A), pavement (P), lighting (L), road signs (S), intersections (J), urban furniture (F), and stopping zones (ST). Priority values for each category, ranging from 0 to 1, were determined through consultations with road safety experts, engineers, urban planners, and traffic officers. For example, the cross-section category might have the highest priority at 1.0, while a lower-priority category could be assigned 0.4.
b) Base Severity Value Bi
Assigned a value between 1 and 4 depending on the severity of the defect. Inspections identified missing elements or defects, and each defect was assigned a severity value. For instance, a missing sidewalk might be assigned a higher Bi value, while a minor defect like a missing ramp to private property access might receive a Bi value of 1.
Calculation of Bi
1≤Bi≤4
c) Vulnerability Factor K2i
Calculated based on the observed traffic conditions of VRUs. K2i is determined by multiplying the pedestrian flow (KPi), cyclists flow (KCi) and motorcyclists flow (KMi) with each factor value ranging from 1 to 2.5.
K2i=KPi×KCi×KMi
d) Motorised Traffic Factor K3
Based on the volume of motorised vehicles observed along the surveyed section. The factor depends on typical traffic flow conditions, including stability and congestion levels, with values ranging from 1 to 2.5.
e) Hazardousness Factor K4i
This factor, representing the expected fatality risk induced by a defect, was based on crash data from the Valley Traffic Police Office. K4i was calculated as follows:
K4i=K4Vi×K4Pi …
Consequences for motorised road users is represented by K4Vi (ranging from 1 to 2.5). K4Pi (ranging from 1 to 5.0) are expected consequences non-motorised users (pedestrians and cyclists).
f) Extension Factor K5i
This factor represents the extent of a defect along the section, considering both continuous and discrete elements. For continuous defects spanning a section, values ranged from 1.0 to 2.0. For discrete defects, values ranged from 1.0 to 2.5, based on the proportion of the section affected.
In Table 1, the BIR values are categorised into six probabilistic risk levels based on EuroRAP standards (2009).
The appropriateness of this method was confirmed as the simulated and analytical distributions were consistent with the Gaussian distribution by the previous studies (Demasi et al., 2018).
Results and Discussion
Trends, determinants and key factors of road crashes in Kathmandu Valley
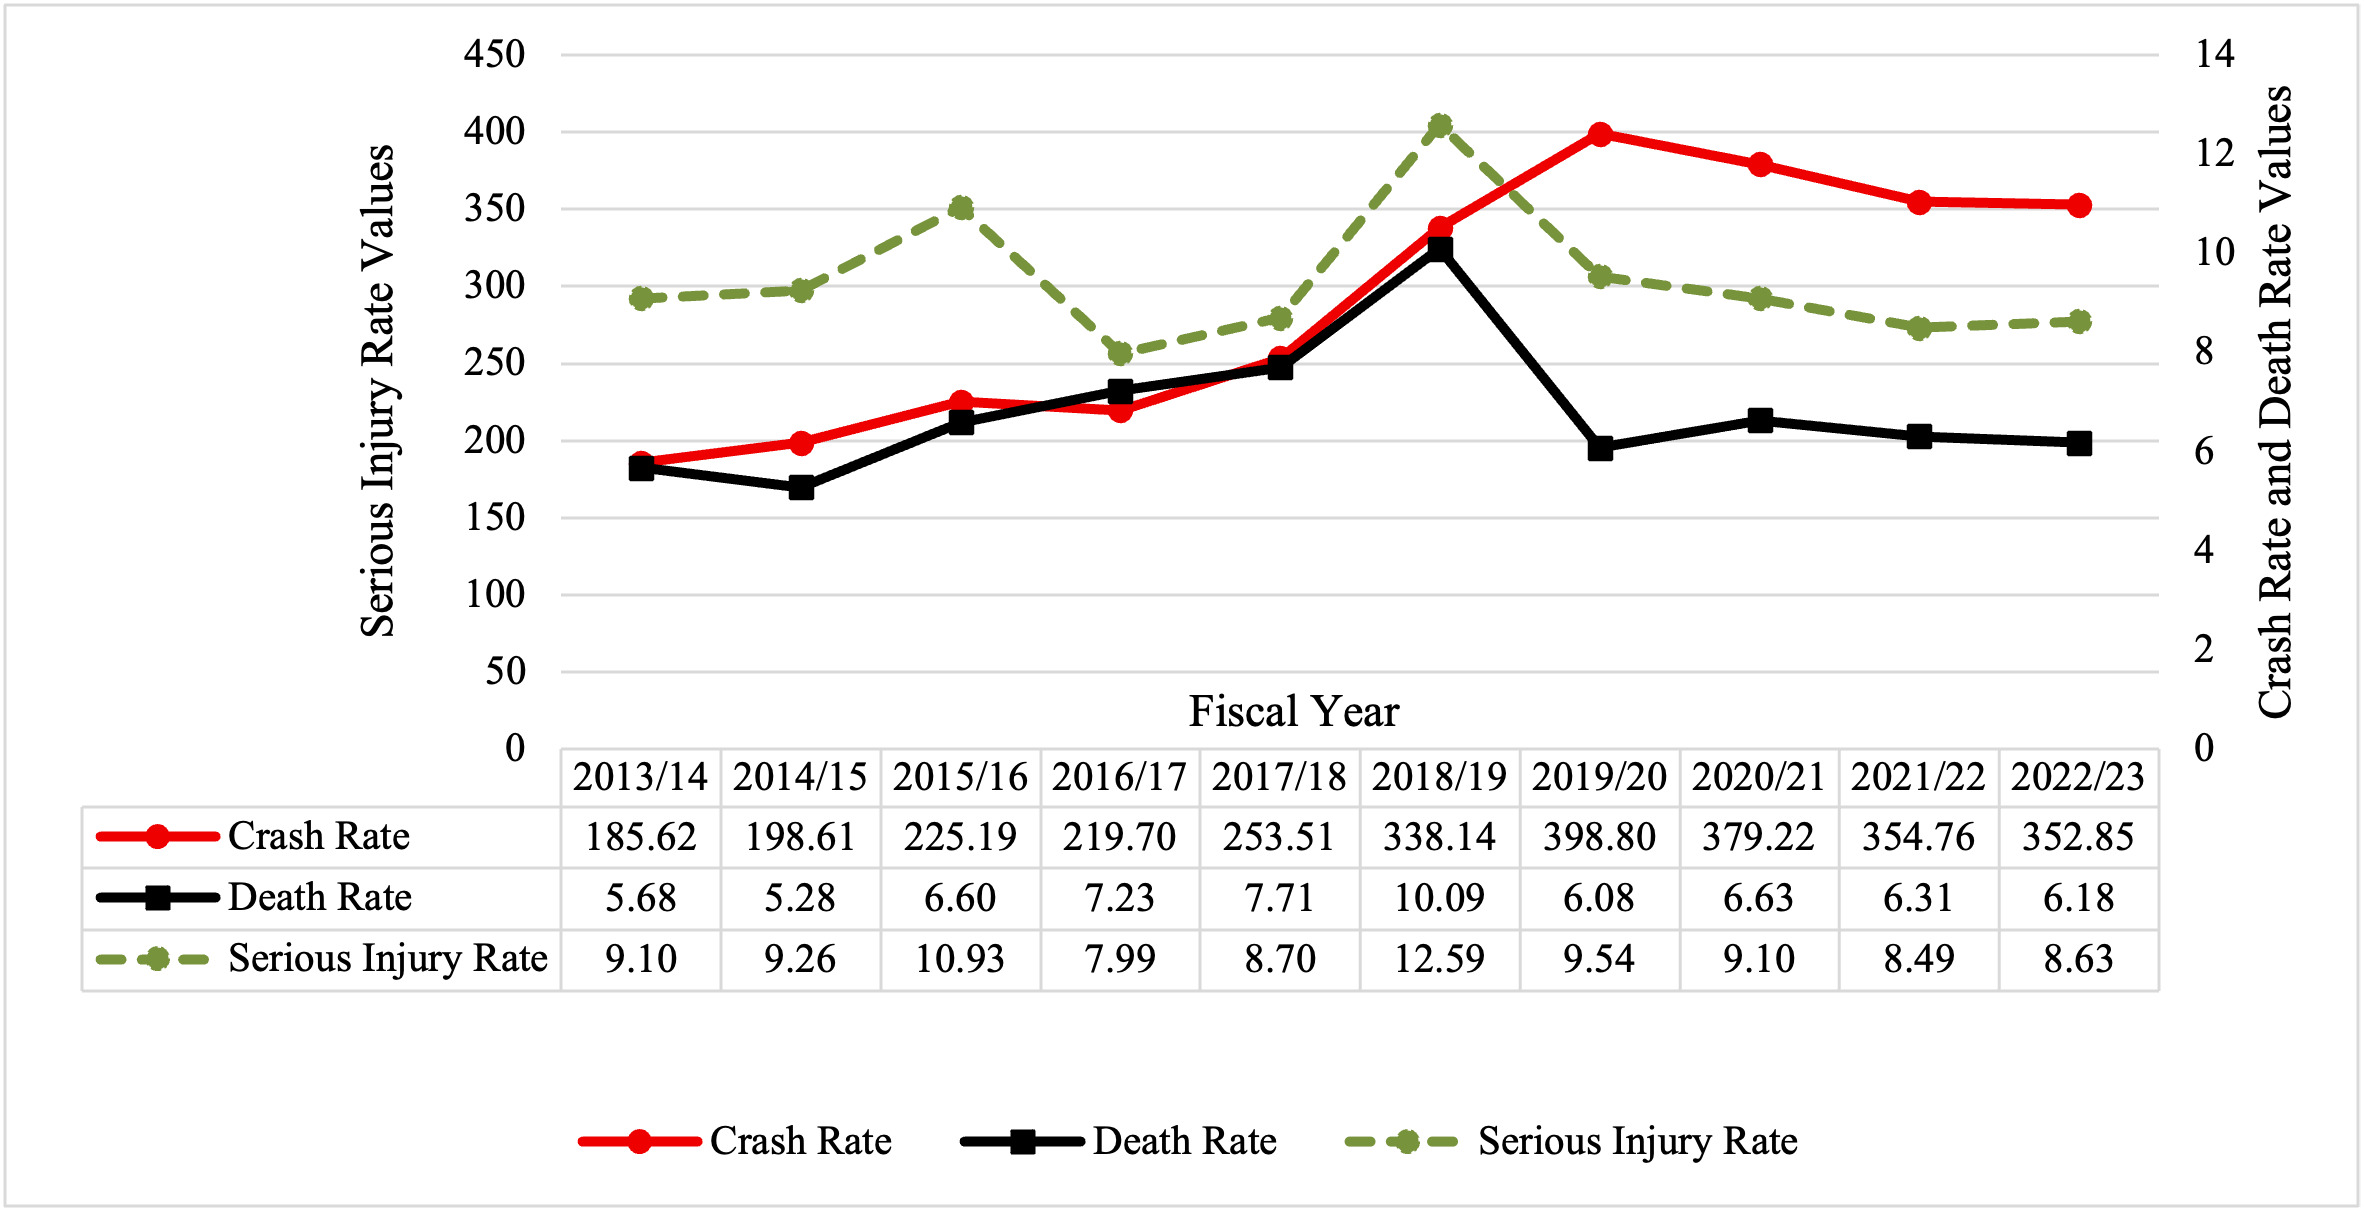
The analysis of data collected from the Kathmandu Valley Traffic Police Office shows that road crashes, injuries, and fatalities have generally increased over the fiscal years 2013/14 to 2022/23. The number of crashes rose substantially peaking at 10,733 in 2021/22. While the rates of deaths and serious injuries fluctuated, there was an upward trend, reaching notable highs in 2018/19 of 254 deaths and 317 serious injuries per 100,000 population. General injuries consistently climbed, with 8,300 reported in 2022/23, underscoring a persistent rise in traffic incidents and the growing impact on public safety.
Figure 1 shows the trends per 100,000 population for all road user crash types, with a rising rate peaking in 2018/19 before stabilising thereafter. Death and serious injury rates also peaked in the same year and subsequently declined, although they remain above earlier levels, suggesting that safety measures or improved post-crash responses may have reduced the severity of outcomes despite persistently high crash rates. The secondary axis shows the rate of fatal crashes per 100,000 population has declined in recent years, as shown in Figure 1. Initially high, this rate dropped substantially midway through the period and stabilised at a lower level, suggesting crashes have become less fatal. This divergence between crash frequency and severity (i.e., fatal) suggests potential improvements in safety measures, emergency response, or vehicle technology, are helping to mitigate the risk of death per incident even as the number of crashes continues to grow.
.png)
Gender-disaggregated fatality data indicate consistently higher male deaths compared to females from FY 2013/14 to 2022/23. Male fatalities peaked in 2018/19 before stabilising in subsequent years, while female fatalities remained comparatively low, with a modest increase in same year. However, the absence of gender-specific exposure data, such as travel frequency, mode of choice, or risk behaviour, limits causal interpretation, The observed disparity is therefore interpreted as an outcome pattern rather than a direct measure of gender-specific risk.
Similarly, vehicle type analysis shows motorcycles (motorised two-wheeler, MTW) as the most frequently involved in road crashes, with an increasing trend over the years. Crash involvement of cars, vans, and jeeps maintain was relatively unchanged and buses and microbuses declined. Trucks, tempos (petrol or electric powered three-wheeler vehicles used for local public transport), and tractors remain stable at lower rates, indicating a shift toward higher involvement of smaller, personal vehicles, especially motorcycles.
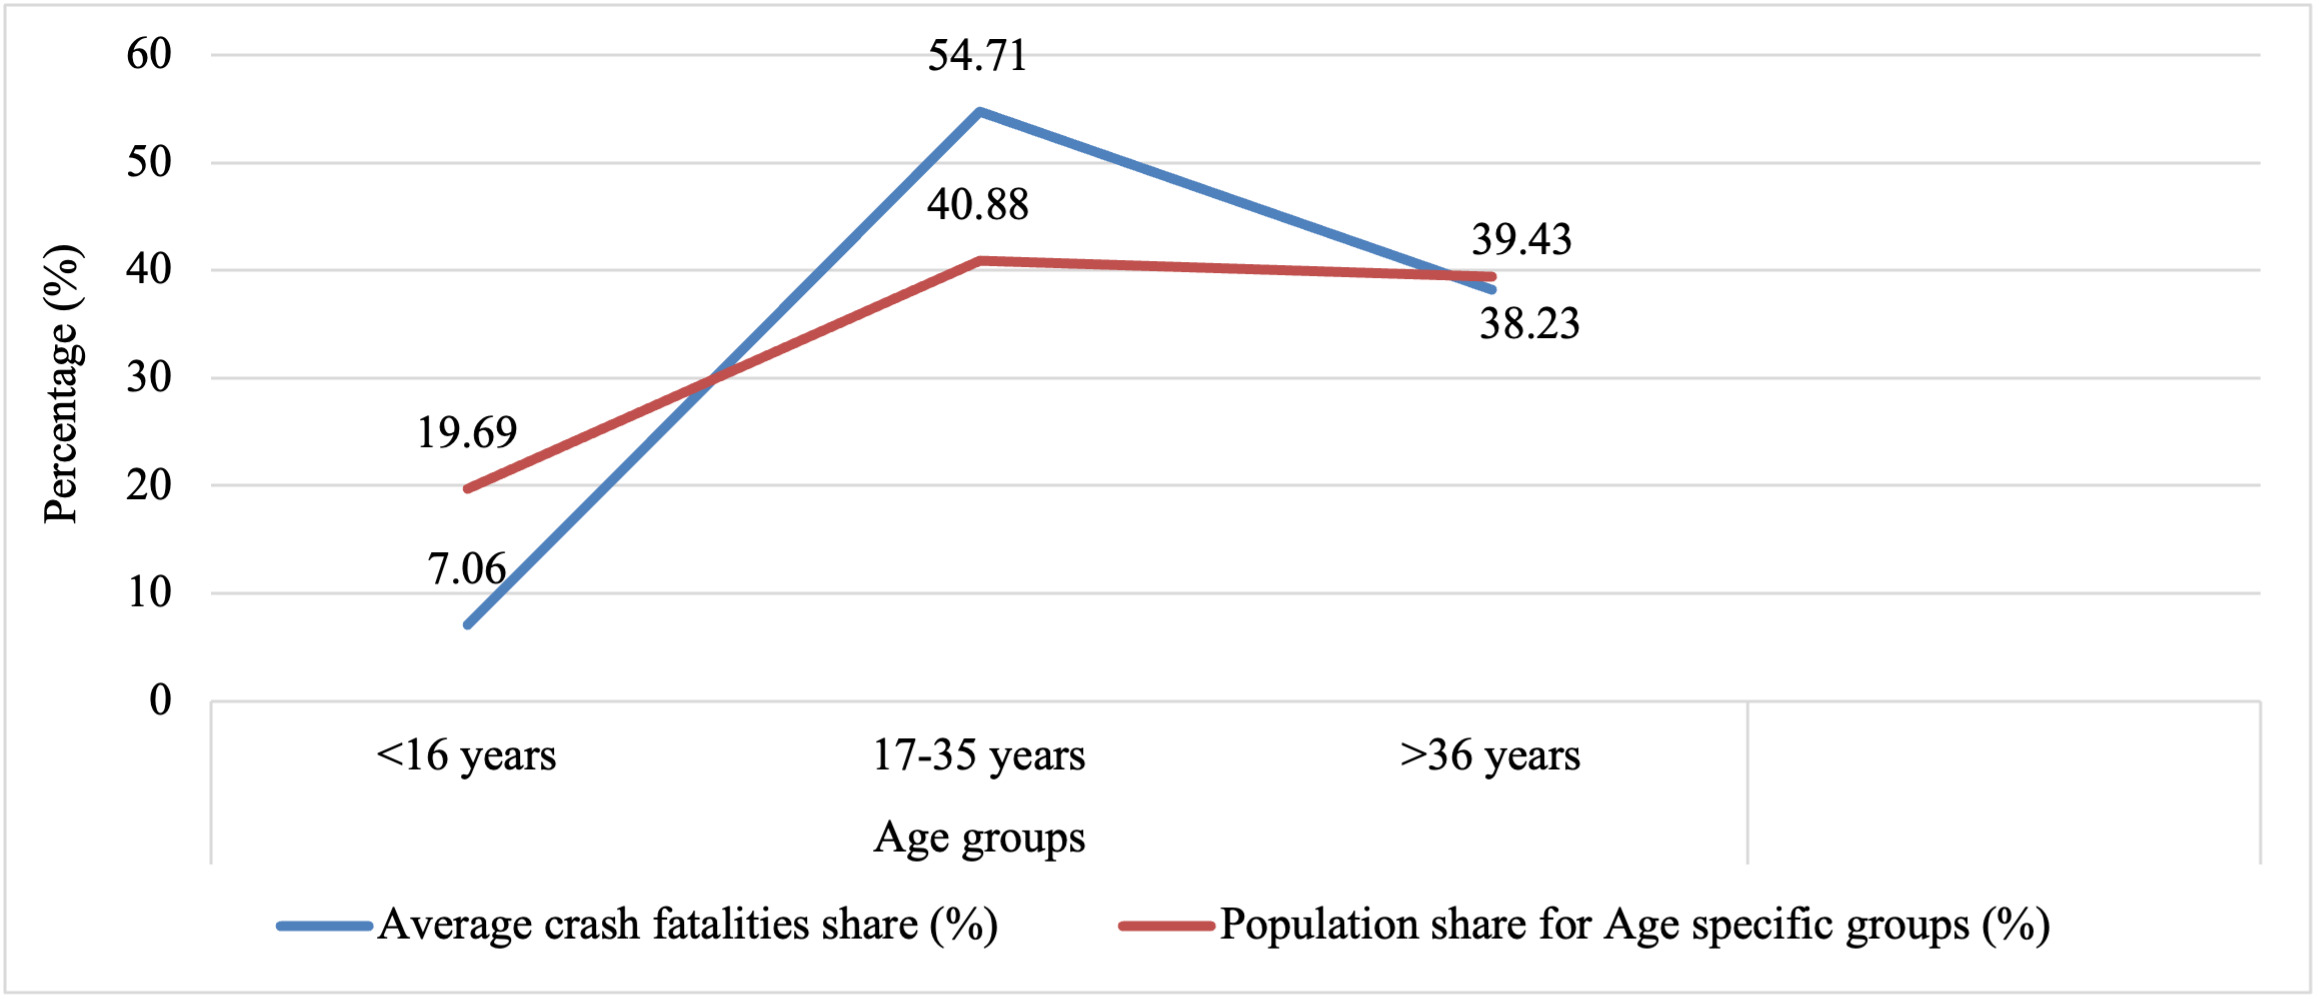
The analysis of age-specific population distribution and crash fatality records reveals a clear over-representation of individuals aged 17-35 years in road traffic fatalities in Kathmandu district (Figure 2). While the 15-34 years age group accounts for 40.88 percent of the district’s population (National Statistics Office, 2023), fatalities in the comparable 17-35 years category consistently exceeded this share over the past decade, ranging from 47.25 percent and 64.05 percent of total crash-related deaths, with an average of 54.71 percent. This discrepancy indicates that individuals aged 17-35 years experienced a disproportionately higher burden of road traffic fatalities relative to their demographic share. In contrast, fatalities among those aged <16 years and >36 years either align with or fall below their respective population proportions. These findings emphasise that the 17-35 years cohort is the most vulnerable segment of the population in terms of road traffic injuries and fatalities in Kathmandu. This is likely to be due to multiple factors including: lack of driving experience, increased exposure to higher road use and increased risk-taking behaviours.

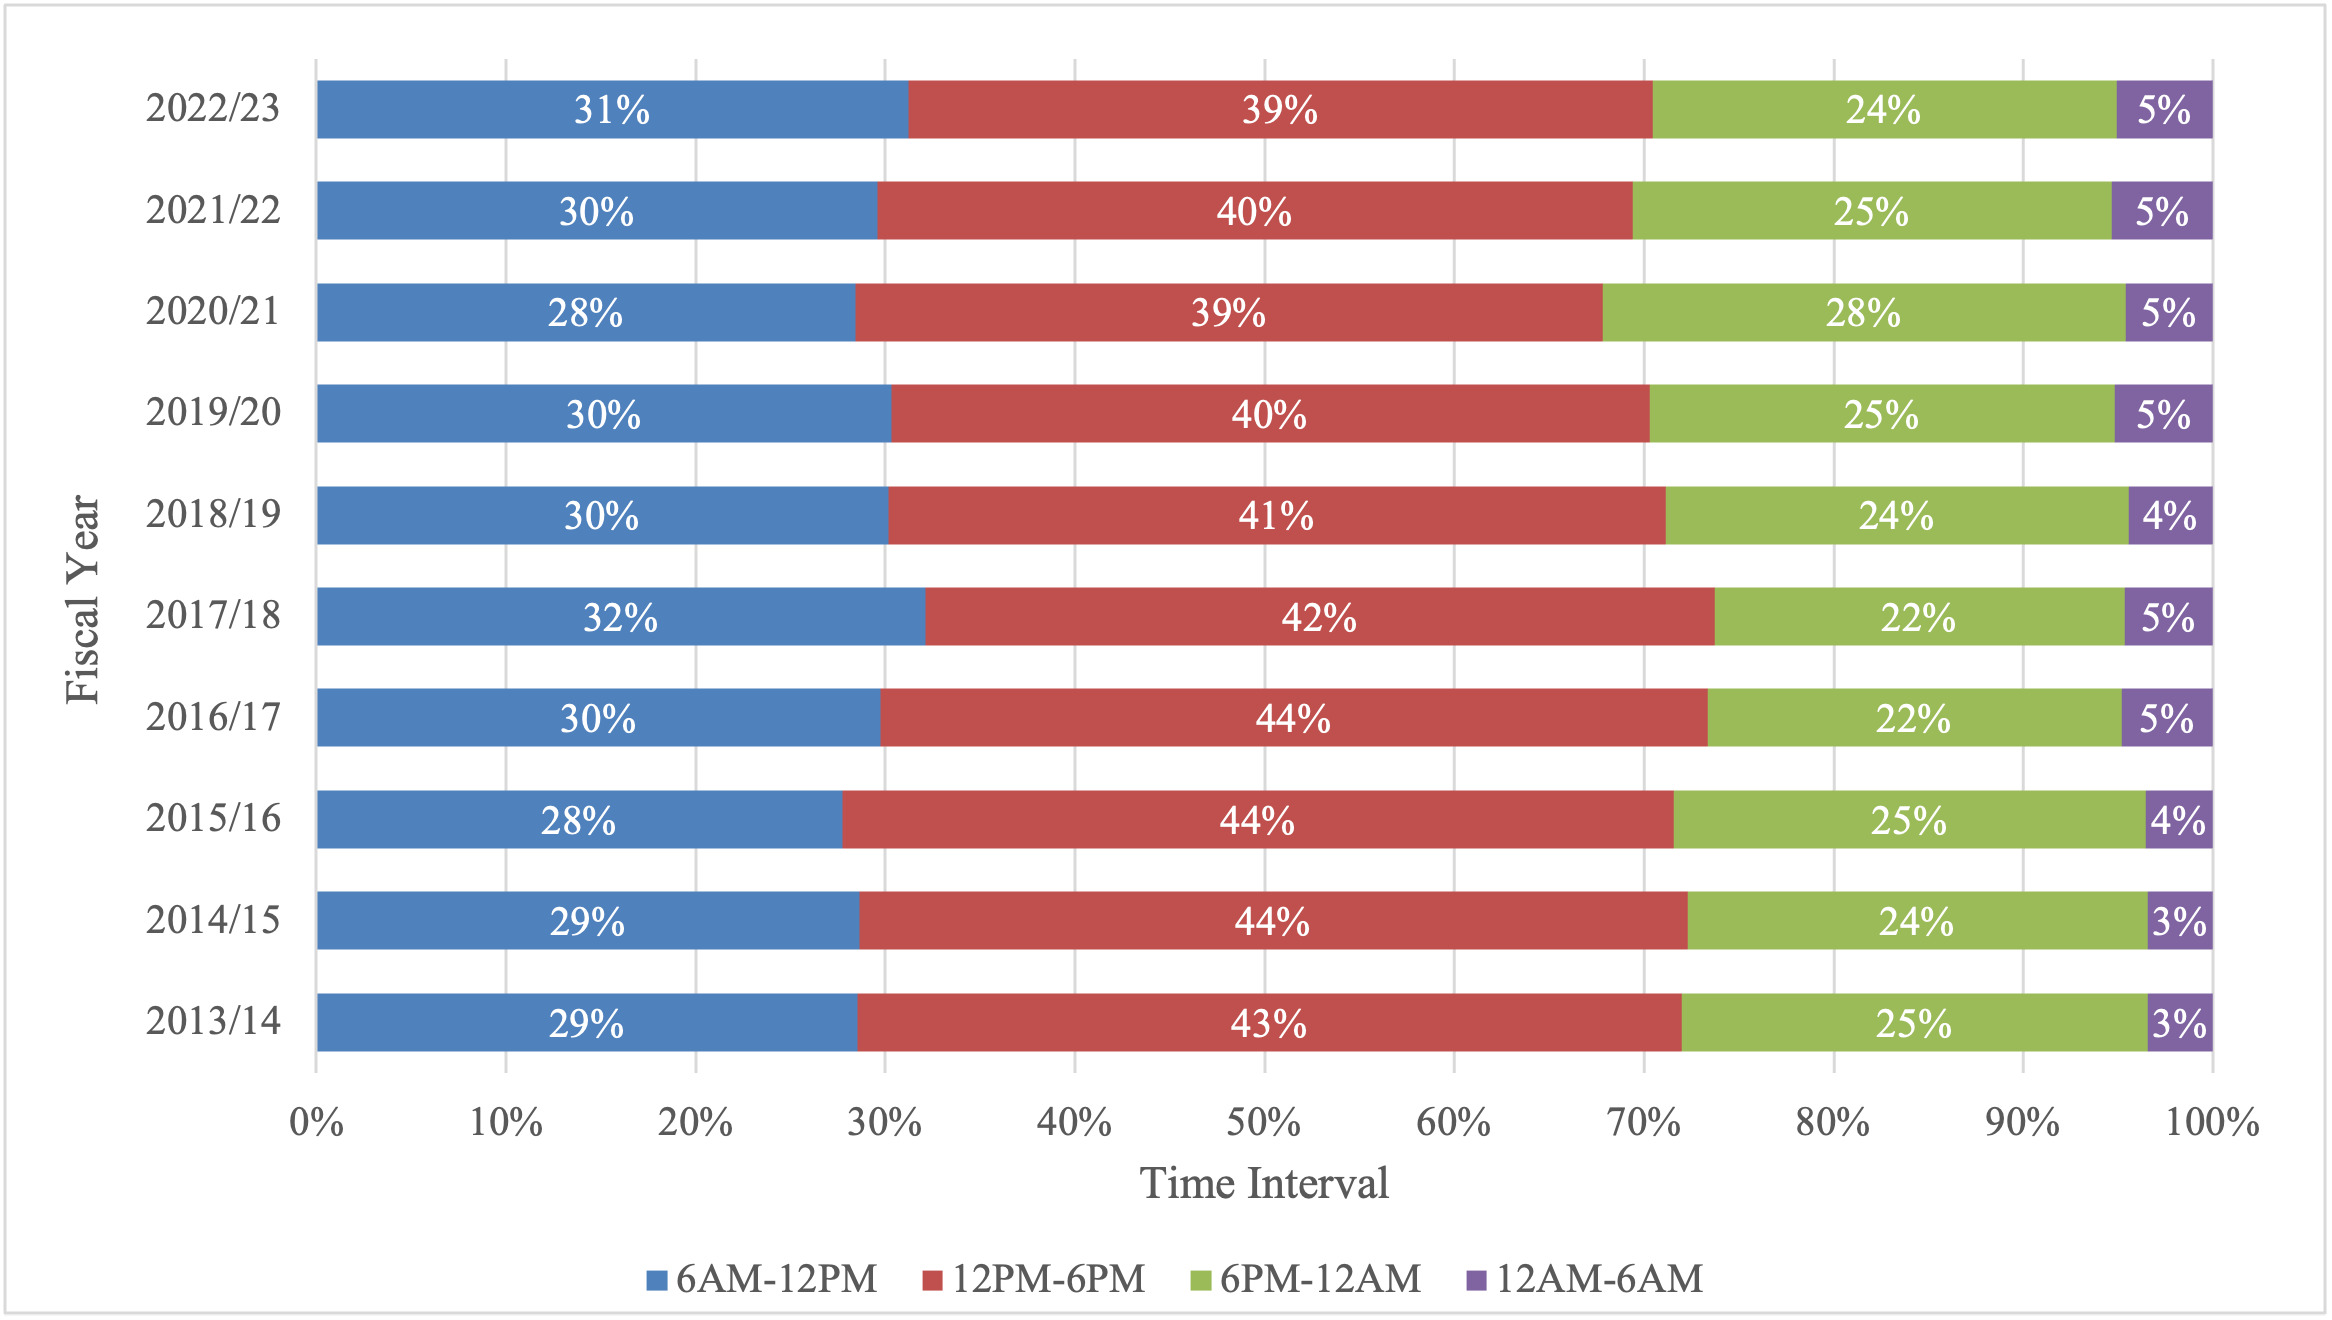
Temporal patterns displayed in Figure 3 show that road crashes peak between 12PM-6PM with a consistent decrease over the years from fiscal year 2014/15 to 2022/23 (from 44 to 39%) of total crashes. The period from 6AM-12PM follows, accounting for a steady share of around 30 percent, while fewer crashes occurred in the evening (6PM-12AM) (average, 25%). Proportion of crashes between 12AM-6AM remain the lowest, reflecting minimal activity during these hours even though the share has been consistently increasing from 3 to 5 percent indicating an increasing relative risk of night-time crashes despite their lower base line frequency.

The primary causes of road crashes according to police reports from 2013/14 to 2022/23 show distinct trends. Driver negligence is the leading cause, rising steadily and peaking in 2018/19, then slightly declining while remaining high. High speed follows a similar trend, reinforcing the need for speed control measures. Poor road conditions also peaked in 2018/19 but declined afterward, likely due to infrastructure improvements. Additional driver-related causes like overtaking and driving while impaired by alcohol contribute steadily but are less prominent, while pedestrian negligence and environmental factors present lower-level risks, pointing to the need for awareness campaigns.
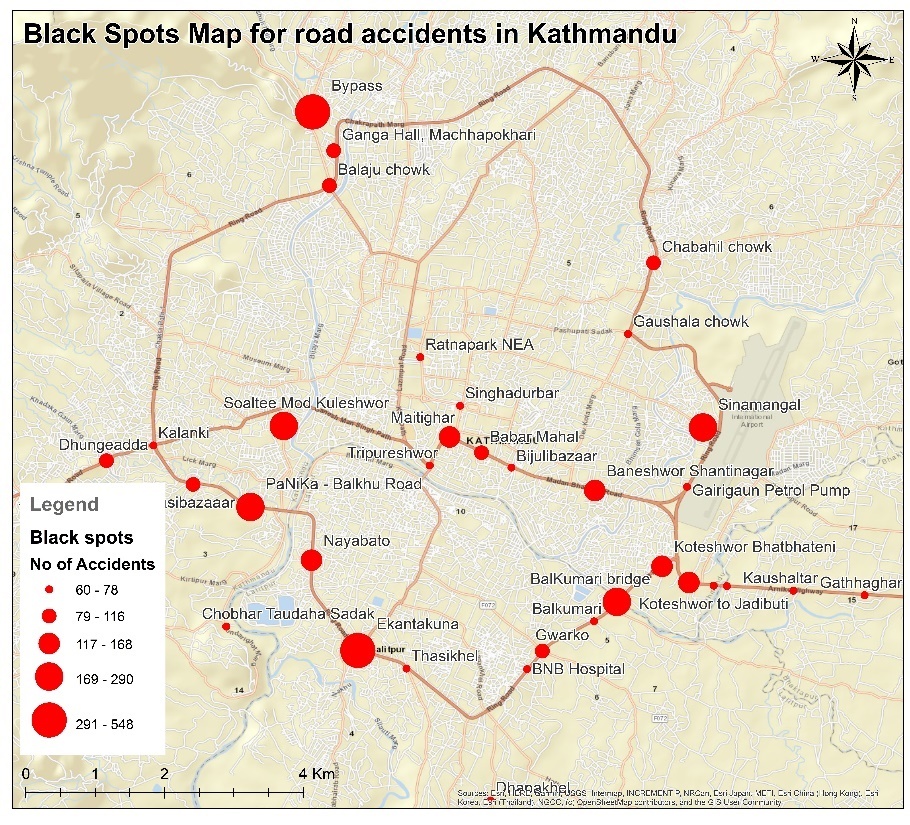
Figure 4 is a mapped analysis of high-risk crash zones, or “black spots” and shows that road crashes are concentrated around major intersections, roundabouts, and high-traffic areas and identifies critical locations such as Balkhu, Kalimati, Balaju Bypass, Chabahil, Ekantakuna, and the Koteshwor-Jadibuti stretch as having the highest crash rates. While some areas may not traditionally be defined as black spots, they reveal design flaws or high traffic volumes contributing to frequent crashes. Targeted safety upgrades in these locations are essential to improving road safety in Kathmandu. Three major roads in Kathmandu Valley were purposefully selected for section and branch index risk analysis, based on black spot characteristics and crash/ fatality data to assess different risk levels. Although disaggregated fatality and injury data were unavailable, the black spot map shows a high crash density along these sections, serving as a proxy for their relative importance.

Risk Assessment
The study summarises the priority factors (K1) for each identified 9 categories of infrastructure elements and defects that contribute to road crashes. These categories were assessed through interviews with professionals, including civil engineers, urban planners, and transportation experts, who assigned values based on the potential impact of each factor on road safety as the 9 categories of defects are most consistent with design and conditions of Nepalese roads as observed. The values range from 0.4 to 1.0, with higher values indicating a greater priority for addressing specific issues. The values associated with Geometry (G) = 0.8, Cross-Section (C) = 1, Private Access (P) = 0.45, Pavement (P) = 0.9, Lighting (L) = 0.75, Road Signs (S) = 0.65, Intersections (J) = 1, Urban Furniture (F) = 0.75 and Stopping (ST) = 0.7 represents a common cause of crashes in urban environments, such as poor geometric design, inadequate cross-sections (includes carriageway, drain, footpath, urban furniture etc.) and lack of road signage.
Furthermore, in this study, under the 9 categories of elements/defects, 51 sub-categories were identified as potential causes of crashes, with base values (Bi) ranging from 1 to 4. Road layouts and geometries were assessed using the Nepal Urban Road Standard 2020 (Ministry of Urban Development, 2020), along with recommendations on geometric and functional road features, intersection design, road safety management, and lighting. These standards helped define “non-compliant” conditions and establish Bi values.
Table 2 lists the base values for each element or defect, as determined from expert input. Using these values, K1i and Bi were established. Further values for K2i, K3i, K4i, and K5i were derived from road safety inspections on three key roads within Kathmandu Metropolitan City, chosen based on general public perception of their safety. The methodology was applied to assess multiple safety factors across these roads.
Road Inspections
The road safety inspection of three major urban roads in Kathmandu Metropolitan City, Chabahil to Boudha, Durbar Marg to Kesar Mahal, and Kalimati to Balkhu, offers key insights into safety conditions along these high-traffic corridors. Covering a combined length of 4,334 metres divided into 44 sections, these roads were selected due to their significant role in the city’s traffic network, featuring sidewalks, four lanes, urban furniture and roadside parking. With a maximum allowable speed of 40 km/h, there is continuous vehicle and pedestrian interactions on these roads, underscoring the importance of safety measures.
Chabahil to Boudha Road
The inspection of the Chabahil to Boudha Road highlights critical areas of concern regarding urban road safety in Kathmandu. Spanning 1,880 metres, this route experiences substantial vehicular and pedestrian movement but lacks essential safety features. Dividing the road into 19 uniform sections allowed for a consistent and detailed analysis of road safety conditions, revealing significant insights into the factors contributing to elevated road crash risks.
The SIR analysis identified Sections 12, 18, and 19 as high-risk zones, with Section 12 recording the highest risk level. The primary factors contributing to the increased risk in these sections include steep longitudinal slopes (G2) and poor visibility at intersections (J1). These conditions pose particular hazards in high-traffic environments, where limited visibility and challenging slopes increase the likelihood of both vehicle and pedestrian crashes. Such findings underline the importance of focusing on road geometry and visibility improvements to enhance safety in urban areas. In particular, addressing these slope and visibility issues could reduce the risk of rear-end collisions, vehicle rollovers and pedestrian incidents, which are prevalent in areas with similar features globally.
Table 3 presents the SIR values with a visual distribution of risk levels, showing that Sections 12 and 19 fall into the critical category with scores above 40 percent. This suggests that these sections not only have more severe safety issues but also indicate potential design flaws that were overlooked or have deteriorated over time. Sections 1, 11, and 16 also exhibit elevated risk (30-40%), reinforcing the need for targeted interventions beyond the critical areas. Meanwhile, sections with low to moderate risk suggest safer conditions, likely due to the presence of fewer infrastructure deficiencies or lower VRU interactions. However, even moderate-risk sections may benefit from preventive safety enhancements, such as improved signage and lighting.
The BIR value derived from SIR Values (Table 3) for the Chabahil to Boudha Road was calculated at 36.28 percent, indicating a very high overall risk level for the route. This branch-level risk is derived from the aggregation of SIR values across all constituent sections. Section-level analysis reveals considerable variation in risk levels, with Sections 12 and 19 categorised as critical (48.5% and 46.9%, respectively, marked in burgundy), and Section 18 classified as very high risk (37.6% red). Sections 8-11 and 16 exhibit high risk (orange), while others range from moderate (yellow) to low risk (green). This spatial variation highlights specific segments requiring urgent safety interventions, particularly the critical sections where risk concentrations are highest.
Durbar Marga to Kesar Mahal Road
The total length of the Durbar Marg to Kesar Mahal Road is 678 metres, which can be travelled by motor vehicle in approximately three minutes under typical traffic conditions. Although vehicular movements on this road are moderate, they include most essential urban features assessed during the road safety inspection, with only a few elements missing. For the purposes of inspection, this road was divided into 7 sections, each around 100 metres, to ensure a consistent evaluation of road safety conditions and to identify any persistent defects within each segment. Observations were focused on traffic flow and VRUs activity, with road element defects documented through photographs and geotagged videos. This detailed inspection contributes to a comprehensive assessment of the 51 road defects identified above.
The analysis of the SIR for each section of the Durbar Marg to Kesar Mahal Road (Table 3) identified Section 7 as the segment with the highest risk, at just under 20 percent, categorising it in the low risk range (green). The slightly elevated risk in this section is mainly due to missing traffic lights at a major intersection (S6) and hazardous intersection manoeuvres (J3). In contrast, Sections 1, 2, 3, 4, 5 and 6 all displayed low to very low risk levels, with SIR scores falling below 15 percent, classifying them in the low-risk category (green). Sections 1 to 6 are marked as not relevant due to its minimal risk level. The SIR Chart visually supports these findings, highlighting Section 7 as the only low-risk section, while the remaining sections maintain not relevant risk levels. These visuals collectively indicate that the Durbar Marg to Kesar Mahal Road has an overall low risk profile.
The BIR for the Durbar Marg to Kesar Mahal Road was calculated at 15.71 percent, indicating an overall low level of risk and affirms its classification as one of the safest roads in the study. The SIR analysis shows that all sections, except Section 7, are categorised as not relevant for risk (white), with SIR values ranging from 2.4 percent to 14 percent. Section 7 has the highest SIR at 19.6 percent, placing it in the low-risk category (green). This low-risk profile suggests that the road has minimal safety concerns, with only Section 7 requiring modest attention for potential improvements.
Kalimati to Balkhu Road
The Kalimati to Balkhu Road spans 1,776 metres and can be travelled by motor vehicle in approximately four minutes under typical traffic conditions. Despite this, vehicular movement is moderate to high, with several essential urban road features absent. For the inspection, the road was divided into 18 sections of around 100 metres each, ensuring uniformity in assessing road defects. The inspection involved observing traffic and VRU movements, and documenting road element defects through photographs and geotagged videos.
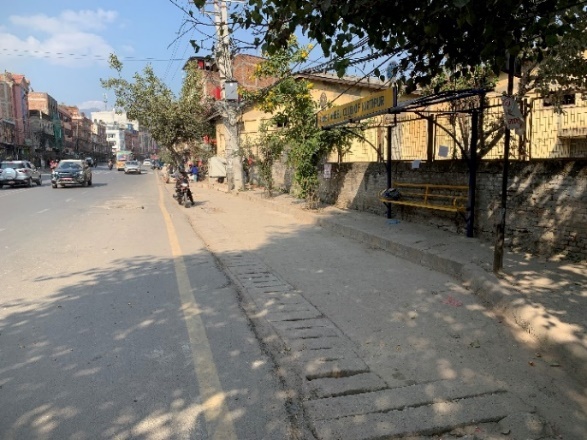
The SIR analysis for the Kalimati to Balkhu Road identified Sections 10 and 11 as the most hazardous, followed by Sections 9, 12, and 18. Figure 5 shows the poor management of the only bus stop on the road. Key issues in these sections include incomplete horizontal road markings (S2), distressed sidewalk pavement forcing pedestrians onto the carriageway (C8), and intersections with limited visibility (J1), which contribute to higher road crash risk. In the SIR Chart, Sections 10, 11, and 12 are marked in dark red, falling into very high and critical risk categories with scores above 40 percent. Sections 9 and 18 are shown in orange, indicating high risk, while the remaining sections fall into low to moderate risk, represented in green and yellow with scores below 20 percent. This distribution highlights that while certain sections need immediate attention, others are relatively safer.

The BIR for the Kalimati to Balkhu Road is 37.82 percent, indicating a very high-risk level, higher than the Chabahil to Boudha Road. Sections 9, 10, 11, 12, and 18 are rated as critical risk (burgundy), with Section 8 at very high risk (red). Lower-risk sections include Sections 2-7 (low, green) and Sections 14-17 (moderate, yellow). Contributing factors include missing medians, poor visibility at intersections, and inadequate pedestrian facilities, raising collision risks. Traffic police notices such as warning signs explaining in high crash risk zones that highlight the need for further investigation into these defects.
Discussion
This study provides a detailed analysis of urban road safety in Kathmandu, specifically assessing three major urban roads that represent the overall urban road safety: Kalimati to Balkhu Road, Chabahil to Boudha Road, and Durbar Marg to Kesar Mahal Road. The Section Index Risk (SIR) and Branch Index Risk (BIR) analyses revealed varying safety risks across these roads. Although, exact disaggregated data on fatalities and serious injuries for the three studied roads were not available, a black spot map (Figure 3) indicates a high density of crashes in and around these road sections. While this does not quantify severe outcomes, it serves a proxy measure of their relative importance in the Kathmandu valley road safety context.
The Kalimati to Balkhu Road showed the highest overall risk (BIR: 37.82%), with key risk factors such as poor visibility, steep slopes, and lack of pedestrian infrastructure. The Chabahil to Boudha Road also exhibited significant safety concerns (BIR: 36.28%), particularly in Sections 12 and 19, which were marked by poor intersection visibility and steep longitudinal slopes. Durbar Marg to Kesar Mahal Road, however, showed a relatively lower risk (BIR: 15.71%), though Section 7 still posed moderate safety concerns.
These findings align with broader trends observed in Kathmandu’s road safety statistics, as reported by the Kathmandu Valley Traffic Police Office (KVTPO). Between 2013/14 and 2022/23, road crashes, injuries, and fatalities have shown a consistent rise, peaking at 10,733 crashes in 2021/22, with fatalities and serious injuries also exhibiting an upward trend. The SIR and BIR analyses support these findings, showing that high-risk sections in Kathmandu often correlate with factors such as traffic congestion, poor road design, and insufficient infrastructure for VRUs. This suggests that as traffic volumes continue to grow in Kathmandu, road safety concerns will become more pressing, requiring increasingly urgent policy attention and action.
Key risk factors identified in this study, such as poor intersection design, lack of pedestrian crossings, and inadequate road signage, are consistent with the findings from the KVTPO’s Trends, Determinants, and Key Factors of Road crashes report (KVTPO, 2024). According to the KVTPO, driver negligence and high speed are the primary causes of road crashes, and poor road conditions were notably prevalent in the period from 2018/19, aligning with the observed risk factors in high-risk road sections like Sections 10 and 11 of Kalimati to Balkhu Road. As noted in the KVTPO’s data, road crashes and fatalities continue to rise, particularly among males and the 17-35 age group. This demographic is highly vulnerable, as reflected in the identified hazardous sections along Kalimati to Balkhu Road and Chabahil to Boudha Road, which also suffer from insufficient safety measures for pedestrians and cyclists.
The analysis highlighted that road crashes in Kathmandu peak between 12PM and 6PM, a pattern that matches the increased traffic volumes observed in the city during these hours. The SIR and BIR analyses also align with this temporal distribution of risk, with sections like Sections 12 and 19 of Chabahil to Boudha Road exhibiting critical risk levels due to poor visibility at intersections and lack of pedestrian facilities. These findings emphasise the importance of addressing infrastructure gaps, particularly at major intersections and high-traffic areas.
In line with existing road safety policies such as the Nepal Urban Road Standard (Ministry of Urban Development, 2020), that emphasises the need for comprehensive road safety management and better infrastructure for VRUs, the study reveals significant areas where Kathmandu’s urban road infrastructure is lacking. Pedestrian crossings, traffic signal systems, and dedicated lanes for VRUs are often missing or poorly maintained, contributing to high road crash risks in certain areas. These findings support the policy recommendations made by UNCTAD (2017), ITF ((2022) and Nepal Road Safety Action Plan (2021-2030) which advocates for improvements in road design, speed control measures, and enhanced pedestrian facilities.
The SIR analysis for the Chabahil-Boudha Road identified Sections 12 and 19 as the highest-risk zones, mainly due to steep slopes and poor intersection visibility. This finding is consistent with Demasi et al. (2018), who reported similar challenges in an Italian municipality and recommended targeted interventions such as improved signage and slope management to reduce crashes. Similarly, Cabrera-Arnau et al. (2020) showed that road design improvements significantly reduced crash rates in comparable urban contexts, suggesting that similar measures could be effective in Kathmandu. Turner et al. (2021) further emphasises that relatively inexpensive measures, including medians, barriers, rumble strips, speed management, can substantially reduce deaths and serious injuries when appropriately targeted in low and middle-income countries.
This study underscores critical infrastructure deficiencies and risk zones on Kathmandu’s major urban roads. The findings highlight the need for targeted interventions, including enhanced pedestrian infrastructure, improved intersection visibility, and correction of road design flaws. International experience in low-and middle-income countries (LMICs) demonstrates the effectiveness of such measures. For example, the application of iRAP protocols has substantially reduced fatal and serious injuries (FSI) worldwide and is estimated to save about 7,157 FSI annually in Nepal (Li et al., 2024). Similarly, reducing mean speeds has been consistently associated with declines in crash frequency and severity. On Australian urban roads a 3.4 percent reduction in mean speed corresponded to a 25.3 percent decrease in all injury crashes (ITF, 2018). Further, Turner et al. (2021) recommends the use of relatively low-cost countermeasures, particularly to in LMIC contexts, with substantial potential reductions of FSI including: barriers (80% reduction), pedestrian footpaths (60% reduction) medians (50% reduction), traffic calming measures (e.g., humps and chicanes) (40% reduction) and traffic signs and line markings (25% reduction).
In Kathmandu Valley, a general speed limit of 50 kmph is enforced, and low-cost countermeasures such as traffic signs and road markings are in place. However, their effectiveness is limited as they are poorly maintained and often faded. By prioritising high-risk areas and instituting regular inspections, Kathmandu can align with national road safety policies and develop a data-driven framework for road safety management. Such actions would create safer environment for all road users, particularly vulnerable groups.
Study strengths and limitations
A key strength of this study is the focused assessment of road sections to identify the key safety concerns particularly as they relate to vulnerable road users. By assessing the roads with high volumes of pedestrian and motor vehicle activity at micro segments (100m), the variations are captured that are typically missed at more macro or network level assessments. Further, while the detailed methods used to assess these segments are included, the study findings are presented in a simple, colour-coded report that is easily interpreted by government policy makers. This simple green to burgundy rating captures the complex analysis in a meaningful way that ensures decision makers can focus on prioritising locations and action using a clear evidence-based approach.
A limitation of this study is its focus on infrastructure defects without considering factors like driver behaviour or weather conditions, which also influence crashes. Future studies could integrate these variables and use real-time traffic data to explore the impact of traffic management, as highlighted by Christoforou et al. (2012) in their study of the A4-A86 highway in Ile-de-France, France.
Conclusion
This study assessed road safety risks on urban roads in Kathmandu using Section Index Risk (SIR) and Branch Index Risk (BIR) models. The findings show that Kalimati to Balkhu Road has the highest risk (BIR: 37.82%), followed by Chabahil to Boudha Road (BIR: 36.28%) and Durbar Marg to Kesar Mahal Road (BIR: 15.71%). High-risk sections were linked to poor visibility, steep slopes, inadequate pedestrian infrastructure, and missing signage. These results highlight the urgent need for targeted improvements, especially in areas with high pedestrian activity.
The methods and findings are relevant to cities facing similar challenges in South Asia and other rapidly urbanising regions. Policymakers and planners can use this framework to identify and address road safety issues effectively. Future research should include factors like traffic behaviour and weather conditions to provide a more complete understanding of road safety risks. Expanding this approach to other cities could help develop broader strategies for safer and more inclusive urban roads.
Acknowledgements
The authors wish to acknowledge Mr. Hemant Tiwari and Mr. Vibek Gupta for their contribution in collecting data.
AI tools
ChatGPT 4.0 was used to improve English expression and clarity.
Author contributions
Conceptualisation: Mr. Parasar Ghimire; Methodology: Dr. Sanjaya Uprety and Mr. Parasar Ghimire; Data collection: Mr. Parasar Ghimire; Analysis: Mr. Parasar Ghimire and Dr. Sanjaya Uprety; Draft preparation: Mr. Parasar Ghimire; Review and editing of final draft: Dr. Sanjaya Uprety and Mr. Parasar Ghimire; Supervision: Dr. Sanjaya Uprety.
Funding
This research was supported by funding from the Metropolitan Research Fellowship Program (2023), provided by Kathmandu Metropolitan City, Nepal, which facilitated data collection, analysis, and other research activities. The exact amount of funding provided by KMC was NPR. 132,700 after local taxes.
Human research ethics review
The study protocols were approved by the Government of Nepal Home Ministry, Kathmandu Valley Traffic Police Office, Reference number 925.
Data availability statement
All data in this study were collected by the authors. Road crash data were officially obtained from the Kathmandu Valley Traffic Police Office (KVTPO) in 2023, while additional data, materials, and photographs were gathered during field inspections. These, along with analyses, are available upon request via email from the corresponding author.
Conflict of Interest
The authors declare that there is no conflict of interest regarding the publication of this research. The funding agency had no role in the design of the study, data collection, analysis, interpretation, or manuscript preparation.