

Introduction
Injuries from crashes on the road are a significant global public health challenge, with approximately 1.35 million fatalities and 50 million injuries occurring annually worldwide (Lancet, 2022). Low- and middle-income countries bear a disproportionate burden, accounting for approximately two-thirds of road traffic deaths despite having only half of registered vehicles globally (WHO, 2023). In Africa, median proportion of injuries among trauma patients is estimated to be at 32% (Vissoci et al., 2017)
In Ghana, the National Road Safety Authority has reported a consistent yearly increase in road traffic crashes, with 13,048 non-fatal injuries recorded in the year 2021 (National Road Safety Authority, 2021). Among the 16 regions in Ghana, Ashanti region recorded about a quarter of the total fatalities for the year 2021 (Hesse et al., 2022; National Road Safety Authority, 2021). Key high-risk locations in the capital of the Ashanti region, including Anloga Junction, Boadi Junction, Amakom Traffic Intersection, Krofrom Traffic Intersection, and Abrepo Junction, have been pinpointed as significant contributors to these fatalities (Anane, 2022). These incidents highlight the substantial public health burden as well as the broader socio-economic consequences, such as labour losses that can impede economic growth (Kumasi Metropolitan Assembly, 2021). In addition to the immediate human impact, road traffic injuries incur significant economic costs through medical expenses, reduced productivity and societal effects (Blankson & Lartey, 2020).
Environmental factors have been identified as increasing crash risk as rain, fog and wind can affect road surface conditions, visibility, and driver behaviour (Elyoussoufi et al., 2023). Some studies have also investigated vehicle characteristics, road conditions (Ackaah et al., 2020; Blankson & Lartey, 2020) and human factors (Hesse et al., 2022; Wang et al., 2022) as determinants of traffic injuries. However, studies on the weather-road traffic relationship primarily focus on general crash patterns rather than examining specific effects across specific road user categories. As a result, the influence of weather-related factors on non-fatal injuries among different road users remains understudied.
The aim of this study was to investigate the association between climate factors (temperature and rainfall) and non-fatal road traffic injuries among different road user types (pedestrians, motorcyclists, and vehicle occupants) in a major metro area in Ghana. Insights from this study will contribute to the evidence base for targeted interventions and provide understanding for developing context-specific strategies to achieve the Global Plan for the Second Decade of Action for Road Safety goal of reducing traffic injuries by 50 percent by 2030 (WHO, 2023).
Methods
Study Design
This study used a cross-sectional research design to assess the association between climate factors (temperature and rainfall) and non-fatal road traffic injuries among different road user types at a specific point in time. This design was chosen because it enables the efficient collection and analysis of data from a defined population.
The use of only non-fatal injuries was because: (1) non-fatal injuries represented the majority of road traffic incidents and impose significant healthcare and socioeconomic burdens (2) injury patterns may differ from fatality patterns in their relationship to weather conditions, as weather may increase crash frequency without necessarily increasing fatality rates; and (3) focusing on injuries allows for more robust statistical analysis. Likewise, the climate data including monthly temperature and rainfall was obtained from Ghana Meteorological Agency (GMet) (Ghana Meteorological Agency, 2023).
Study Area
The study was conducted within the Greater Kumasi Metropolitan Area (GKMA) in Ghana. Located in south-central Ghana, with a population of 2.9 million, GKMA is the second largest metro area in Ghana after the Greater Accra Metropolitan Area (GAMA, 5.6 million). The GKMA is situated between Latitude 6.35° N and 6.40° S and Longitude 1.30° W and 1.35° E. Additionally, it is positioned at an elevation ranging from 250 to 300 metres above sea level and occupies an area of 254 square kilometres (Kumasi Metropolitan Assembly, 2023). The GKMA is experiencing dramatic changes due to where rapid urbanisation, population growth, and infrastructure development (including highway expansions) that have likely contributed to the observed seven-fold increase in injury risk (Kumasi Metropolitan Assembly, 2023).
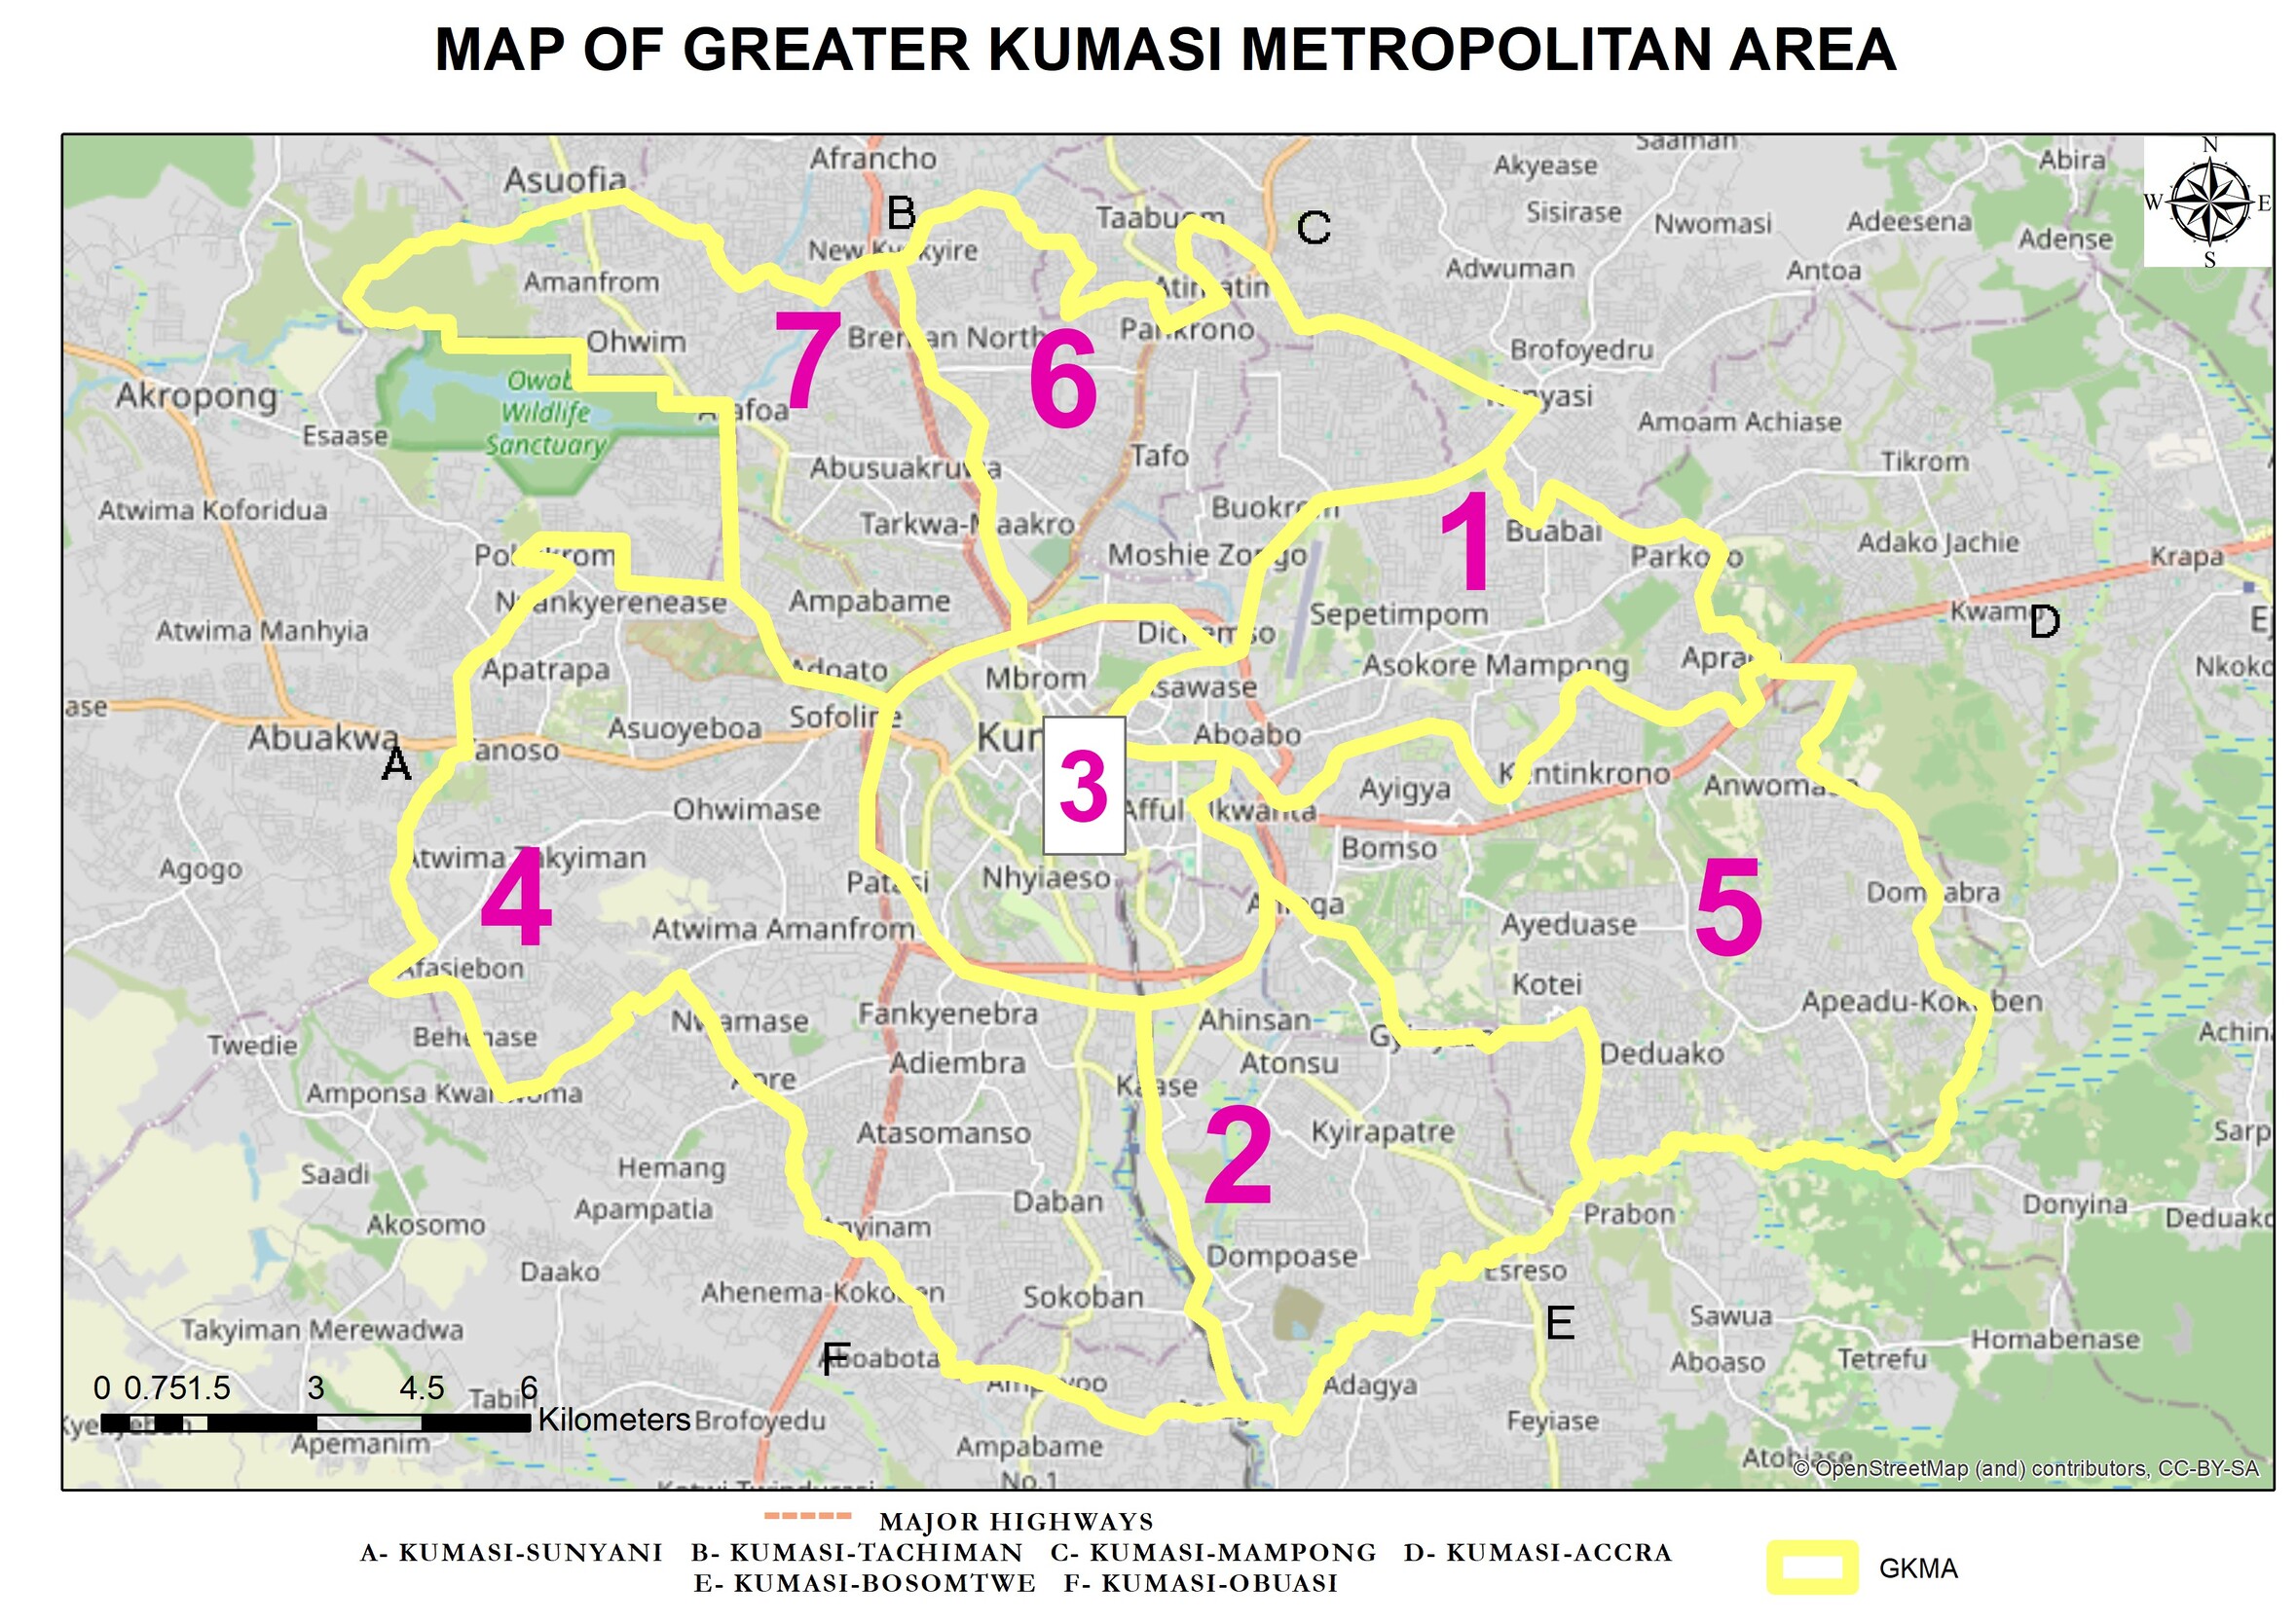
Figure 1 shows the seven distinct municipal districts of GKMA: 1) Asokore Mampong Municipal; 2) Asokwa Municipal, 3) Kumasi Metropolitan; 4) Kwadaso Municipal; 5) Oforikrom Municipal; 6) Old Tafo Municipal and; 7) Suame Municipal. Asokore Mampong Municipal and Old Tafo Municipal are primarily residential areas with growing commercial activity. Asokwa Municipal serves as a mixed-use district combining residential and commercial zones. Kumasi Metropolitan is the urban core with the highest population density and most developed infrastructure. Kwadaso Municipal is characterised by major highway intersections and rapid infrastructure development. Oforikrom Municipal is an emerging residential and commercial district. Suame Municipal is known for its industrial and artisanal activities, particularly automotive repair and manufacturing (Kumasi Metropolitan Assembly, 2023). The GKMA encompasses several major highways, including the Kumasi-Bibiani/Sunyani, Kumasi-Techiman, Kumasi-Mampong, Kumasi-Accra, Kumasi-Bosomtwe, and Kumasi-Obuasi/Cape Coast highways.
Data sources and analysis
Monthly data for non-fatal injuries from crashes were obtained from Building and Road Research Institute (BRRI) (Council for Scientific and Industrial Research-Building and Road Research Institute, 2023) for the period of 2010 to 2021. Additional information on population density was obtained from the Ghana Statistical Population Census Report.
The road traffic injury and climate data were pre-processed to ensure data quality and consistency. This involved checking for missing values, outlier detection, and data cleaning procedures. Relevant variables were selected based on prior knowledge, literature review, and exploratory data analysis. The outcome variable of interest was the monthly count of road traffic injuries within the study area. Road traffic injuries were injuries requiring hospitalisation for over 24 hours as a result of a road traffic crash. Predictor variables included climatic factors (that is monthly average temperature and monthly average rainfall) and potential confounders such as population density, time and land area.
A Bayesian geospatiotemporal modelling approach was used to examine the complex relationships between climate variables and road traffic user type injuries, while accounting for spatial and temporal dependencies (Blangiardo & Cameletti, 2015). This approach is particularly suited for analysing spatially correlated count data with temporal correlation patterns (Rue et al., 2009). The Besag-York-Mollié (BYM) model formulation follows Besag et al. (1991) and has been successfully applied in similar epidemiological contexts (Blangiardo & Cameletti, 2015). The model specification was as follows:
yit ∼ Poisson(μit)+εit
E=α+β1[MAT]+β2[MAR]+wt+zit+εit
Where;
yit is observed count for the area i at time t
μit is expected count / mean
E represent each of the respective monthly road traffic user type injuries
α is the intercept
MAT is the monthly average temperature
MAR is the monthly average rainfall
is the spatial effect
is the temporal effect
is the spatiotemporal interaction effect
is the error term.
The model incorporated both spatial and temporal random effects to account for unobserved heterogeneity and dependencies across geographic areas and time periods, respectively. The correlation matrix is an autoregressive matrix of order 1(AR(1)) (Hannan & Kavalieris, 1986).
The AR(1) temporal correlation structure is highly relevant to our study as it accounts for policy changes and infrastructure developments that occurred during 2010-2021. This is particularly important given the dramatic changes observed in GKMA and the increased injury risk. The AR(1) structure ensures our model captures these gradual temporal changes as distinct from weather-related effects.
The function also uses the BYM spatial model (Besag et al., 1991) to separate the effect of space from other random effects that are not explained. The BYM model assumes a linear combination of an identity matrix and a spatial adjacency matrix. Appropriate prior distributions were assigned to the model parameters, reflecting available prior knowledge or expert opinions. The following prior distributions were assigned: weakly informative normal priors N (0, 1000) for fixed effects coefficients, reflecting minimal prior knowledge while ensuring computational stability; log-gamma priors Gamma (1, 0.005) for precision parameters of random effects; and uniform priors on the mixing parameter for the BYM spatial component. The spatial adjacency matrix was constructed based on shared geographical boundaries between the seven municipal districts. These prior specifications follow standard Integrated Nested Laplace Approximation (INLA) recommendations for spatiotemporal models (Rue et al., 2009) and ensure proper posterior distributions while allowing the data to drive the inference. The INLA algorithm was used to approximate the marginal posterior distributions of the model parameters and hyperparameters. Posterior means and credible intervals were obtained for the effects of climate variables on road traffic crashes.
Data Tools
The Bayesian geospatiotemporal modelling and associated analyses were implemented using the R statistical computing environment (RStudio, 2023) and the “INLA” package (van Niekerk et al., 2019). Additional R packages, such as “dplyr” package (Hadley et al., 2023), “ggplot2” package (Wickham et al., 2016), “lubridate” package (Grolemund & Wickham, 2011) and “sf” (Pebesma, 2018), were utilised for spatial data handling and visualisation. Also, the study employed statistical tools such as ArcGIS software version 10.7.1 (ESRI, 2019).
Results
Participant Characteristics
During the study period (2010-2021), a total of 8,772 non-fatal road traffic injuries were recorded in the Greater Kumasi Metropolitan Area. The injuries were distributed across three main road user categories: vehicle occupants (n=3,720, 42.4%), pedestrians (n=2,936, 33.5%), and motorcyclists/tricyclists (n=2,030, 24.1%) (Table 1). The mean monthly injury rates varied across road user types, with vehicle occupants showing the highest average (3.7 ± 2.8 injuries per month), followed by pedestrians (2.9 ± 2.3 injuries per month), and motorcyclists/tricyclists (2.0 ± 1.6 injuries per month).
Climate variables during the study period showed considerable variation, with monthly average temperatures ranging from 22°C (minimum) to 31°C (maximum). The median monthly rainfall was 3.95mm (IQR: 2.00-6.60mm).
Spatio-Temporal Climate and Injury Association
Bayesian spatiotemporal regression analysis revealed significant associations between rainfall and injuries across all road user types. For rainfall, each millimetre increase in monthly rainfall was associated with an increase in injuries across all road user categories (pedestrians, 1.7% ; motorcyclists/tricyclists, 1.7%; vehicle occupants, 1.6%).
However, temperature effects were not statistically significantly associated with injuries for any of the road user groups (Table 2).
Spatiotemporal Relative Risk of Injuries by Road User Type
The Bayesian spatiotemporal modelling revealed complex patterns of injury risk across different road user types and districts throughout the study period (2010-2021), with notable variations in both magnitude and temporal trends.
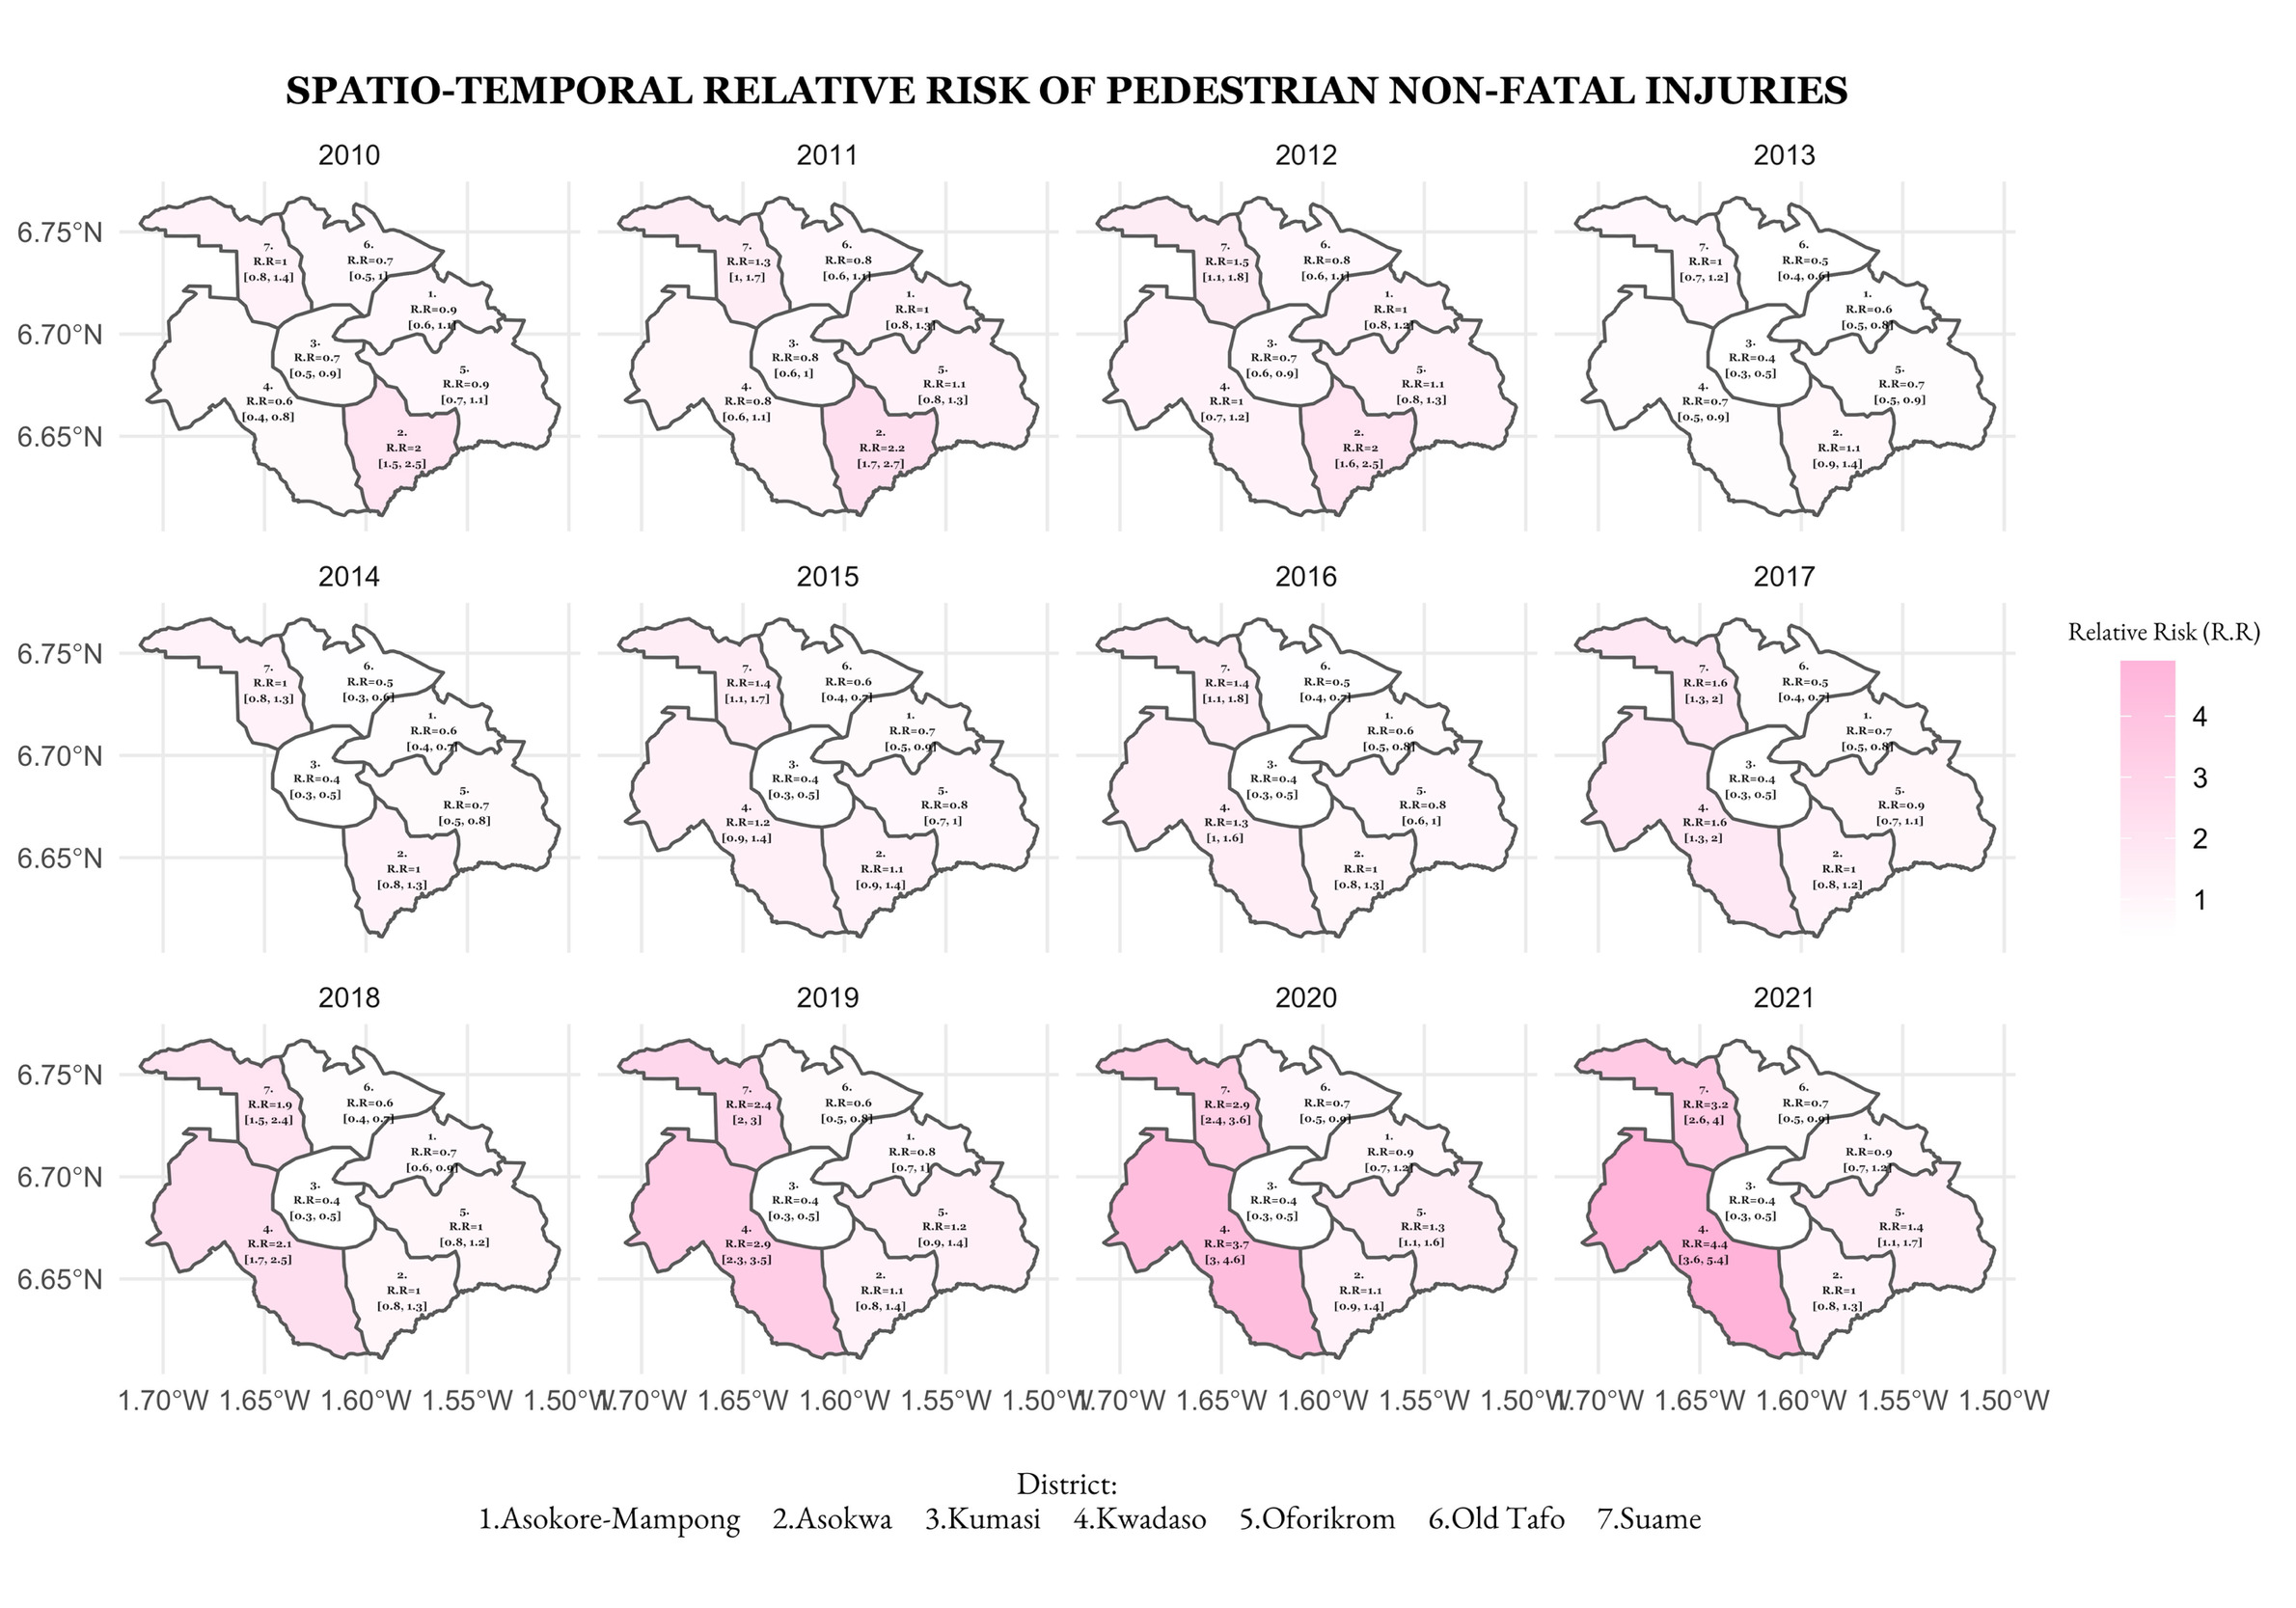
Pedestrian Injury Risk
Pedestrian non-fatal injury risk demonstrated a distinct evolutionary pattern across the study period, with variations between districts as shown in Figure 2. Kwadaso Municipal exhibited the most concerning trend, showing an increase from relatively moderate levels of 0.6 in 2010 (RR: 0.6; 95% CI: 0.4-0.8) to alarmingly high risks of 4.4 by 2021 (RR: 4.4; 95% CI: 3.6-5.4), representing approximately a seven-fold increase over the study period. Similarly, Suame Municipal showed an upward trend, rising from a relative risk of 1 (RR: 1; 95% CI: 0.8-1.4) in 2010 to 3.2 (RR: 3.2; 95% CI: 2.6-4.0) by 2021. In contrast, Kumasi Metropolitan maintained consistently low risk levels throughout the period, with minimal variation between 0.4 (RR: 0.4; 95% CI: 0.3-0.5) and 0.8 (RR: 0.8; 95% CI: 0.6-1.0).

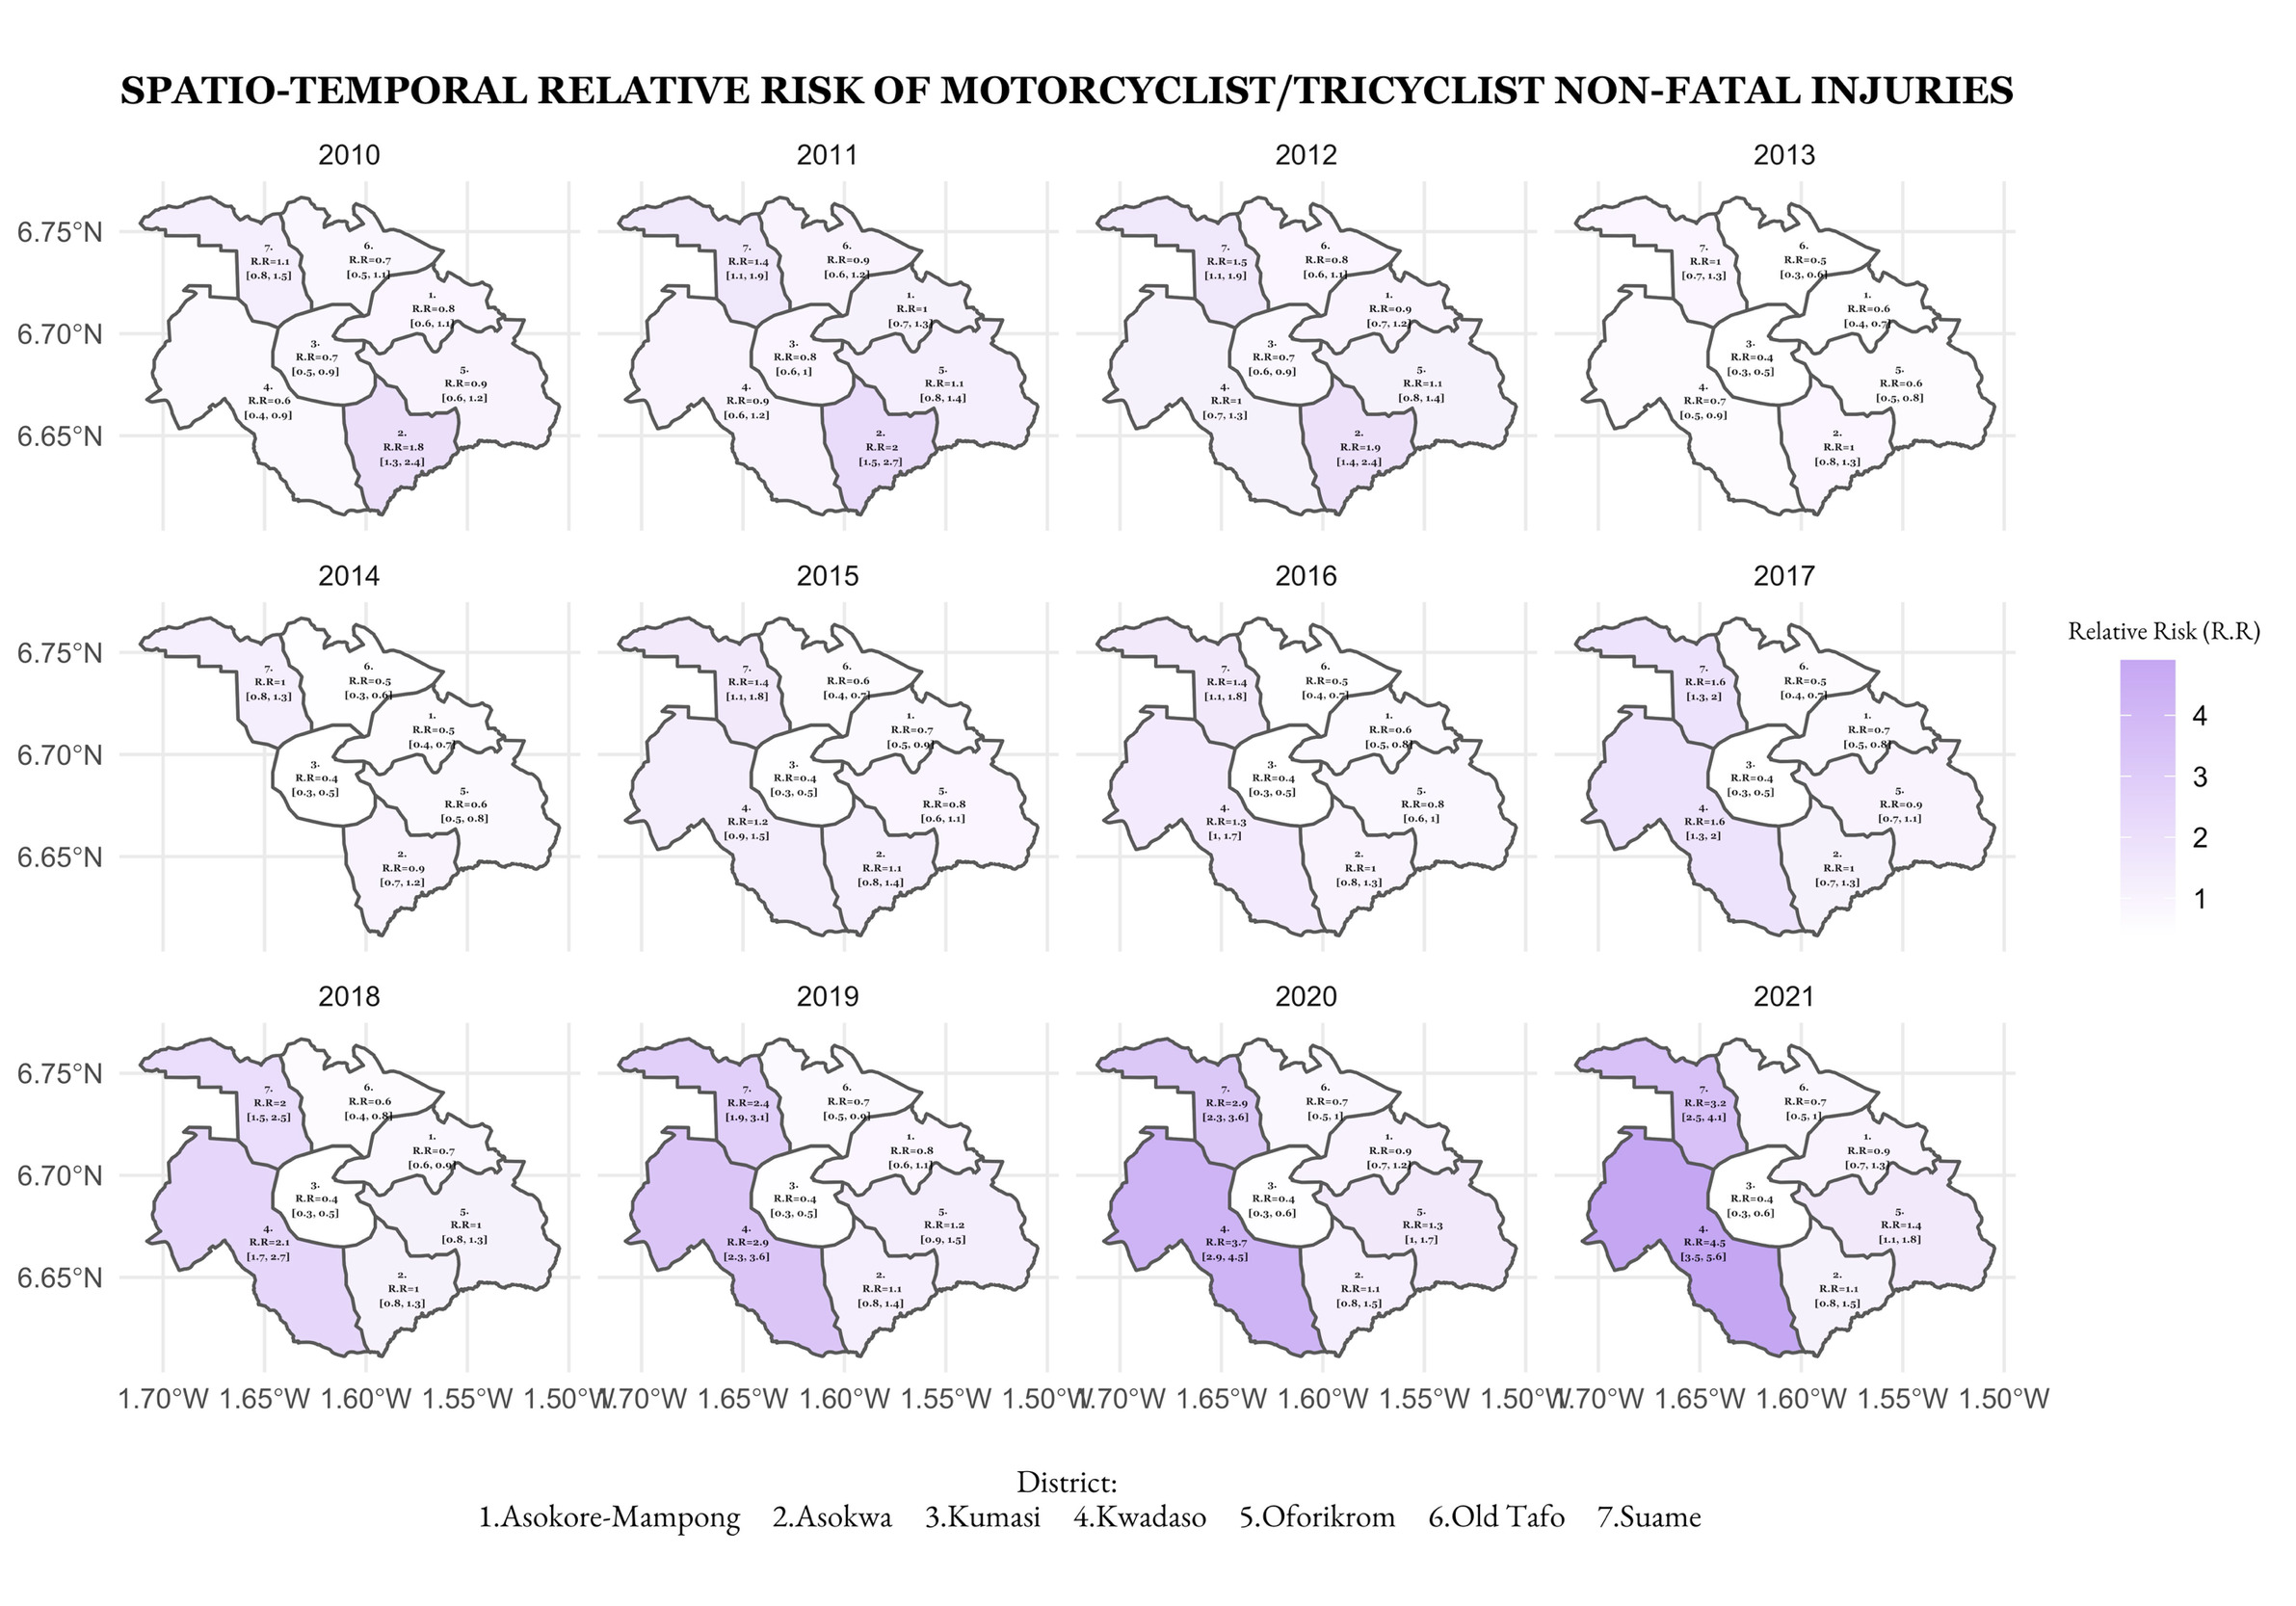
Motorcyclist and Tricyclist Injury Risk
The risk pattern for motorcyclist and tricyclist injuries revealed significant geographical disparities and temporal dynamics (Figure 3). Kwadaso Municipal emerged as the highest-risk area, showing a gradual escalation from 0.6 (RR: 0.6; 95% CI: 0.4-0.9) in 2010 to 4.5 (RR: 4.5; 95% CI: 3.5-5.6) in 2021, with the steepest increase occurring after 2016. Suame Municipal followed a similar trajectory, rising from 1.1 (RR: 1.1; 95% CI: 0.8-1.5) to 3.2 (RR: 3.2; 95% CI: 2.5-4.1). Oforikrom Municipal also maintained a more moderate risk profile, gradually increasing from 0.9 (RR: 0.9; 95% CI: 0.6-1.2) to 1.4 (RR: 1.4; 95% CI: 1.1-1.8).

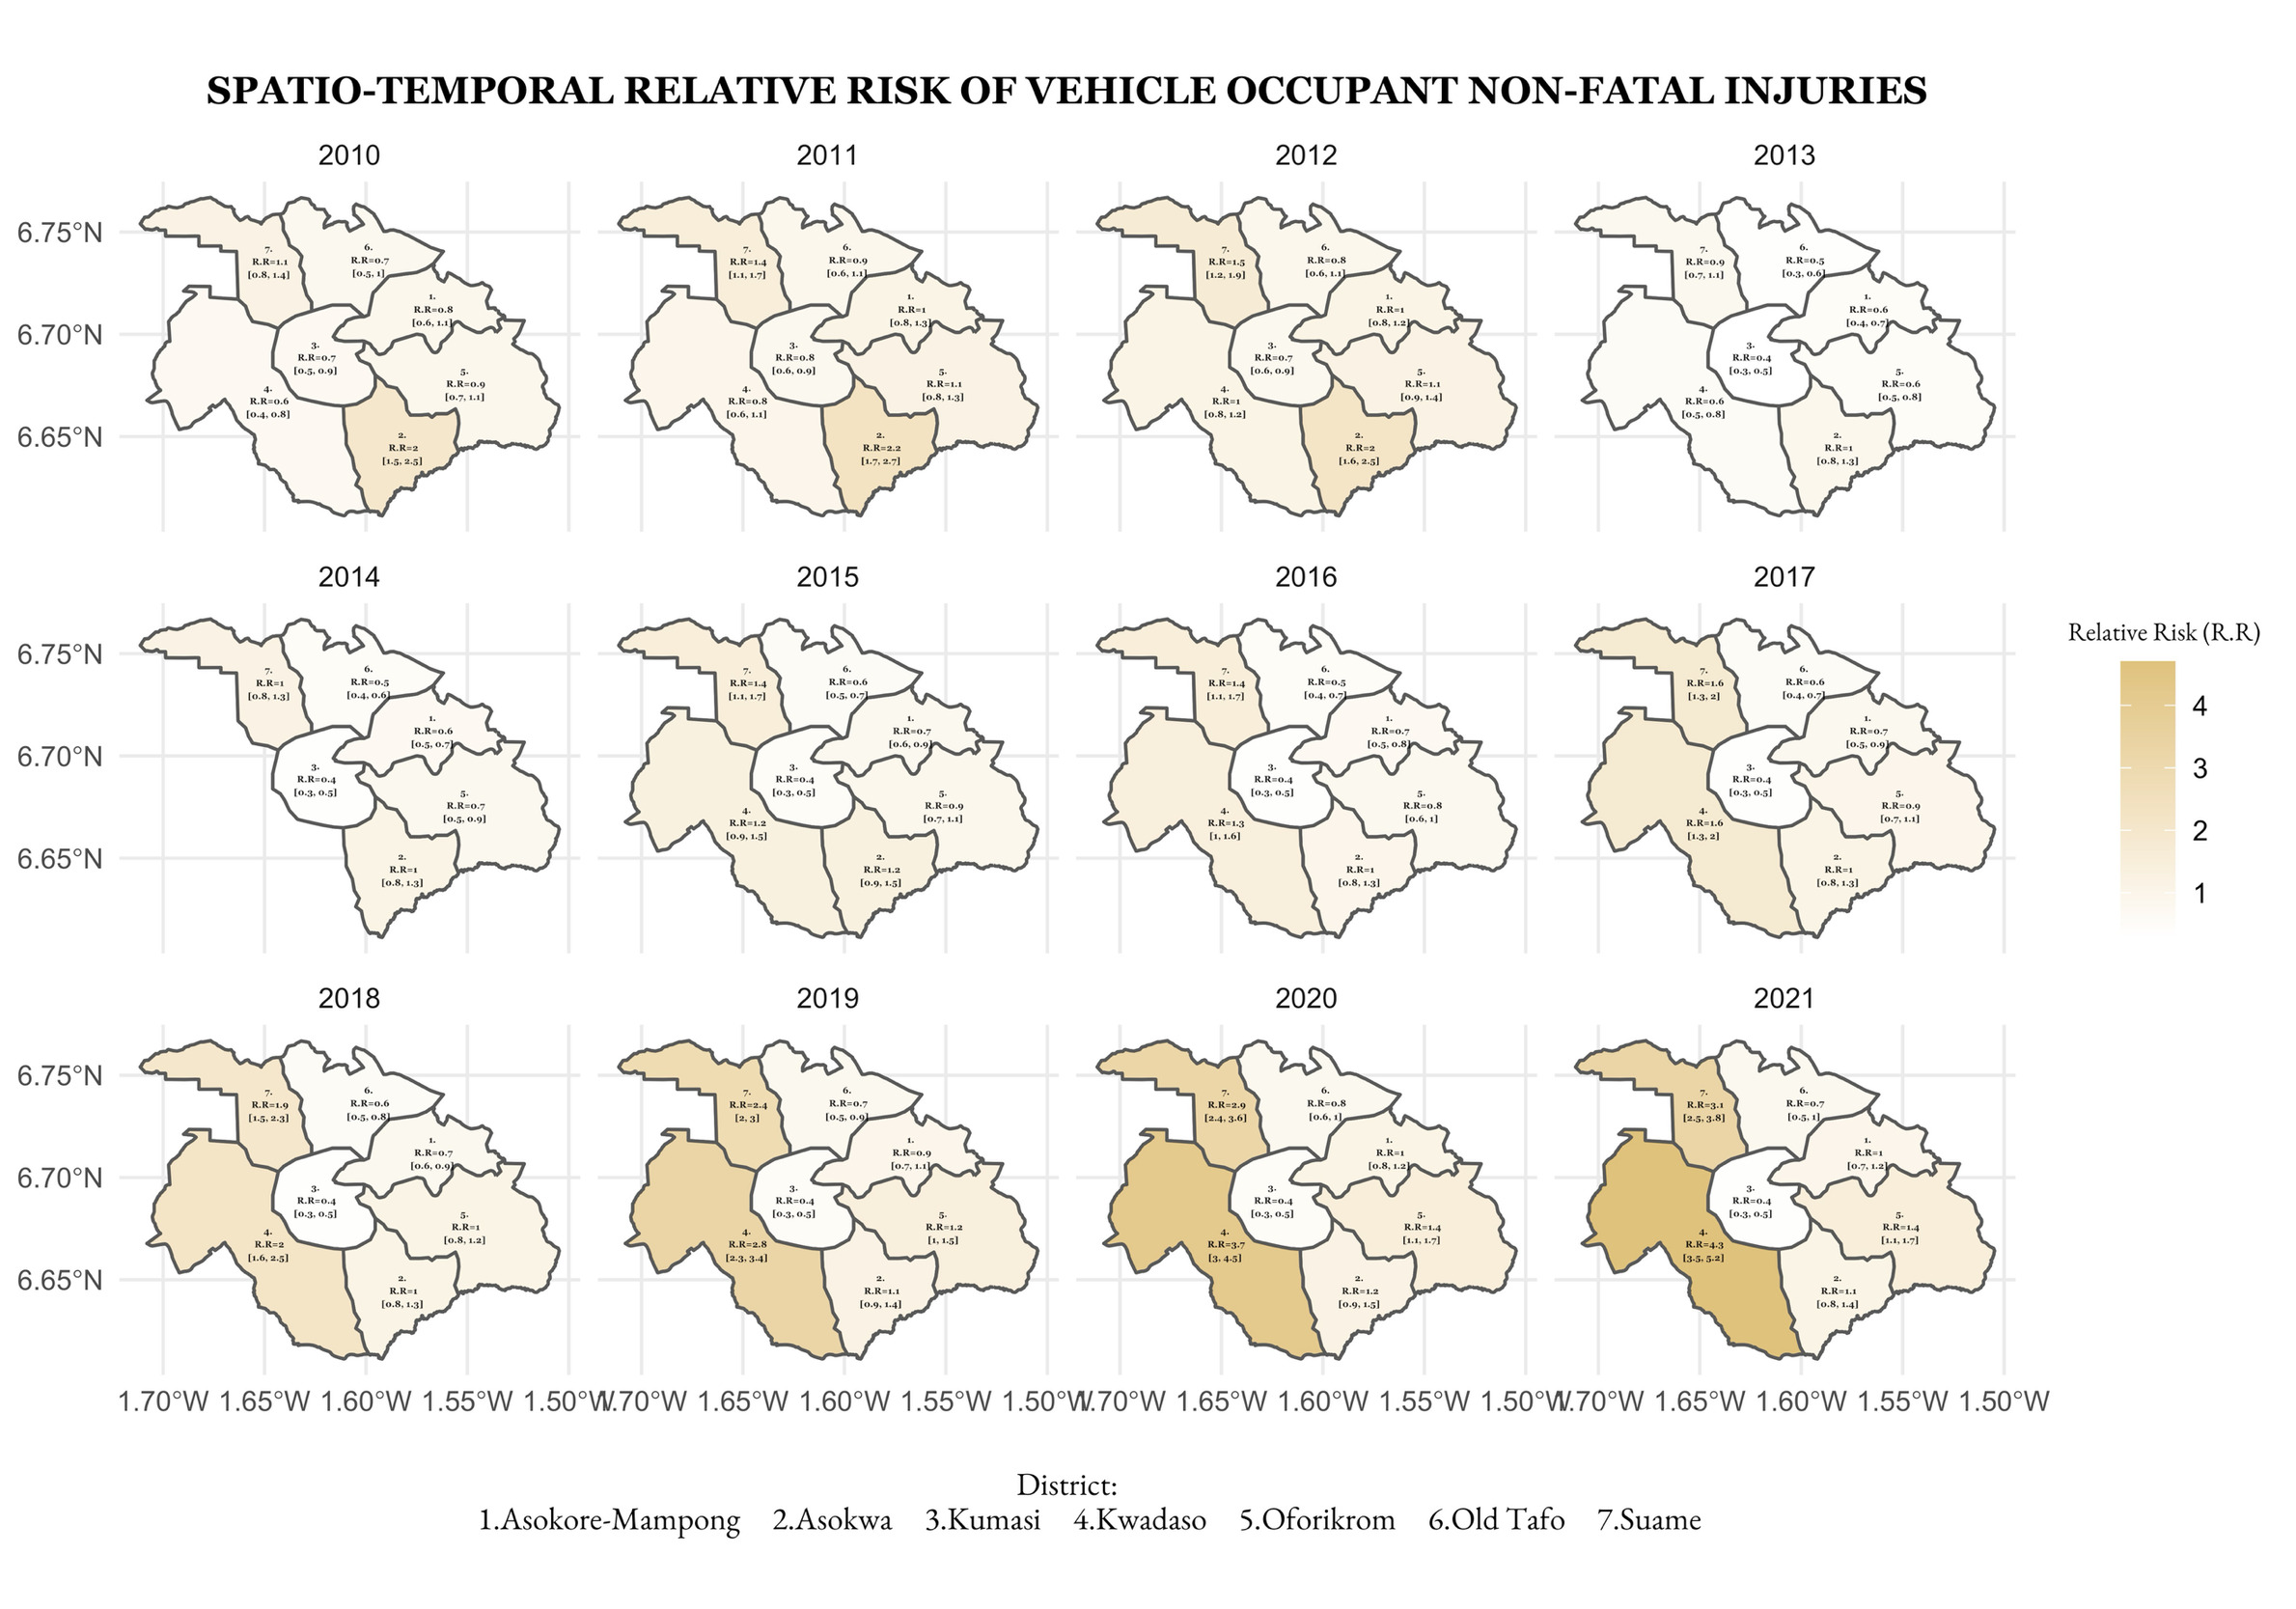
Vehicle Occupant Injury Risk
Vehicle occupant injury risk exhibited distinct spatial patterns and temporal trends across the districts (Figure 4). Kwadaso Municipal showed the most pronounced risk elevation, increasing substantially from 0.6 (RR: 0.6; 95% CI: 0.4-0.8) in 2010 to 4.3 (RR: 4.3; 95% CI: 3.5-5.2) in 2021, representing the highest risk level among all districts. Suame Municipal demonstrated a similar upward trend, though less severe, rising from 1.1 (RR: 1.1; 95% CI: 0.8-1.4) to 3.1 (RR: 3.1; 95% CI: 2.5-3.8). Asokwa Municipal maintained moderate risk levels throughout the period, showing only slight variations around (RR: 1.1; 95% CI: 0.9-1.4). However, Kumasi Metropolitan consistently maintained the lowest risk levels (RR: 0.4; 95% CI: 0.3-0.5) throughout the study period.
Discussion
Road traffic injuries remain a significant public health concern in the Greater Kumasi Metropolitan Area (GKMA), with our analysis of 8,772 non-fatal injuries over an 11-year period revealing important patterns across road user types and districts.
A key finding is the positive correlation between rainfall and increased injuries. With each millimetre increase in rainfall per month, there was a 1.6-1.7 percent increase in injury crashes for pedestrians, motorcyclist/tricyclists and vehicle occupants. This finding provides clear evidence for interventions and guidance in GKMA, other areas in Ghana and in similar low- and middle-income country settings. This aligns with previous research by Aidoo and Ackaah (2021) who reported that Ghanaian road users experienced more serious injuries during adverse weather conditions, particularly on highways. The mechanism behind this association likely involves reduced visibility, decreased tyre traction, and increased stopping distances during rainfall, which collectively impair road users’ ability to avoid collisions (Aidoo & Ackaah, 2021; Sangkharat et al., 2021). Notably, temperature showed no significant association with injury risk, suggesting that rainfall is the primary climatic factor affecting road safety in GKMA.
The distribution of injuries among road user types in our study showed interesting departures from the regional patterns in Africa. Vehicle occupants accounted for the largest proportion of injuries (42.4%), followed by pedestrians (33.5%) and motorcyclists/tricyclists (24.1%). This differs from systematic review data on the Africa region, which reports lower proportions for vehicle occupants (31.4%) and higher proportions for pedestrians (43.2%) and motorcyclists/tricyclists users (42.5%) (Vissoci et al., 2017). The higher proportion of vehicle occupant injuries in GKMA might reflect local transportation patterns, though pedestrian injuries often result in more severe outcomes (Damsere-Derry et al., 2010).
The most striking spatial pattern emerged in the Kwadaso Municipal district, where injury risks increased dramatically across all road user types from 2010 to 2021. The magnitude of this increase was remarkable. Pedestrian and vehicle occupant injury risk increased sevenfold (RR: 0.6 to 4.4) and (RR: 0.6 to 4.3) respectively, while motorcyclist and tricyclist risk increased 7.5-fold (RR: 0.6 to 4.5). These increases likely reflect the district’s rapid urbanisation and increasing traffic volume. Kwadaso district bears two major highways, which may explain the further influence of road infrastructure and traffic patterns on injury risk aside rainfall.
In contrast, the Kumasi Metropolitan area maintained consistently lower risk levels despite being a major urban centre. This counterintuitive finding might be explained by slower traffic speeds due to congestion and better infrastructure in the metropolitan core (Ackaah et al., 2020; Kumasi Metropolitan Assembly, 2021; McWade et al., 2017; Yahaya et al., 2021; Yousefifard et al., 2021).
Study strengths and limitations
This study makes several novel contributions to the scientific literature. The study provides the first comprehensive spatiotemporal analysis of weather-injury relationships in West Africa, filling a critical geographical knowledge gap. Findings demonstrate differential effects across road user types in an African urban context, revealing that weather impacts are consistent across user categories but spatial patterns vary dramatically. The analysis also identified unprecedented spatial heterogeneity in injury risk evolution, with the need for extra policy to focus on usage of major highways. The study also demonstrates the application of advanced Bayesian spatiotemporal methods to injury surveillance data in resource-limited settings.
While our study provides robust evidence for spatiotemporal patterns in injury risk, some limitations should be noted. The analysis relies on reported injuries, which may underestimate the true burden, particularly for minor injuries. Additionally, we cannot fully account for changes in population density, vehicle ownership, or road infrastructure development over the study period, which may influence risk patterns. Also, the study focused exclusively on non-fatal injuries because: 1) non-fatal injuries represented the majority of road traffic incidents and impose significant healthcare and socioeconomic burdens; 2) injury patterns may differ from fatality patterns in their relationship to weather conditions, as weather may increase crash frequency without necessarily increasing fatality rates, and; 3) focusing on injuries allows for more robust statistical analysis.
Implications for Policy and Practice
The study highlights some significant implications for road safety policy and practice in Ghana. Weather-responsive traffic management systems should be prioritised, particularly in districts with major highways, to address the increased injury risk during rainfall. This could include automated warning systems, variable speed limits, and enhanced road drainage infrastructure. Local authorities need to consider different strategies for each road user type, given their distinct risk patterns such as enhanced pedestrian infrastructure in high-risk areas, dedicated lanes for motorcyclists/tricyclists, and improved vehicle safety standards. Public health interventions that emphasise road safety education tailored to specific user groups and weather conditions are also needed. Additionally, urban planning and road infrastructure development could mitigate weather-related risk by incorporating climate resilience features, such as improved drainage systems, enhanced road surface materials with better wet-weather traction, adequate street lighting, and weather-responsive traffic management systems. These measures, combined with stronger enforcement of traffic regulations and regular monitoring of injury patterns, could significantly reduce the burden of road traffic injuries in the GKMA.
Conclusion
This study provides crucial insights into the relationship between climate factors and non-fatal road traffic injuries across different road user types in the Greater Kumasi Metropolitan Area from 2010-2021. The study demonstrated that that rainfall, rather than temperature, significantly influences injury risk across all road user categories, with each millimetre increase in rainfall associated with a 1.6-1.7 percent rise in injuries. The spatial analysis revealed dramatic increases in injury risk in the Kwadaso Municipal district, with up to 7.5-fold increases across all road user types over the study period, while the Kumasi Metropolitan area maintained consistently lower risk levels despite its urban density. These findings highlight the influence of rainfall in shaping injury risk patterns in urban African settings. The varying risk profiles across districts and road user types underscore the need for targeted, context-specific interventions to improve road safety in Ghana.
Acknowledgements
The authors acknowledge the Building and Road Research Institute (BRRI) and the Ghana Meteorological Agency (GMet) for providing the data used in this study.
Author contributions
J.S.I. conceived the study, conducted in study design, data collection, data analysis, results interpretation and drafted the manuscript. D.B. participated in study design, results interpretation and reviewed the manuscript. T.P.A. participated in study conception and reviewed the manuscript. A.M. participated in study conception and reviewed the manuscript. EOAA. participated in study conception and reviewed the manuscript. E.A. participated in study conception and reviewed the manuscript. E.K.N. participated in study design, results interpretation and reviewed the manuscript. All authors read and approved the final manuscript.
Funding
This research did not receive any specific grant from funding agencies in the public, commercial, or not-for-profit sectors
Human Research Ethics Review
Approval for the study was obtained from the Committee on Human Research, Publication, and Ethics of Kwame Nkrumah University of Science and Technology, reference CHRPE/AP/181/23 on 24 March 2023.
Data availability statement
The datasets analysed during the current study are available from the Building and Road Research Institute (BRRI) and Ghana Meteorological Agency upon reasonable request and with appropriate permissions.
Conflicts of interest
The authors declare that there are no conflicts of interest.
Use of AI Tools
The authors declare that generative AI tools were used to improve English expression during the manuscript preparation process. No AI tools were used in the design, conduct, analysis, or interpretation of this study.