

Introduction
Road transport is essential to economic and social activities but there are also a significant number of traffic crashes and fatalities worldwide. According to the World Health Organization (WHO), approximately 1.19 million people die annually in road crashes, with 92 percent of fatalities occurring in low- and middle-income countries (WHO, 2023). In Thailand, road crashes remain a critical issue that has yet to meet the targets set by the Global Plan Decade of Action for Road Safety (2021-2030) (WHO, 2021). The most recent data from the WHO lists the road traffic fatality rate in Thailand at 25.4 deaths per 100,000 population (WHO, 2025). While this is a reduction from the rate in 2020 (32.7 deaths) it is still significantly higher than the target of 18 deaths per 100,000 population. The current decade, the 2018-2027 Road Safety Action Plan, aims to reduce road crashes by at least 50 percent by 2030 (WHO, 2021), thereby decreasing fatalities and injuries (Road Safety Master Plan 2022-2027) (Department of Disaster Prevention and Mitigation, Ministry of Interior, Thailand, 2022).
In Thailand, the number of deaths and injuries from road crashes has shown a continuous decrease. Data collected from three primary databases, The Royal Thai Police, Ministry of Public Health, and Road Accident Victims Protection Company Limited, alongside the Injury Data Collaboration Centre of the Department of Disease Control Ministry of Public Health, indicate a downward trend in fatalities over seven years (2015-2021). In 2021, there were 16,957 deaths, representing a 4.9 percent decrease compared to 17,831 deaths in 2020 (Ministry of Transport, 2021). The eastern region of Thailand is economically significant but records a disproportionately high number of road fatalities. In 2018, the region accounted for 2,844 deaths, representing 14 percent of national fatalities, with the highest death rate of all regions (45.6 per 100,000 population) (Thailand Road Safety Network, 2019). Road traffic crashes in the Eastern region show an increasing trend, underscoring the importance of effective post-crash management to reduce fatality crashes.
The Royal Thai Police have adopted goals aligned with the National Strategy 2018-2037, focusing on reducing road crash fatalities and enhancing the efficiency of post-crash response management (Royal Thai Police, 2022). Post-response management involves a range of key stakeholders in addition to police including people involved in road crashes, local communities, hospitals and rescue agencies (Khorasani-Zavareh et al., 2009). Therefore, this study focused on identifying ways to improve stakeholder coordination, develop timely assistance systems for people involved in crashes and ultimately reduce injury severity and the likelihood of death. Through such improvements, the goal is to enhance long-term care and rehabilitation of affected people while also improving the overall effectiveness of post-crash response management, road safety, and sustainable development at both national and global levels.
In this study, we focus on the fifth pillar of the WHO approach to road safety. Post-crash response was highlighted at the 64th United Nations General Assembly with the adoption of the Moscow Declaration of Intent, which designated 2011-2020 as the Decade of Action for Road Safety. This framework identified five key areas: (1) building management capacity; (2) influencing road design and network management; (3) influencing vehicle safety design; (4) influence road user behaviour; and (5) improve post-crash care. The Second Global High-Level Conference on Road Safety, held in November 2015, resulted in the Brasilia Declaration, which outlined five pillars of road safety to guide global efforts in reducing road crashes. The Pillars of the Decade of Action for Road Safety (2011–2020) (WHO, 2010) were:
Pillar 1: Road safety management
Pillar 2: Safer roads and mobility
Pillar 3: Safer vehicles
Pillar 4: Safer road users
Pillar 5: Post-crash response
In November 2017, UN Member States committed to 12 global road safety performance targets, with a particular focus on reducing the time between road crashes and access to expert emergency care by 2030 (WHO, 2021). The Third Global Ministerial Conference on Road Safety subsequently established the Stockholm Declaration, which aims to halve global road crash deaths by 2030 and promote technological integration across all stages of road safety operations, from prevention to post-incident care.
Methods
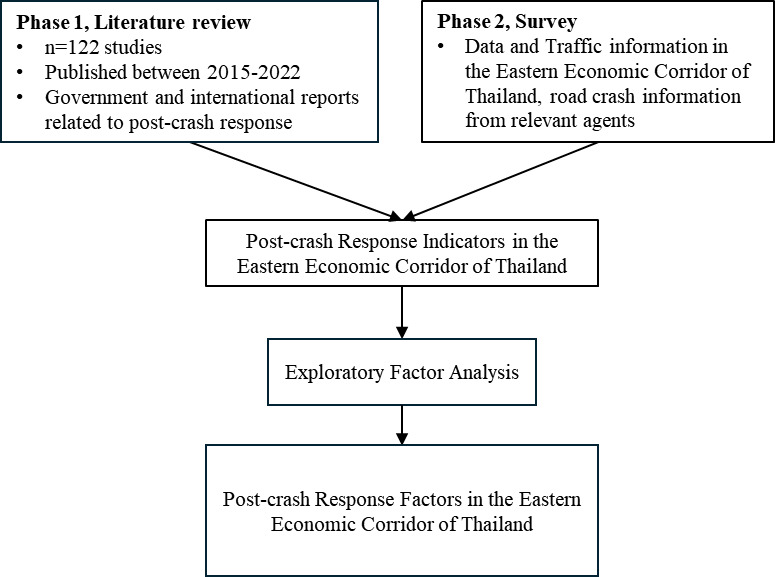
This was a mixed method study conducted in two phases: 1) a literature review and, 2) an online survey of professional involved in post-crash response.
Literature review
A comprehensive search was conducted across five databases, ScienceDirect, Emerald, ProQuest, ResearchGate, and ThaiJO (Thai Journals Online) in July 2023. The search was date limited to studies published between 2015 and 2022. Exclusion criteria were applied to studies that were not peer-reviewed or not directly related to road traffic crash operations, management, or post-crash response.
A total of 122 studies were identified using the following search terms: road traffic crash and model (n=39); road traffic crashes and management (n=26); road traffic crashes and simulation (n=21); road traffic crash and police (n=11); road traffic crash and network partners (n=11); road traffic crashes and operation and practice and process (n=9); after road traffic crashes (n=5).
In addition, secondary data sourced from government and international reports related to post-crash response management were also reviewed.
Survey
The second phase surveyed professionals directly involved in post-crash response operations within Thailand’s Eastern Economic Corridor (EEC).
Participant sample and recruitment
The target population (n=295) was identified through official professional directories and included professionals responsible for and directly involved in post-crash response management in the EEC. A probability sampling method was applied using simple random sampling. The minimum required sample size of 170 was calculated using Yamane’s formula (1973) at a 95 percent confidence level and 5 percent margin of error.
Invitations to participate in the survey were sent directly via email, along with a Google Form link including the study purpose, survey link, instructions for completion, and assurance of confidentiality. In total, 196 respondents participated in the survey, ensuring comprehensive representation of stakeholders.
Survey analysis
Survey responses were analysed using a combination of quantitative data analysis with exploratory factor analysis (EFA) to identify key factors and validate indicators. Data suitability for EFA was assessed using the Kaiser-Meyer-Olkin (KMO) test, with a threshold value >0.5 indicating adequate sampling adequacy (Kaiser, 1974). Bartlett’s test of sphericity confirmed significance (p < 0.001), validating the factorability of the correlation matrix (Bartlett, 1951). Factor loadings were evaluated against a minimum acceptable threshold of 0.4, as recommended by Hair et al. (2009), to ensure meaningful associations between variables and underlying factors.
These data sources were synthesised to develop indicators for constructing the post-crash response factors specific to the region. This phase utilised two primary data sources (Figure 1).
Results and Discussion
Following the literature search (n=122), secondary data from government and international reports related to post-crash response were also included. In this analysis, the focus was on the fifth pillar of the WHO’s approach to road safety, significance of post-crash response, and highlights the importance of timely and effective care following road crashes. In combination with the survey responses (n=196) from professionals responsible for post-crash response management in the EEC, this review critically assesses the current state of post-crash management in Thailand, identifying key deficiencies in emergency response systems, coordination mechanisms, and institutional preparedness.
In addition, the analysis explores theoretical frameworks, international and national policies, and empirical studies related to traffic and transport systems, post-crash intervention strategies, and integrated road crash management. As discussed below, these findings provide a foundation for identifying areas for improvement and inform the development of more effective post-crash response mechanisms.
Road crash management identified the in the research studies has been synthesised into four key groups: 1) introduction of preventive guidelines before the incident (40%), 2) management before the incident (26%) with the remaining publications addressing either policy and planning before the incident (17%) or plans and policies after the incident (17%) (Figure 2).
.png)
Table 1 provides a summary of the included publications and summarises the theoretical, practical approaches, and emerging in road crash management. This table serves as a key reference point for understanding the current state of knowledge and identifying gaps that inform subsequent research directions.
The indicators and factors identified for post-crash response management highlight the importance of improving management approaches to enhance the efficiency of post-crash response. Results are presented in two parts: 1) post-crash response indicators and 2) post-crash response factors within Thailand’s Eastern Economic Corridor.
Post-Crash Response Indicators
This study identified 25 indicators that describe the key aspects of post-crash response management. Table 2 summarises the reviewed literature concerning these post-crash response indicators.
The Post-Crash Response Factors
The exploration factor analysis applies to this research; all indicators of post-crash response were tested to identify the main factors of post-crash response management. In the Kaiser-Meyer-Olkin (KMO) test, the statistic is 0.96 with a p-value of 0.00 (Table 3) and the variance explained and cumulative percentage of factors (Table 4).
Twenty-five indicators were significantly correlated. The principal component method was used in the factor analysis to categorise the indicators. Two factors were identified: Post-crash Response Information (PRI), and Post-crash Response Injury Care and Legislation Support (PRILS). The classification system of PRI and PRILS factors was developed based on factors identified in a literature review, an online survey distributed via a Google Form link to professionals involved in post-crash response, and subsequent analysis, with the World Health Organization (WHO, 2016) framework serving only as a partial reference. A loading factor value with a cut-off of approximately 0.5 was accepted. This result indicated a medium correlation to consider the relationship between factor and indicator. All loading factor values of 0.5 indicated a medium correlation.
Post-crash Response Information: PRI
Post-crash Response Information Factors in this category refer to post-crash response research and information. These factors involve crash data (police, insurance, auto industry), accurate reporting, emergency communication, data integration, stakeholder coordination and prehospital care documentation (WHO, 2016). Our analysis identified 14 PRI factors.
Table 5 presents the factor loadings of indicators for the Post-Crash Response Information (PRI) factor, highlighting the critical importance of effective information management and inter-agency coordination in post-crash response. The five indicators with the highest loadings highlight the importance of logistical preparedness, particularly in high-risk areas such as industrial zones and tourist destinations (PRI11: 0.81; PRI14: 0.80), the imperative for data to be shared among and between police, hospitals, and rescue teams to substantially reduce emergency response times (PRI9: 0.80) and how technological integration and digital reporting tools for emergency personnel may substantially improve these processes (PRI13: 0.78; PRI7: 0.76). The implementation of GPS-enabled tracking and digital reporting tools for emergency personnel is expected to significantly improve these processes.
Collectively, these findings illustrate that advancing technology and coordinated information flow are pivotal to optimising the effectiveness of post-crash response systems. For example, PRI9 (0.80) highlights the crucial role of data coordination in effective post-crash response; PRI11 (0.81) emphasises the significant impact of response speed; and PRI14 (0.80) reflects how vehicle readiness influences response effectiveness. Other important indicators include PRI13 (0.78), which facilitates efficient dispatch of rescue units, and PRI7 (0.76), where detailed and systematic data recording aids in analysing crash causes and improving preventive measures. These indicators all have factor loadings above 0.7, indicating a strong influence on post-crash response capability. Additionally, indicators such as PRI10 (0.68), PRI8 (0.67), PRI3 (0.66), PRI6 (0.64), PRI4 (0.61), PRI5 (0.58), PRI1 (0.57), and PRI12 (0.52) are of moderate importance but still contribute to the key factors. Although PRI2 (0.46) has a relatively low factor loading, it remains a fundamental element influencing the overall system.
Post-crash Response Injury Care and Legislation Support: PRILS
Post-crash Response Injury Care and Legislation Support Factors refer to injury care support, legal measures, and legislation for Post-crash Response. These factors involve first response, prehospital injury care, crash investigation, legal protection, law enforcement measures, and police evidence reports (WHO, 2016). Our analysis identified 11 PRILS factors.
Table 6 presents the factor loadings of indicators for the Post-Crash Response Injury Care and Legislation Support (PRILS) factor. The five indicators with the highest loading reveal the key importance of effective post-crash systems, demonstrating that rapid emergency response is critical to saving lives (PRILS3: 0.83), emphasising the importance of efficient time and scene management (PRILS6: 0.81) and effective traffic control at the crash site to prevent secondary incidents (PRILS4: 0.79; PRILS5: 0.78). In addition, the importance of coordination between insurance, police, hospitals, and legal agencies for complete support of people involved in the crash, facilitating both follow-up care and broader crash investigations (PRIL10: 0.78).
These findings indicate that strengthening emergency services, legal frameworks and inter-agency coordination are fundamental to enhancing the effectiveness of post-crash response. PRILS3 (0.83) holds the highest factor loading within this group, indicating that the promptness in transporting injured individuals to medical facilities is essential, as rapid response can reduce the likelihood of serious injury and improve overall injury outcomes. PRILS6 (0.81) shows that swift incident site management helps minimise crash impact. Other key indicators consist of PRILS4 (0.79), PRILS10 (0.78), PRILS5 (0.78), PRILS11 (0.76), PRILS9 (0.75), PRILS2 (0.74), PRILS7 (0.73), and PRILS8 (0.71). All these have factor loadings above 0.7, signifying that prompt injury care management increases operational efficiency and is critical within the PRILS group. Meanwhile, PRILS1 (0.62), despite having a lower factor loading, remains essential, as officers equipped with first aid knowledge can effectively save injured lives.
These results suggest that indicators with high factor loadings (> 0.8), such as PRI9, PRI11, PRI14, PRILS3, and PRILS6, are the most significant indicators within their respective groups and should be prioritised for development as the core framework for post-crash response management. Indicators with factor loadings between 0.7 and 0.8 are of secondary importance, while those between 0.5 and 0.7 hold moderate significance but still influence key factors. These should be improved and further developed to enhance measures or technologies that increase efficiency.
Conclusions
The findings of this study synthesises knowledge for preventing fatalities and severe injuries resulting from road crashes. This research identified twenty-five key indicators grouped into two main factors, which serve as guidelines for managing appropriate post-crash responses in Thailand’s Eastern Economic Corridor (EEC). The implementation of these indicators supports effective post-crash management, enabling the development of action plans that reduce injuries and fatalities while standardising post-crash procedures. The proposed post-crash response framework presents a structured approach to improving emergency response efficiency, law enforcement, and stakeholder coordination in Thailand, as well as low- and middle-income countries (LMICs) facing similar infrastructural challenges.
The study recommends establishing a centralised information-sharing centre to facilitate data exchange among emergency responders, hospitals, and law enforcement agencies. Additionally, training programs for emergency personnel should be enhanced to improve pre-hospital injury care, supported by appropriate legislative frameworks. These measures align Thailand’s post-crash response strategies with WHO guidelines.
Future research is needed to investigate the gaps between identified factors and current practices within the EEC’s post-crash response framework. Moreover, exploring the adoption of up-to-date technology for emergency response and conducting comparative studies in other high-crash regions would further advance knowledge in this field. Overall, the findings of this research support global efforts to reduce road crash fatalities and severe injuries by providing a comprehensive framework for post-crash response management.
Acknowledgements
The author thanks the police officers involved in post-crash response who kindly participated in the survey. Special thanks are also extended to the academic advisors, Asst. Prof. Thitima Wonginta and Assoc. Prof. Thanyaphat Muangpan, for their valuable guidance and support throughout this study.
AI tools
AI tools (ChatGPT (GPT-5, OpenAI)) were used for: English expression and clarity, to assist with idea generation and data coding and analysis.
Author contributions
TM designed the study, managed the data collection, performed the data collection and analysis, and collaborated in writing the manuscript. TW and TM created the main idea of the study and cooperated in writing the text of the manuscript. All authors have read and agreed to the published version of the manuscript.
Funding
This research does not receive any specific grants from public, commercial, or non-profit funding agencies
Human Research Ethics Review
All participants provided informed consent prior to joining the study. They are workers involved in post-traffic crash response operations. The study protocol was approved by the Ethics Committee of Burapha University (IRB4-160/2024).
Data Availability Statement
The data used in this study are de-identified, open source, and publicly available.
Conflicts of interest
The authors declare no conflicts of interest with respect to the research, authorship, and/or publication of this article.