


Introduction
The Global Status Report on Road Safety 2023 by the World Health Organization (WHO) reported that there were over 1.19 million fatalities result from crashes on the roads each year. This equates to a mortality rate of 15 per 100,000 people, making crashes on the roads the leading cause of death among individuals aged 5 to 29 years (Shube et al., 2024; Towers, 2024; WHO, 2023a). In Thailand, a country with a population of 71.6 million and 42.3 million registered vehicles, road traffic crashes are a significant issue. WHO estimates that these crashes annually cost the Thai economy over 500 billion baht (AUD$23.7m) (WHO, 2023b). While the estimated road traffic death rate in Thailand 2021 is 18,218 deaths (25 per 100,000 population), this marks an improvement from 2018, when the fatality rate was higher (35 per 100,000 population; n= 24,728 deaths) (WHO, 2023b).
The United Nations identified five key areas for improving road safety: management, safe roads and mobility, safer vehicles, safer road users, and effective post-crash response. In alignment with these priorities, Thailand’s stakeholders are actively working to achieve the goals set in the Road Safety Master Plan 2022-2027. The plan aims to reduce road traffic deaths by more than half to 8,474 (12 per 100,000 population) and serious injuries to 106,376 cases (151 per 100,000 population) (Pitupong et al., 2024). However, despite efforts to improve road safety measures in Thailand, the rate of crashes continues to persist, especially in urban areas. While the overall road traffic death rate per 100,000 population has declined from 2018 (35) to 2021 (25), urban areas remain disproportionately vulnerable due to diverse activities on the road and high population density, which create complex traffic conditions and elevate crash risk (Cabrera-Arnau et al., 2020; Iamtrakul & Chayphong, 2025; Raicu et al., 2016; Tippayanate et al., 2024).
Spatial analysis is a technique used to study and enhance road safety in urban areas by utilising Geographic Information Systems (GIS) in conjunction with spatial modelling. This approach assists in identifying high-risk crash locations and assessing the impact of urban road physical characteristics on road safety (Alsahfi, 2024; EslamiNezhad & Delavar, 2019; Iamtrakul & Chayphong, 2025). The structure of the road system plays a crucial and influential role in mobility of people (Fernandes et al., 2021), analysing the structure of the road network alongside human mobility in urban areas can integrate GIS with the Space Syntax model. This model has a key role in studying or designing road networks, public transportation systems, land use, and urban spatial patterns to understand the spatial form of the city system and traffic network. It enables a systematic understanding of the structural connectivity of spaces and behaviour of people within those areas. Moreover, it can be used to predict areas of high traffic density or heavy usage through quantitative analysis (Fernandes et al., 2021; Kongphunphin et al., 2025; Pan et al., 2020).
The Space Syntax model is used to analyse and explain relationships between spatial configurations and social contexts in this study. This model highlights the significance of spatial systems, such as settlements, communities, and buildings, and examines how human-made physical elements influence behaviour. By considering how societal factors shape the use of spaces, the model is particularly valuable for understanding travel patterns, which are often dictated by the constraints of the surrounding environment. By studying road networks, Space Syntax identifies spatial attractors and their influence on social logic, offering insights into the natural responses of drivers navigating through these networks.
Previous research has demonstrated the versatility of Space Syntax in studying various types of travel behaviour. Soltani and colleagues (2022) focused on local roads in Shiraz, Iran, to investigate pedestrian commutes to schools and reported that walking patterns are influenced by factors such as walking distance, age, and the origin-destination framework. Fernandes et al. (2021) examined the municipal urban network in Rolândia, Brazil, and applied the model with a focus on bicycle-related crashes. Including distance and origin-destination points helped in developing predictive models for cycling-related crashes. Rood (2024) studied urban and rural roads in the province of Groningen, Netherlands, to analyse risky driving behaviours and inform urban planning. Similarly, van Nes (2021) analysed inner ring roads in cities such as Birmingham, Coventry, Bristol, Tampere, and Mannheim to identify strategies for reducing crashes between vehicles and pedestrians. In Stockholm, Sweden, Attig (2019) studied urban roads to identify “hot and cold spots” for crimes and traffic crashes, while Lee et al. (2014) examined road crashes near ports in South Korea, including incidents related to the Sewol ferry disaster.
By quantifying spatial potential and integration, Space Syntax enables researchers to assess the connectivity and functionality of transportation networks. These numerical metrics form the basis for evaluating road systems and designing safer, more efficient transport infrastructures. Its application in road safety studies supports predictive models and policies aimed at reducing crash risks and improving traffic management which is why the researchers utilised this model for this study conducted in Khon Kaen, Thailand.
Study setting
The province of Khon Kaen is a central hub for the northeastern region of Thailand and the Greater Mekong Subregion. Khon Kaen has a population of 1.8 million people and approximately 920,000 vehicles. The province offers significant resources and services in education, healthcare, commerce, economy, investment, and transportation. It is a key logistics centre that supports Thailand’s integration into the ASEAN Economic Community (AEC). In terms of transportation, Khon Kaen is being developed as a regional aviation hub. Khon Kaen International Airport currently accommodates up to 32 flights daily. The province is also experiencing advancements in land transportation, including high-speed rail and dual-track railway projects. These developments position Khon Kaen as a critical station connecting Thailand with China and Laos. Additionally, efforts are underway to establish Khon Kaen as a central distribution hub for goods within the Greater Mekong Subregion (Keeratikasikorn, 2018; Muenratch et al., 2022; Steinberg & Hakim, 2016; Supatn, 2011). As a large province and a central hub, Khon Kaen has experienced rapid urban development. This growth has led to increased traffic and a higher number of vehicles, contributing to a rise in road crashes within the city (Tankasem et al., 2019; Tippayanate et al., 2024).
District-Level Road Crash Analysis in Khon Kaen
Currently, Khon Kaen Province has one of the highest mortality rates from road crashes in Thailand. For the first half of 2025 (1 January to 30 June), when disaggregated across all 26 districts, Mueang Khon Kaen (downtown) District ranks first in terms of injuries and fatalities with more than double the next two Districts combined (Table 1) (Thai RSC, 2025).
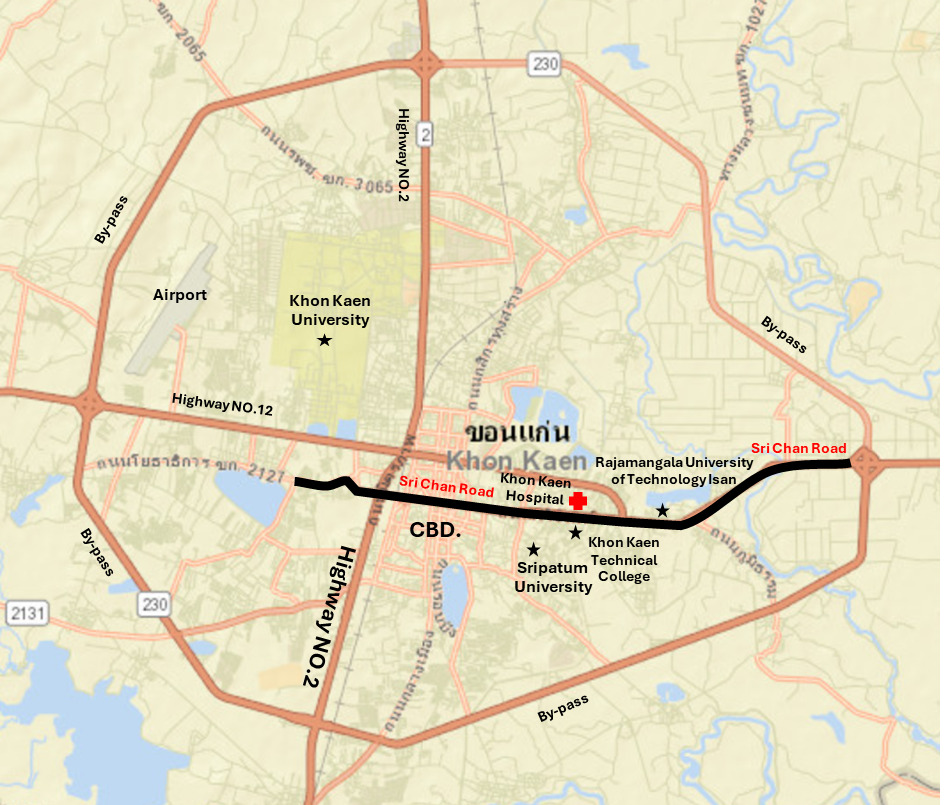
Given the high number of fatal and serious crashes, this study focused on Khon Kaen City, specifically, Sri Chan Road, the collector road with the highest number of recorded traffic crashes (see Figure 1). The 4.7 kilometre road is surrounded by numerous key locations including three educational institutions (Sripatum University Khon Kaen Campus; Rajamangala University of Technology Isan Khon Kaen Campus; Khon Kaen Technical College), three healthcare facilities (Khon Kaen Hospital; Khon Kaen Radiation and Chemotherapy Center; Khon Kaen Health Promotion Center), two shopping centres (Central Khon Kaen; Kaen Building), the city pillar shrine, Khon Kaen Provincial Prison, and various government offices.

Table 2 presents data from the Khon Kaen Hospital Accident and Emergency Crisis Center (2023) and shows that Mueang Khon Kaen District had the highest number of road crashes. Key contributing factors include violations of traffic regulations and speeding. Efforts to improve driver behaviour through law enforcement remain insufficient, largely due to a lack of personnel and inadequate use of tools or equipment to facilitate more effective enforcement (Kumphong, 2016; Kumphong et al., 2019; Srihabua, 2016; Tankasem et al., 2018, 2019) (Table 2).
These data underscore the need for greater road safety action including enforcement measures, more effective use of enforcement tools, and greater resource allocation to reduce road crashes in high-risk districts. Recognising the seriousness of the issue, this study focused on identifying road crashes through spatial analysis and proposing traffic engineering solutions to prevent crashes, with particular emphasis on designing safer urban roads and leveraging data-driven insights to enhance overall road safety.
Objective of the research project
To enhance Active Mobility for improved road safety, with a specific focus on collector roads, using spatial analysis techniques.
Method
Study Area
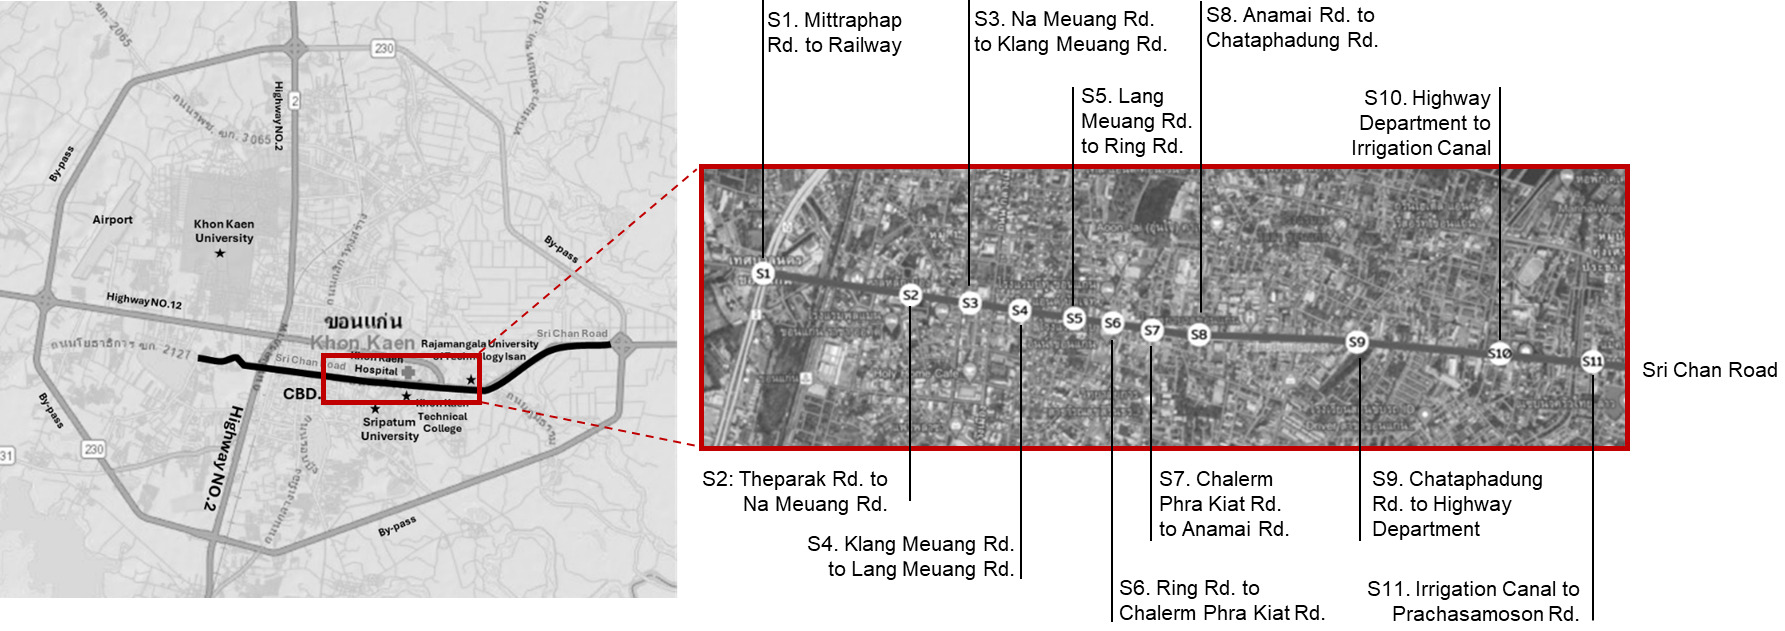
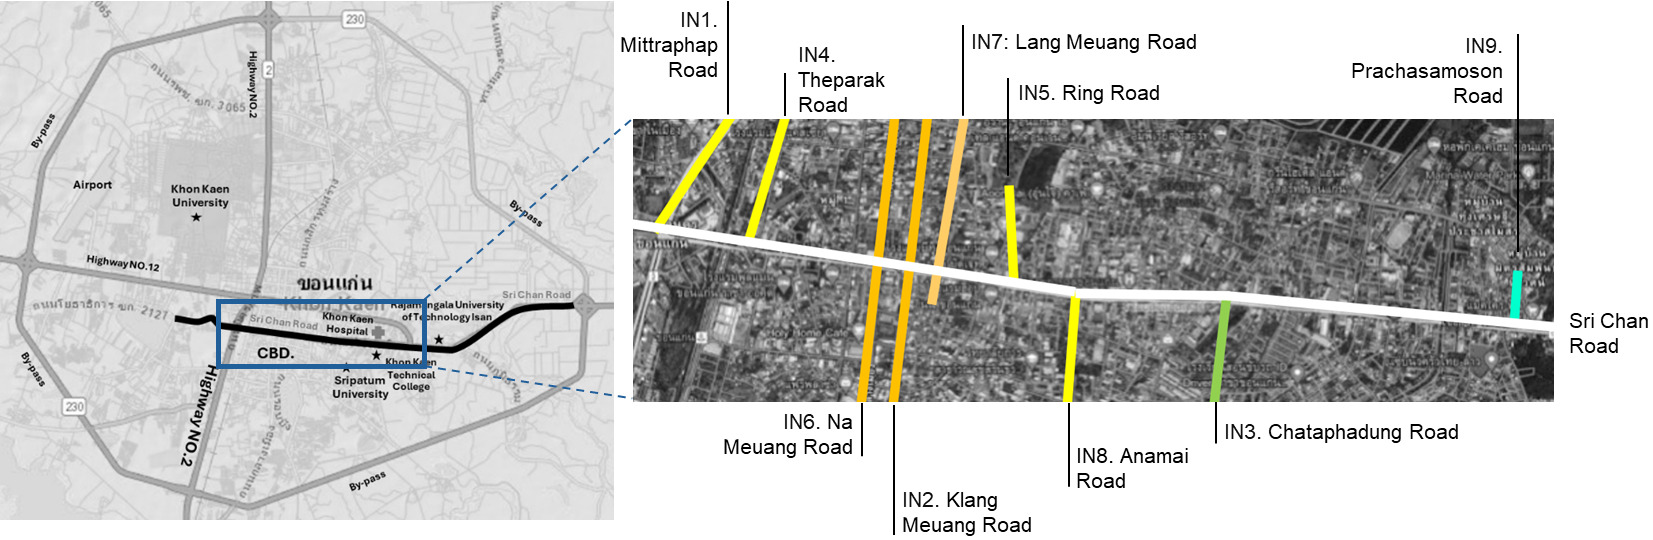
The study was conducted at locations along Sri Chan Road, a collector road within Khon Kaen City that records the highest number of traffic crashes (Tippayanate et al., 2024). There were 20 study locations along the 4.7 km road and included 11 road segments (Figure 2) and 9 intersections (Figure 3). Crash data, including injuries and fatalities (Kumphong & Buntornwon, 2021), were collected from Khon Kaen Hospital for the years 2020 to 2022. The analysis included all traffic crashes that occurred along road segments and intersections within the study area.
Speed Survey
A total of 20 speed surveys were conducted at road segments and intersections using a radar gun. The surveys were performed during non-peak traffic times (2:00 to 3:30pm). Speed data were collected at all 20 study locations using random sampling (Kumphong et al., 2019) and vehicles were categorised as motorcycles or private vehicles. Because motorcycles and passenger cars account for the vast majority of road crashes and related casualties in Khon Kaen, the speed surveys focused only on these two vehicle types. Other vehicle categories such as trucks, buses, and bicycles represent a much smaller share of crashes in the study area and were therefore not included.
Data analysis
Data analysis included descriptive statistics, mean, frequency, and the 85th percentile. The Space Syntax model was analysed using the open-source computer software, DepthMapX software version 0.8.0 developed at University College London, considering the values of Integration (HH) and Connectivity. Integration values and Connectivity values are interrelated. The values of integration (HH) were measured to consider the degree of accessibility of a road with other roads, taking into account the total number of directional changes of the urban entity, and the value of connectivity was measured to describe the number of connections of each road to other streets. The higher the connection value is the better the spatial permeability of the axis (Fernandes et al., 2021; Tutuko et al., 2022).
.png)
*.png)
The road network in this study area was obtained via manual mapping including highway, collector roads, and local roads. The map was exported to DXF file, then DepthmapX was imported to convert them into an axis model.
The DepthMapX software calculates the connectivity values of each roads and determines Integration (HH) by normalising the average visual depth at point “V” in the plan using “d-value”, whereas “k” is the number of axes or nodes in the system. Integration (HH) is expressed as (1),(2) (Kim & Thai, 2024; Tutuko et al., 2022).
dValue= 2{k.[log2(k+23)−1]+1}(k−1)(k−2)
Integration(HH)v= dValue.(k−2)2(MeanVisualDepthv−1)
While Pearson correlation and simple regression models were applied to identify relationships, statistical testing was conducted at a 95 percent confidence level to ensure robust results (Del Águila & Benítez-Parejo, 2011; Kumphong et al., 2019; Raford & Ragland, 2004; Sedgwick, 2012; Tian et al., 2023) as shown in Figure 4 and Figure 5.

Results
Speed Data Analysis
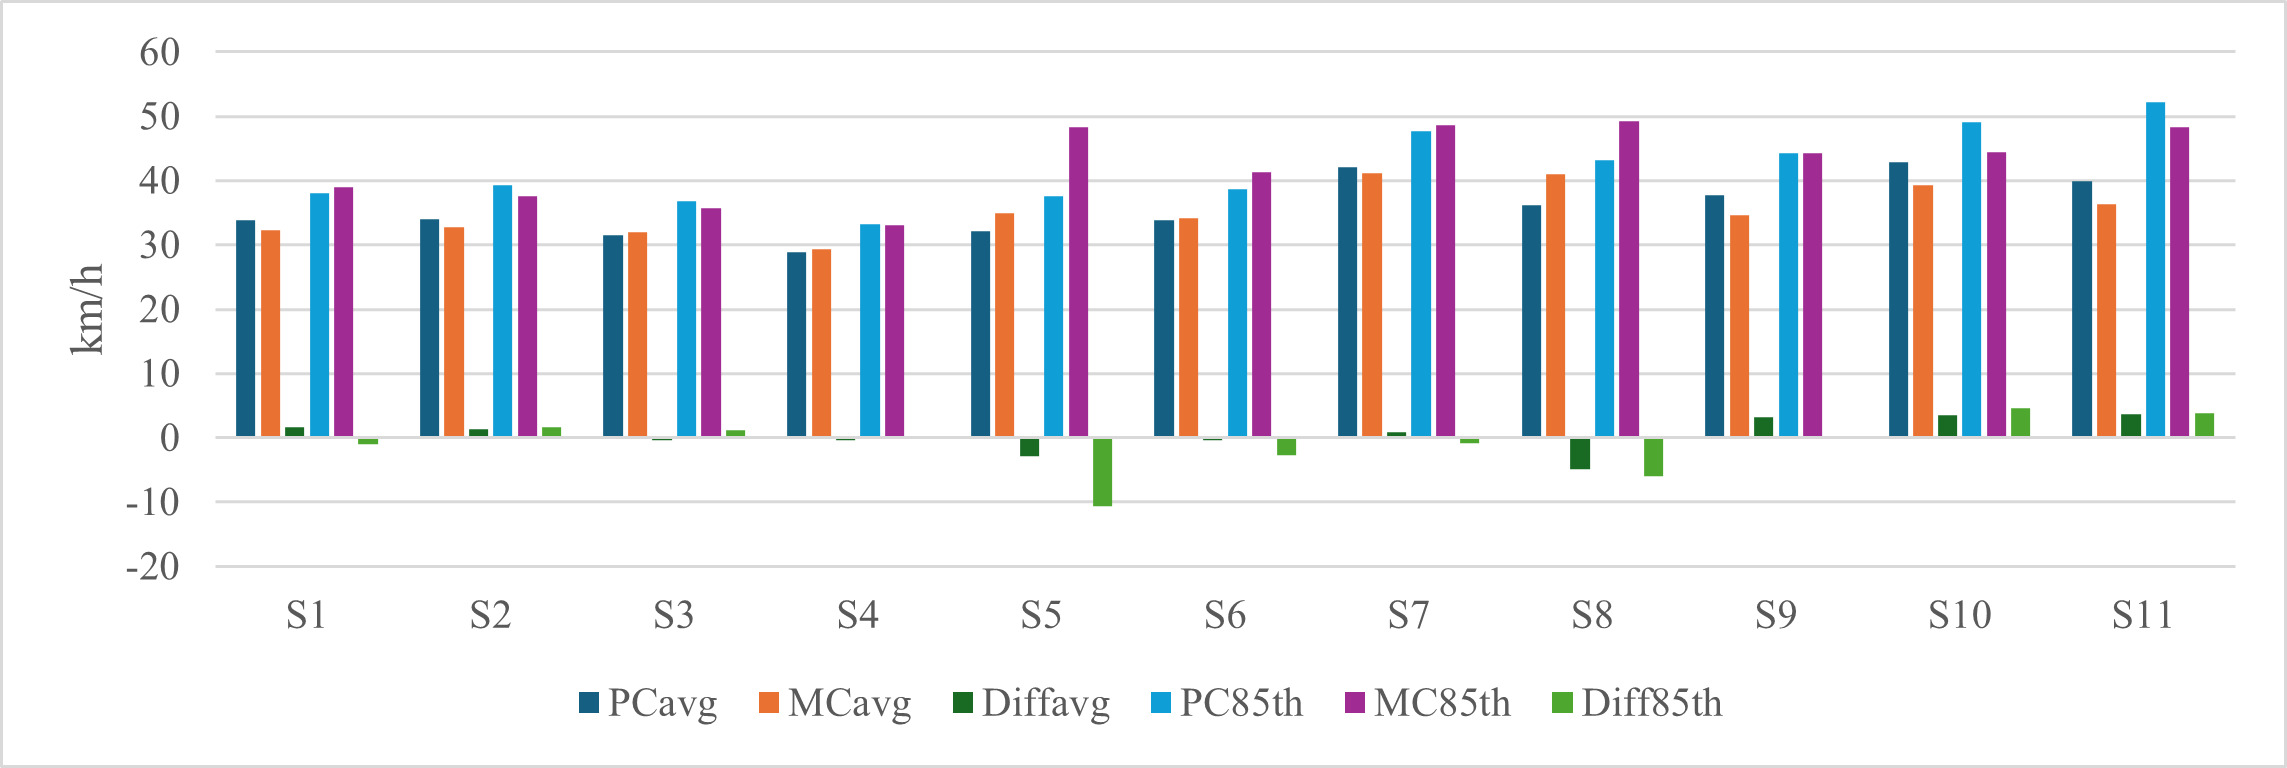
The posted speed limit on Sri Chan Road is 45 kilometres per hour. Figure 6 shows the vehicle speeds at the 11 road segments (S1-S11). The 85th percentile speed for private cars averaged 41.8 km/h (SD = 5.9), while motorcycles averaged 42.7 km/h (SD = 5.7). The average difference in the 85th percentile speed between vehicle types was -0.9 km/h (SD = 4.4). The overall average speed for private cars was 35.7 km/h (SD = 4.5), and for motorcycles, it was 35.2 km/h (SD = 3.9). The average speed difference between vehicle types was 0.5 km/h (SD = 2.7).

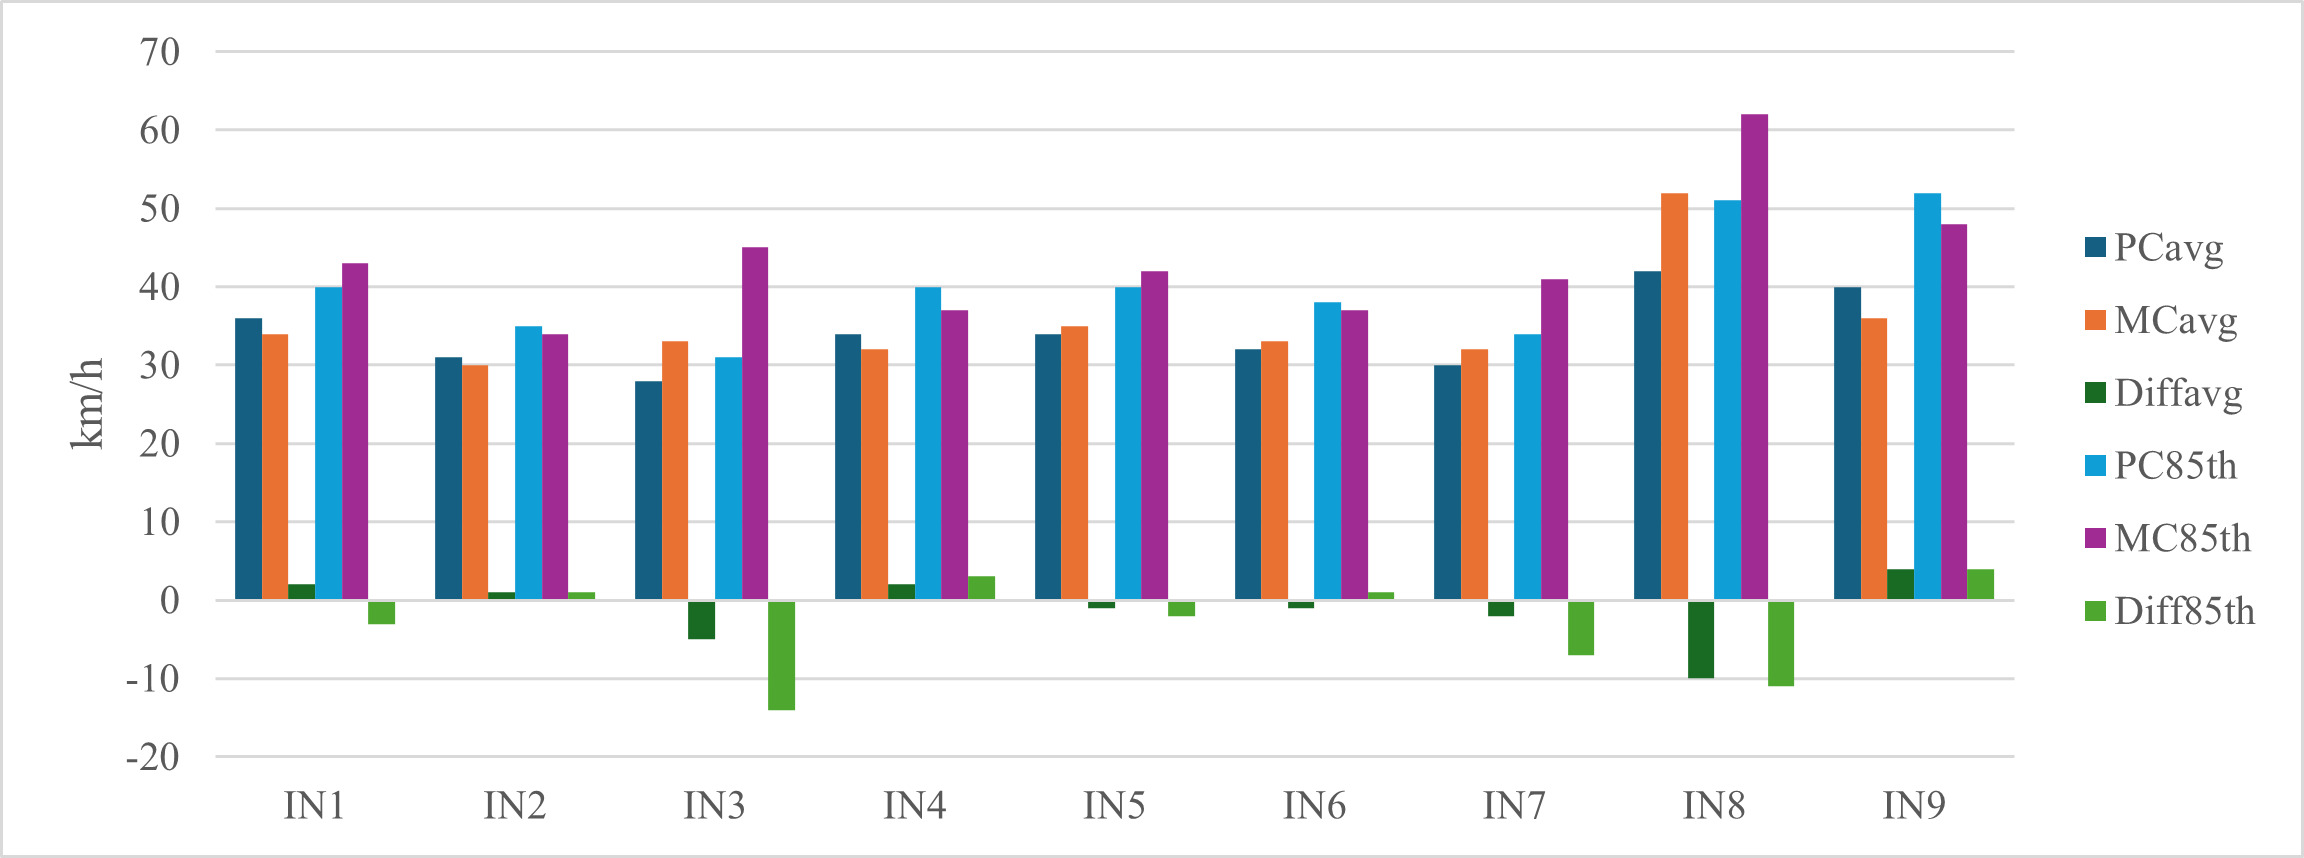
Figure 7 shows the speeds for vehicles approaching the 9 intersections (IN1–IN9). The 85th percentile speed for private cars averaged 40.1 km/h (SD = 7.2), while motorcycles averaged 43.2 km/h (SD = 8.3). The average difference in the 85th percentile speed between vehicle types was -3.1 km/h (SD = 6.3). The average speed for private cars at intersections was 34.1 km/h (SD = 4.6), and for motorcycles, it was 35.2 km/h (SD = 6.5). The average speed difference between vehicle types was -1.1 km/h (SD = 4.3).
Space Syntax analysis
The results of Integration (HH) and Connectivity Values were generated using DepthMapX software version 0.8.0. From the analysis of the network of roads connected to Sri Chan Road. Lines show the highest integration (HH) values of roads (red) and lowest integration values of roads (blue) (Figure 8). The values of this district were generated by the software from highest (51.00) to lowest (1.00) values of connectivity.
Road segments
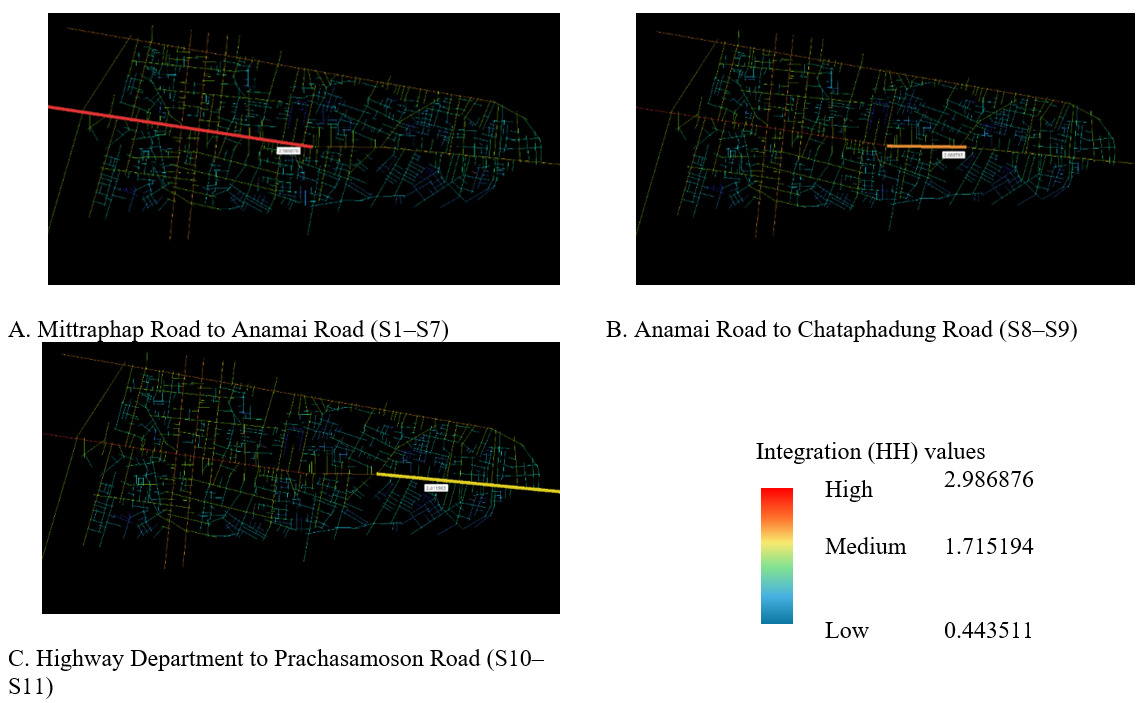
The analysis of the road network data focused on Sri Chan Road, specifically the section from Mittraphap Road to Prachasamoson Road across 11 segments. Road segments were categorised into three levels of spatial integration and connectivity. Within the study area of Sri Chan Road, at two points (S8, S10), the road changes direction for vehicle movement, this results in Srichan Road having three different Integration (HH) values.
The section of Sri Chan Road from Mittraphap Road to Anamai Road (S1-S7) plays an important role in network connectivity and facilitating traffic flow. However, it showed the highest level of spatial integration (2.986876) and the greatest connectivity potential (51.00) which indicates that this section has the highest chance of having the most vehicles and the highest chance of crash risk on this road.
The section of Sri Chan Road from Anamai Road to the Department of Highways (S8-S9) shows a relatively high level of spatial integration (2.688785) and has the lowest connectivity potential (17.00), indicating less connectivity within this section of the network. However, despite the least connectivity, this section of road still has a relatively high chance of vehicle concentration, indicating a relatively high risk of crashes.
The section of Sri Chan Road from the Highway Department to Prachasamoson Road (S10-S11) displayed moderate-high spatial integration (2.411963) and moderate connectivity (33.00), suggesting a balance between its embedding within the network and its functionality as a connecting route. The values indicate that this road section has lower vehicle density and crash probability than S1-S7 and S8-S9 road sections (Table 3).
Intersections
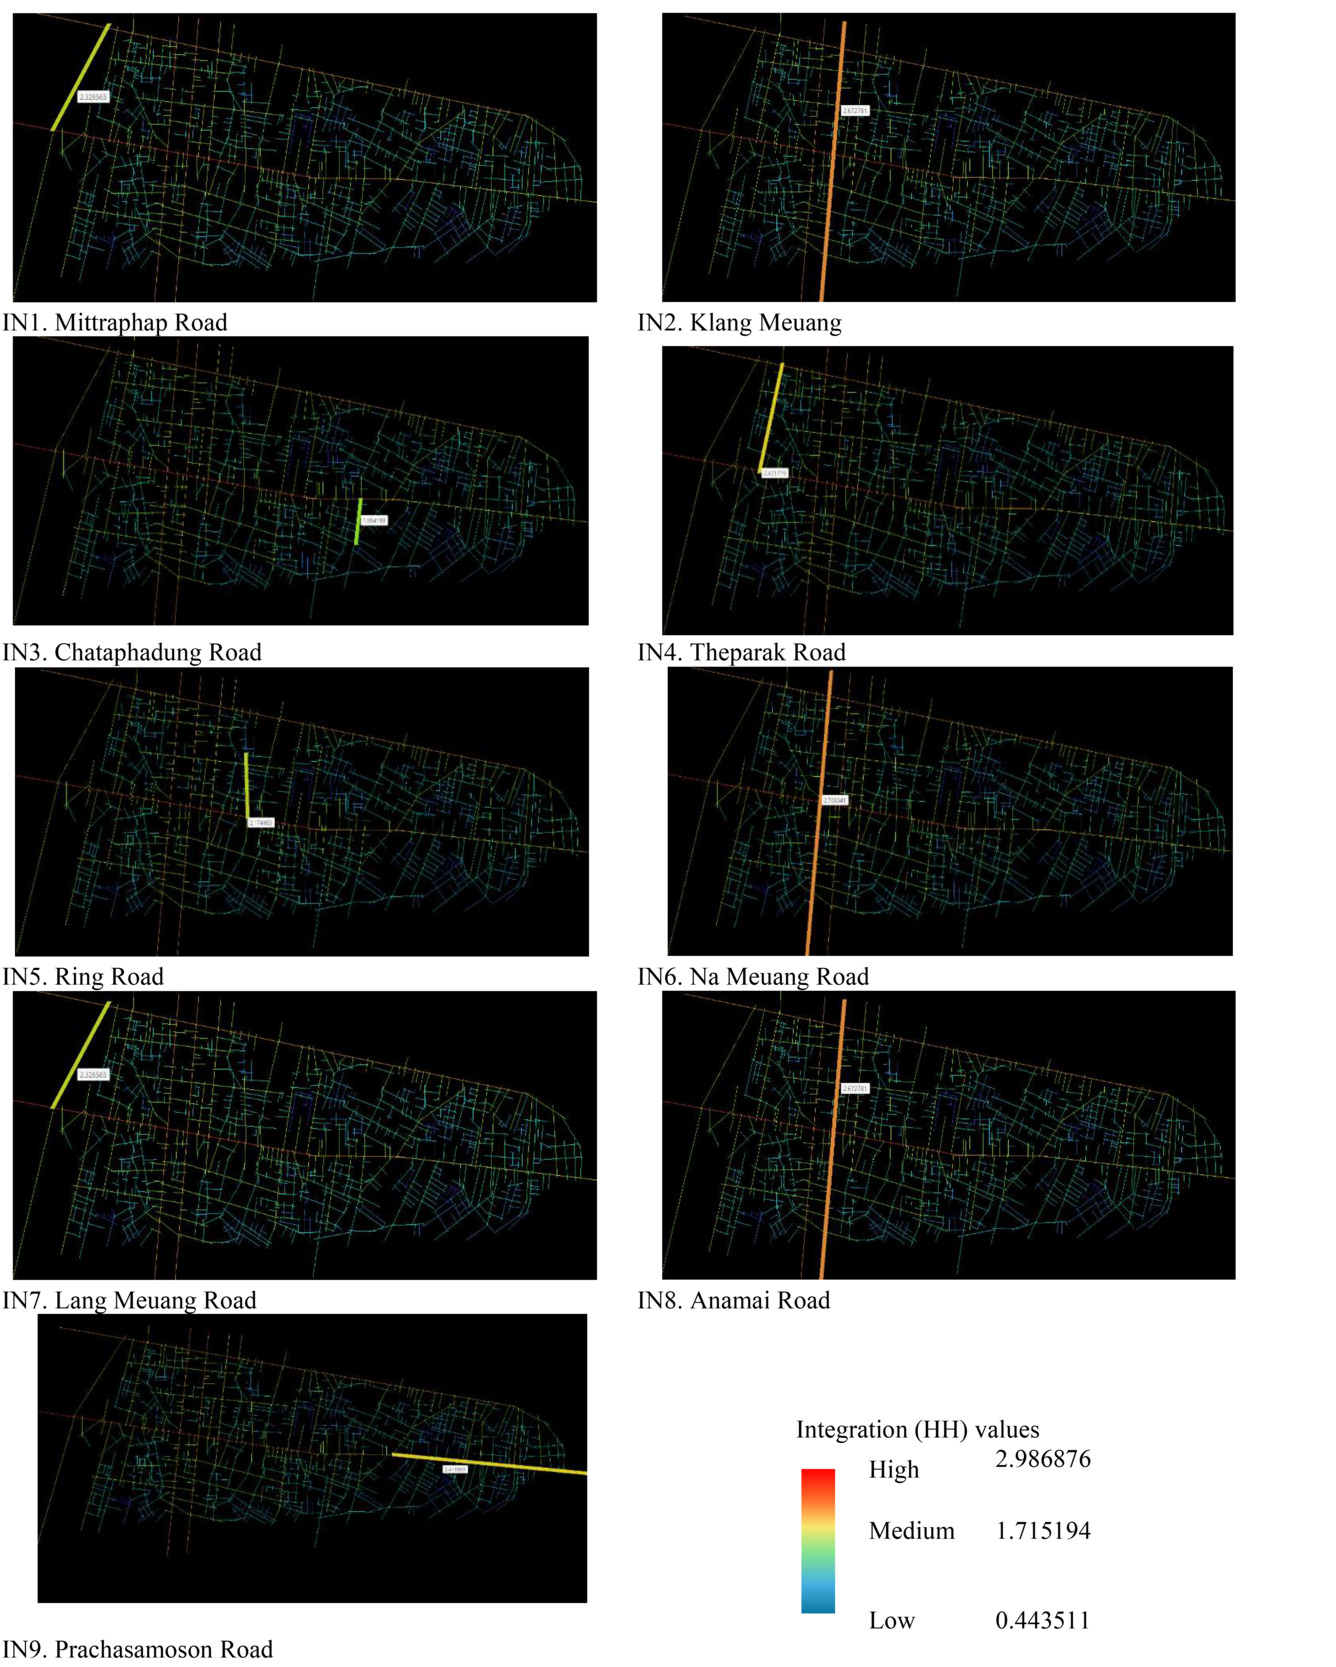
Results for the analysis of the road network at intersections along Sri Chan Road revealed varying levels of spatial integration across these intersections. The Na Meuang Road intersection (IN6) demonstrated the highest spatial integration and connectivity potential along Sri Chan Road. The Klang Meuang Road intersection (IN2) showed a moderate level of integration, while the Prachasamoson Road intersection (IN9) had the lowest spatial integration, indicating limited connectivity in this area.
Figure 7 presents the spatial integration (Integration (HH)) values for roads connecting to Sri Chan Road at intersections IN1–IN9. The values indicate varying levels of spatial embedding, with Na Meuang Road (IN6) showing the highest integration, while Prachasamoson Road (IN9) displays the lowest. Results in Table 4 highlight disparities in connectivity across the network.
.png)
Relationship analysis between speed, road crashes and spatial integration (HH)
Analysis of road segment data showed that there was no statistically significant association between spatial integration values Integration (HH) and vehicle speed. However, spatial integration values were significantly correlated with the number of injuries. A simple regression model was used for this analysis, yielding an R Square value of 0.37, an Adjusted R Square value of 0.30, F = 5.296, and p < 0.05.
In contrast, for intersection data, there was no statistically significant correlation between spatial integration values and vehicle speed or road crash data. These findings highlight the differential impact of spatial integration on speed and crash outcomes, suggesting its relevance in understanding injury risks but not as a predictor of vehicle speed or crash frequency at intersections (Table 5).
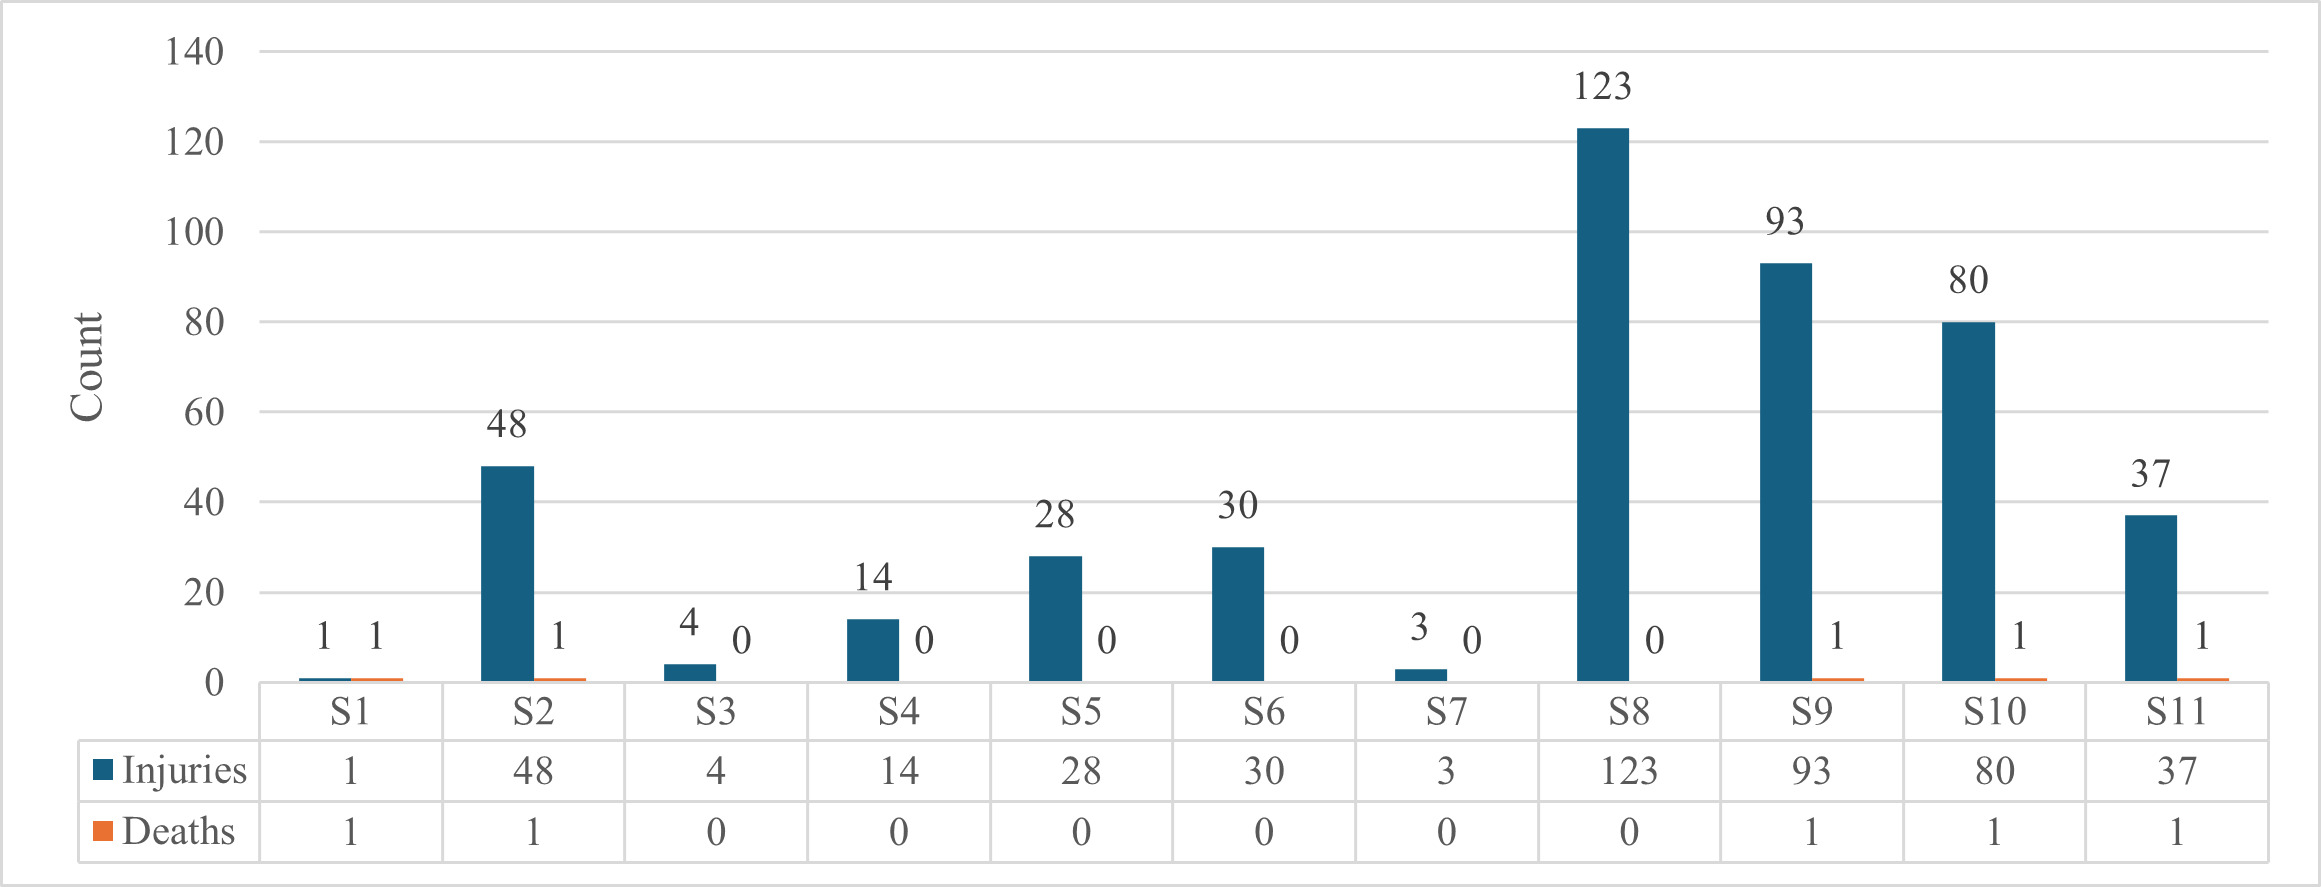
In summary, across the 20 locations (11 segments; 9 intersections), the average number of injuries was 42 per road segment and 42 per intersection in the study area during the study period. This indicates that both road segments and intersections along Sri Chan Road consistently experience a high number of crash-related injuries. Regression results further revealed that spatial integration values were significantly correlated with the number of injuries (p < 0.05), but there were no statistically significant associations between integration values and vehicle speed or crash frequency at intersections. These results suggest that the spatial configuration of the road network influences injury outcomes more strongly than speed levels alone, highlighting the role of road design and connectivity in shaping crash risk. The regression analysis of road segment data showed that only the Value of Integration (HH) was statistically significant in predicting the number of injuries. The model explained 37 percent of the variance in injuries (R² = 0.37, Adjusted R² = 0.30, F = 5.296, p < 0.05). The negative coefficient indicates that as the integration value increased (reflecting less spatial depth), the number of injuries decreased. In contrast, no statistically significant associations were observed between integration values and vehicle speed, nor for the intersection data.
Discussion
This study identified an average of 42 injuries on road segments and intersections along Sri Chan Road, demonstrating the concentration of crash-related harm in this urban corridor. Although the posted limit was 45 km/h, observed speeds at both road segments and intersections averaged above the 30 km/h threshold associated with greater crash severity. These results align with previous research demonstrating that even modest increases in speed can substantially heighten the risk of severe or fatal outcomes (Hossain & Zaman, 2021; Johnsson & Laureshyn, 2024; Se et al., 2022; Zenu et al., 2023).
The Space Syntax model analysis identified that the study locations with the highest spatial integration values were road segments S1-S7 and intersection IN6. These areas are critical for urban traffic connectivity, providing major links within the city’s road network. This link between high spatial integration and connectivity, aligns with previous studies that used Space Syntax to analyse urban road networks (Fernandes et al., 2021; Hegazi et al., 2022; Li et al., 2023). The technique is an effective way to illustrate the morphological structure of urban areas by analysing transportation networks, showing the spatial embedding of key routes in the Sri Chan Road area of Khon Kaen. Space Syntax analysis also highlights that as spatial integration increases, the depth of a route decreases. This correlation suggests that routes with lower depth tend to have higher injury rates. Roads with low depth values are more likely to accommodate higher vehicle speeds, increasing crash risks. This observation is consistent with previous research (Iranmanesh et al., 2024; Xing & Guo, 2022).
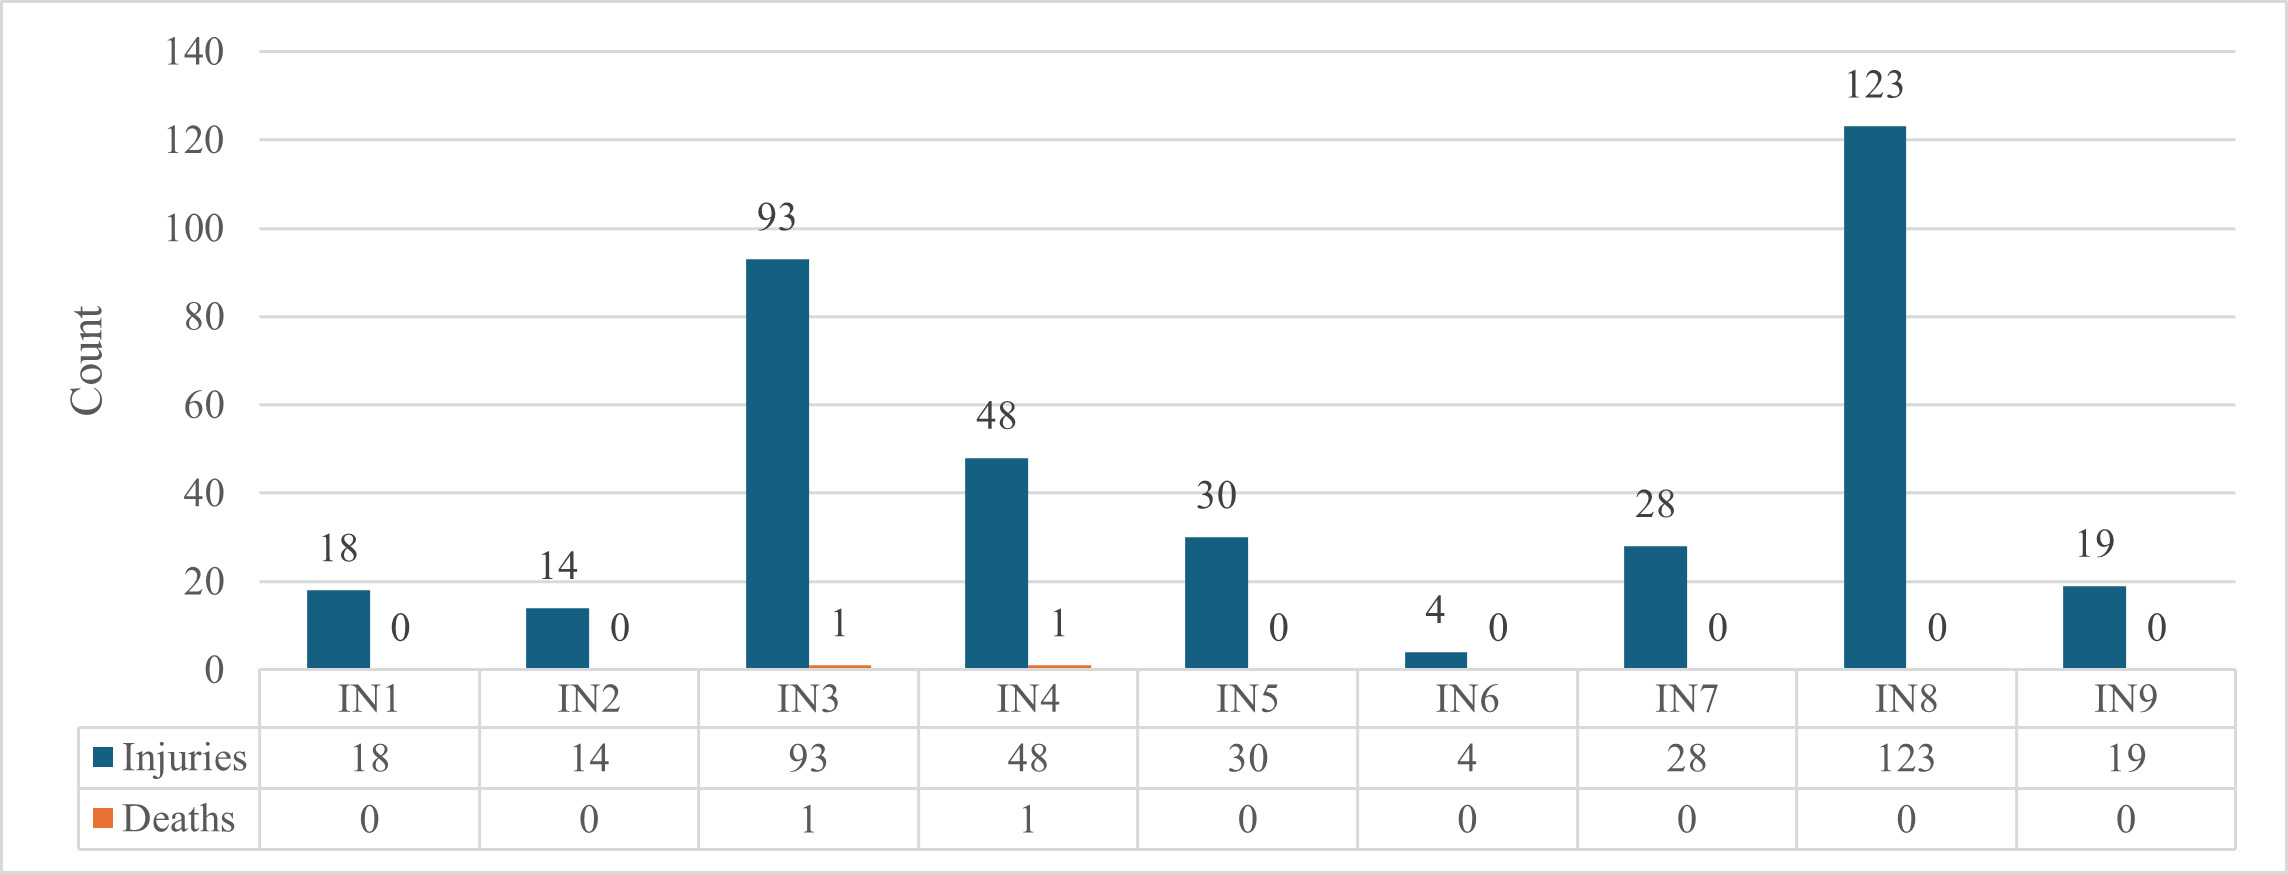
The relationship between spatial integration and road crash data was statistically significant. The analysis of crash hotspots on Sri Chan Road in the Khon Kaen municipality revealed that the highest injury rates occurred at segment S8 (Anamai Road to Chataphadung Road) and intersection IN8 (Sri Chan Road and Anamai Road). These findings align with earlier studies identifying high-risk locations, including the intersection near the Khon Kaen Provincial Health Office on the Sri Chan community side, the market area near Khon Kaen Hospital, the U-turn near Centosa Mall on Sri Chan Road, the U-turn near the Provincial Irrigation Office, and the Nong Yai Market area (Kumphong & Buntornwon, 2021).
Our analysis indicated that the model still accounts for a substantial proportion of unexplained variance (63%) in predicting injuries or fatalities resulting from road crashes. This finding aligns with the complexity of real-world scenarios, where multiple factors, including vehicle characteristics, human behaviour, road conditions, and environmental variables, interact to influence crash outcomes. Within our model, only the “Value of Integration” factor emerged as statistically significant, explaining 37 percent of the variance. This outcome is consistent with earlier research; for instance, studies examining helmet law enforcement and motorcycle fatalities in ASEAN countries have similarly reported a large unexplained variance (74%) in their predictive models (Kumphong et al., 2018).
Study strengths and limitations
With 20 locations along Sri Chan Road, this study presents a comprehensive analysis of the major collector road in Khon Kaen Province. This route is both an essential thoroughfare through this important northeastern Thailand hub and a central route for local movement and connection. The high number of fatal and serious injury crashes makes understanding this specific road of critical importance. The large number of study locations, across both road segment and intersections, means that this study provides data beyond a simple blackspot analysis and contributes new insights into this critical infrastructure. Further, the insights gained from the Space Syntax analysis in the context of Thailand, is likely to be applicable to other low- and middle-income countries, particularly in the ASEAN Economic Community region.
However, there were also limitations. This study focused exclusively on urban roadways and this limited the scope of the analysis. Future studies should expand locations to include additional road segments, especially those with higher frequencies of crashes. For example, intersections should be analysed regarding traffic signalisation, safe intersection designs, timing and phases of traffic lights, and the nature of traffic signal phases. Further, we encountered constraints due to the absence of strategic urban planning data for upcoming developments, which confined our analysis to the existing road network conditions without incorporating future city planning considerations. Researchers in subsequent studies should actively integrate future urban development plans to better anticipate and proactively manage road crash risks.
Conclusion
This study analysed vehicle speeds and the physical urban network of Sri Chan Road, a collector road in Mueang District, Khon Kaen Province. The findings revealed that the average speed of private cars and motorcycles exceeded 30 km/h on road segments and at intersections. Additionally, the average number of injuries was 42 per road segment and 42 per intersection in the study area. The Space Syntax model and a simple regression model demonstrated a statistically significant relationship between spatial integration values and the number of injuries on road segments.
This study highlights the utility of integrating morphological structure analysis with travel behaviour to identify factors contributing to road crashes. The findings provide valuable insights for developing effective policies aimed at reducing road crash injuries and fatalities. The results can serve as a guideline for identifying high-risk road segments and intersections, potentially caused by deficiencies in the transportation network’s planning and design. In the future, these findings could inform improvements to urban transportation networks, including enhanced road embedding and automated urban management technologies, to create safer and more efficient traffic systems. This study underscores the importance of data-driven planning and the application of innovative methodologies in addressing road safety challenges.
The results of this study will be proposed as policy recommendations to relevant agencies in order to support future improvements to the urban system of Khon Kaen. We recommend that stakeholders need to implement policies targeting infrastructure improvements, such as introducing electric vehicle (EV) public bus transportation systems, enhancing road safety through physical road modifications like roundabouts, and deploying smart cameras for continuous 24-hour traffic surveillance.
Acknowledgements
This article is dedicated to Mr. Vutidach Kumphong who was killed in a motorcycle crash.
AI tools
AI tools (Grammarly) were used to support English expression and clarity. No AI tools were used for idea generation, data coding or analysis, or for any other purpose in this study.
Author contributions
Conceptualisation, PT, JK, NC; methodology, PT, JK, NC; formal analysis, JK, ND; data collection, JK, SJ, ND; writing-original draft preparation, PT, JK; writing-review and editing, PT, JK; design and visualisation, NC, JK. All authors have read and agreed to the published version of the manuscript
Funding
This research project was financially supported by Mahasarakham University.
Ethics approval
This research article is part of the project titled “A study of the correlation between road characteristics and environment factors for geometric design road and safety.” HEC-02-66-005). Date of Exemption: 26 October 2023.
Data availability statement
The data that support the findings of this study are available from the corresponding author upon reasonable request. Crash and injury data were obtained from Khon Kaen Hospital Accident and Emergency Crisis Center and cannot be publicly shared due to privacy and institutional restrictions.
Conflicts of interest
The authors declare no conflicts of interest with respect to the research, authorship, and/or publication of this article.