Introduction
The fatalities and serious injuries from road traffic crashes are among the most preventable mortalities globally. Yet the World Health Organization (WHO) estimates that globally, crashes on the roads result in over 3,200 deaths daily (WHO, 2023a) and 20-50 million seriously injured people annually (WHO, 2023b). Low and middle-income countries contribute over 90 percent of these road crash fatalities and injuries (WHO, 2023b). Traffic safety research indicates that driver behaviour is a major contributing factor in crashes including speeding, using a mobile phone while driving, tailgating (following another vehicle too closely), sudden lane change etc. (Timmermans et al., 2020). Speeding is considered among leading contributors to traffic crashes globally, contributing to over half of the global fatalities from road crashes (Fondzenyuy et al., 2024). Additionally, tailgating was found to contribute to 23-33 percent of crashes (TDI, 2018; Xu et al., 2021) while driver impairments (i.e., mobile phone use, drug and alcohol misuse and other distractions) contributed to 13-50 percent of crashes (Chand & Bhasi, 2019; Liang & Yang, 2021). In this research, the Emirate of Abu Dhabi is considered as a case study to investigate drivers’ behaviours as crash contributing factors.
The Emirate of Abu Dhabi is one of the seven emirates of the United Arab Emirates. Abu Dhabi emirate has a car-centric mobility pattern among its residents comparable to other metropolitans in Australia, Europe and North America (Hasan et al., 2018), and similar problems exist in other cities of the country. Preliminary estimates found that reckless driving caused over 21.5 percent, tailgating 8.7 percent and driver impairment caused 2.3 percent of severe road crashes (De Albuquerque & Awadalla, 2020). In the driver behavioural paradigm of aberrant and risky driving, skills and style are two distinct components where the former is an indicator of experience while the latter is causally-related to perception (Matar & Al-Mutairi, 2021). Global studies exhibit a consistent reduction in crash rates as drivers age, but this reduction is primarily attributed to decreased risk-taking behaviour, such as reduced speeding, rather than an improvement in driving skills. Young drivers were found to be associated with a higher risk of speeding (Scott-Parker et al., 2013), distraction due to mobile phone use and impairment (Fernandes et al., 2010), and tailgating (Al Reesi et al., 2018). Personality traits such as aggression, anxiety and self-assessment are embedded in the driving style which become more established with experience (Bener et al., 2008). This indicates a strong case for a direct correlation between perceived risk and aberrant driving, indicating that experience does not necessarily equal safe driving. It is rare in a crash that any one element is more important that the others and a cumulative effect of underlying attitude (Jin et al., 2021), sociodemographic (Tarlochan et al., 2022), cultural, and risk acceptability (AlKetbi et al., 2020), are factors in how driver behaviours contribute to a crash.
Self-reported assessment tools such as perception surveys, Driver Attitude Questionnaire (DAQ), various driving scales and inventory scales, and Driver Behaviour Questionnaire (DBQ) are the common tools employed by researchers to understand driving style. The DBQ, based on theoretical taxonomic groups of violations and errors dividing aberrant driving behaviour, is arguably the most widely employed measurement instrument (Reason et al., 1990). Violations are referred to as “deliberate deviations” from safe operation practices further classified into aggressive and ordinary, whereas errors capture unwitting deviation (slips and lapses) or departure of planned action (mistakes), thereby having some differences between the structural (two- to four-factor or higher) configurations of the DBQ between its various iterations in literature (Matar & Al-Mutairi, 2021). Previous research has exhibited that internal factors (e.g., gender, age, experience, etc.) and external factors (e.g., culture and traffic norms) affect the tendency of drivers committing the different types of violations and errors (Bener et al., 2008). In addition, traffic safety is internationally arrayed, correlated to population diversity, road design, driving and traffic enforcement culture which needs to be acknowledged in understanding driving behaviours, factors contributing to aberrant driving and recommending corrective measures (Timmermans et al., 2020).
Further, driver attitudes are behavioural beliefs that affect intentions and perception. Positive attitudes have been shown to inhibit violations in a largely homogenous driving culture in China (Jin et al., 2021). In Abu Dhabi, AlKetbi et al. (2020) used a DBQ to investigate the socio-demographic factors associated with driver behaviour and determined that driver experience influences the perception of risky driving behaviour. Similar results were reported among drivers in Qatar (Bener et al., 2008) and Kuwait (Matar & Al-Mutairi, 2021). However, these studies were significantly limited in scope as they targeted only local drivers and excluded expatriates who form the largest proportion of driver population. Traffic interactions between local and expatriate groups are likely to significantly affect the results. On the other hand, Rahman et al. (2022) postulated that an inappropriate attitude is a strong indicator of aberrant driving when analysing driver behaviour in the Middle Eastern context. For these reasons, it is important to consider sub-cultural formations among driver groups based on their beliefs, cultural norms and attitudes as this complicates both the on-road driving environment and the research analysis paradigm.
To address this, this study used the Theory of Planned Behaviour (TPB) as the overarching reference framework to investigate the predictors of driver behaviour from the discussed driving skill and style factors. This study analysed the traffic safety culture in Abu Dhabi using a dedicated DBQ constructed through rigorous consultations with the local traffic safety experts and decision-makers. The modified DBQ with an attitude and socio-demographic construct was conducted with the multi-cultural population in Abu Dhabi and predict the variable interdependencies. The correlations among different factors are analysed by Bayesian Belief Network (BBN) approach based on causal probability. With its capacity to explain complex relationships and handle uncertainty, BBN can model the correlations among road safety variables more effectively. One advantage of employing Bayesian networks is that fewer assumptions are required about the interrelations among variables. Bayesian networks are ideally suited for predicting the likelihood that contributing factors are the causes of an event that has occurred (Peng et al., 2021).
To the best of the authors’ knowledge, the theoretical basis of the TPB with BBN analysis approach has not been previously adopted in the context of Abu Dhabi. It is asserted that drivers’ driving behaviour (tendency to commit violations) is influenced by their attitudes and socio-demographics. For empirical modelling, Bayesian (probabilistic) belief networks were utilised. Understanding the role of attitudes in shaping driver behaviour is valuable as it enables the design of targeted interventions addressing psychological and social factors influencing risky driving. Effective measures could include stricter enforcement, behavioural incentives, and advanced driver-assistance technologies to mitigate risk. Thus, this study emphasises the importance of integrating attitudinal insights into road safety interventions.
Methodology
Participant recruitment
Participants were recruited over a period of four days (27-30 December 2022) at six major shopping malls, namely, Abu Dhabi, Yas, Al Wahda, Al Ain, Al Dhafra and Marina. These malls were chosen as they are considered as the most popular retail centres and top-rated shopping malls in the cities of Abu Dhabi and Al Ain within the Emirate of Abu Dhabi. resulting in a total of 1,792 participants. The number of responses collected from each location are provided in Table 1.
Data collection
The objective of this study was to analyse the impact of socio-demographic factors and driver attitudes on driving behaviour within a culturally diverse environment where various attitudes and belief groups interact. Driving behaviour is analysed based on triple-factor DBQ constructs of violations, errors and lapses committed by the drivers. To perform this, participants completed the attitude-embedded DBQ using a Computer-Assisted Personal Interview (CAPI) survey. Driver responses about six violations, four errors, and three lapses were investigated, specifically filtered according to the situation of the Emirate of Abu Dhabi, on a Likert-type scale. Participants rated their behaviours using discrete labels as response categories (Never, Hardly Ever, Occasionally, Often, Frequently, Almost Always). These labels provided a nuanced and intuitive approach to capturing variations in driving behaviour. All responses were combined into a single excel file for enhancing the predictive capabilities of the analysis model. The developed attitude-embedded DBQ was used to conduct Computer-Assisted Personal Interviews (CAPI) surveys across six major shopping malls.
Factors considered in the study
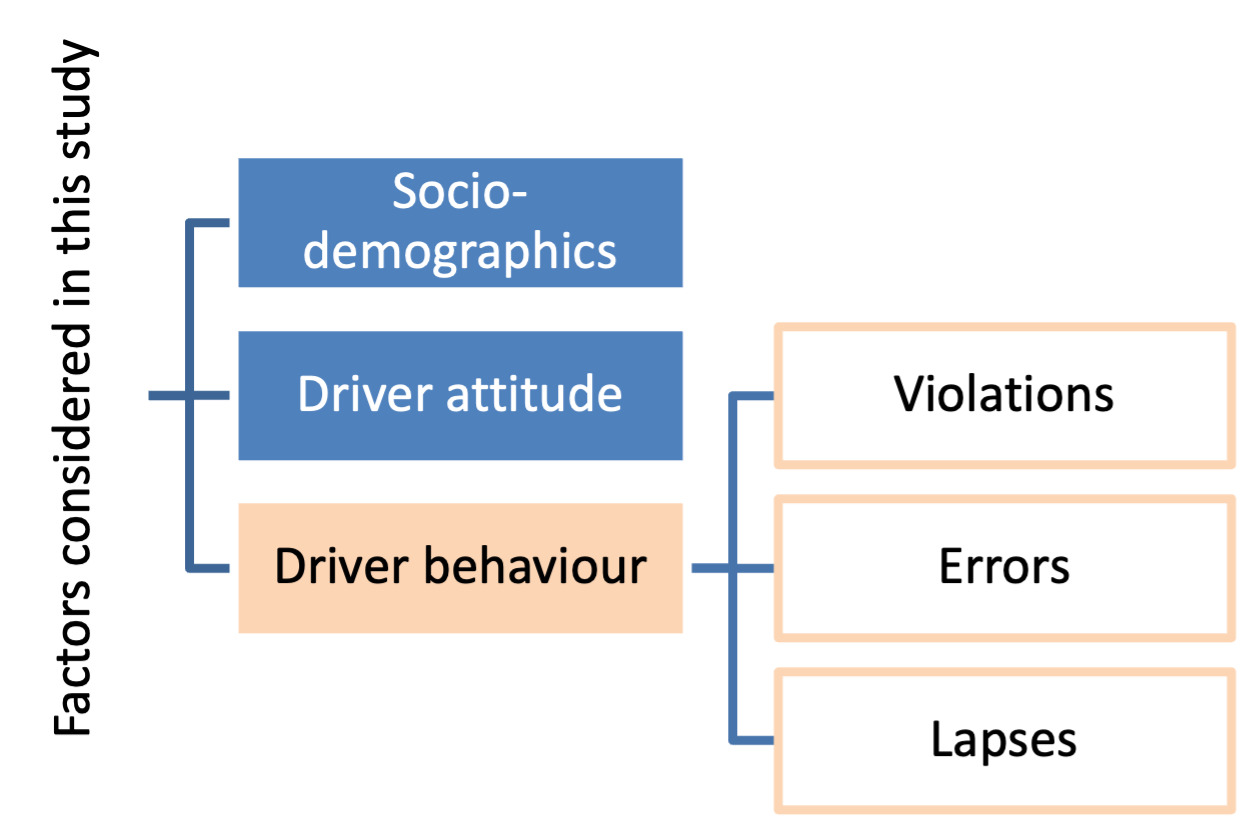
To understand the multifaceted dynamics of driving behaviours, a comprehensive examination encompassing socio-demographics, driver attitudes, and driving behaviour was undertaken. This study delved into these interconnected factors to elucidate their influence on road safety and driver conduct. The factors analysed in this study are given in Figure 1.

Socio-demographics
Socio-demographic characteristics are the foundation of understanding driving behaviour, and their impact is closely explored in road safety research. Variables including age, gender, nationality, years driving in the United Arab Emirates (UAE), driving frequency, and education level are taken into consideration. By studying these factors, deeper insights into their interactions with driver attitudes and behaviours will be identified, allowing for more informed policy interventions and the broader discussion of road safety.
Driver attitudes
Driver attitudes relate to a range of driving activities. This research examined the complex relationship between attitudes and driving behaviour, resulting in a better knowledge of road safety dynamics. The key attitudes included in this study were:
-
It is OK to use the mobile whilst driving as long as you drive carefully.
-
It is normal to sometimes use mobile phone while driving because I see many people around me doing it.
-
It is acceptable to drive closer to the vehicle in front as long as you are careful.
-
It is OK to drive faster than the speed limit as long as you drive carefully.
-
It is OK to change lanes suddenly as long as you drive within your own capabilities.
-
Being involved in a crash is a fate and cannot be avoided.
Driving behaviour
Driving behaviour can shed light on various aspects of driver conduct on the road. Driving behaviour can be categorised into violations, errors, and lapses. Through comprehensive analyses, a deeper understanding of the complexities of driving behaviour and its implications for road safety will be gained. The data collected related to violations, errors and lapses are listed below:
Violations
-
Send text messages/WhatsApp/short messages when driving.
-
Call or make voice chats when driving.
-
Become impatient with a slow driver and overtake.
-
Drive especially close or “flash” the car in front as a signal for the driver in front to go faster or move over.
-
Drive over the sign posted speed limits on an expressway.
-
Drive over the sign posted speed limit on a residential road.
Errors
-
Miss seeing traffic signs like “speed signs”, “give way” or “stop” signs.
-
Find yourself unsure of the posted speed limit of the road.
-
Drive without wearing your seat belt.
-
Fail to check your mirrors before pulling out, changing lanes, merging, etc.
Lapses
-
When driving on a road with pedestrian crossing, fail to notice that pedestrians are crossing the road.
-
Check your speedometer, you find that you have been speeding unconsciously.
-
While waiting at a traffic signal, fail to notice that the traffic lights have turned green.
Analysis methodology
Bayesian Belief Network (BBN) was used in this study to analyse the driver behaviour data. It was preferred over the frequentist approach primarily to avoid biased inferences and interpretations. Unlike the frequentist approach, Bayesian methods explore the interrelationships existing among the variables in the domain by considering the sample data and also prior knowledge (and expert opinions) to obtain posteriori knowledge. This will aid in decreasing the potential bias from the sample data (Lee et al., 2023). The fundamental distinction between Bayesian statistics and traditional statistics is the type of unknown parameter that is estimated. The unknown parameter is regarded as fixed and unknown in traditional statistics. However, the Bayesian approach acknowledges that the unknown parameter may contain uncertainty that can be represented as a probability distribution and the result is a distribution of probability for the unknown value rather than a single result. It is assumed that each parameter has a distribution that captures the degree of uncertainty surrounding its value (Van De Schoot & Depaoli, 2014).
The analysis methodology is based on the principles of Bayesian statistics and machine learning algorithms. BBN structures are developed by applying several machine-learning algorithms on the collected DBQ response data to generate probabilistic inferences between driver behaviours, socio-demographics, and attitude. BBN are directed acyclic graphs having nodes and arrows representing the variables and the relations among them respectively. While frequentist approach considers that uncertainty arises due to randomness, Bayesian statistics models uncertainty by causal and probabilistic relationships (Wagenmakers et al., 2008).
In machine-learning (ML), two major data analysis techniques are supervised learning and unsupervised learning. Supervised approaches produce estimates using a known target/output. Unsupervised techniques, often known as exploratory data analysis methods, automatically organise a dataset without relying on prior categorisation or pre-imposed limits. In this study, the objective is to explore the influence of socio-demographics and attitudes of drivers (as input variables) on their behaviour (violations, errors, and lapses). Hence, a supervised learning approach was adopted to analyse what attitudes and socio-demographics affect each category of driver behaviour. Different supervised algorithms are applied to the dataset and Bayesian models are generated corresponding to each algorithm. Minimum Description Length (MDL) scores are calculated and compared among models to choose the optimum BBN model representative of the collected DBQ dataset.
Following this, the impact of each variable on target node was estimated. Mutual information is a measure of average information gain by considering the entropy of the variables involved. The mutual information (I) among a predictor variable (Y) and a target variable (X) is obtained as in Equation (1). H(X) is the marginal entropy of the target variable and H(X│Y) is the conditional entropy of the target variable given the predictor variable. Computing the mutual information among the target variables and several possible predictor variables will identify which variable provides the highest information gain for the target variable.
I(X,Y)=H(X)−H(X│Y)
While the dataset comprised 1,792 responses, its relatively small size posed potential challenges for model generalisability and the risk of overfitting. To address this, we employed cross-validation techniques during model training and used regularisation methods to ensure robust predictions and minimise overfitting. However, future studies should aim to incorporate larger and more diverse datasets for improved reliability.
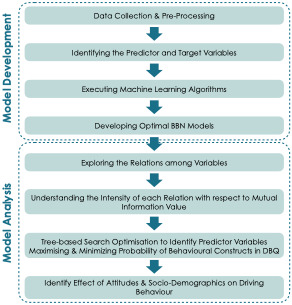
Figure 2 presents the framework of the analysis used in this study and the steps involved in the development and analysis of the BBN model. The model development initiates with data collection and data preparing methods. Once the data is prepared for analysis, the predictor and target variables are identified, and the ML algorithms are applied on the dataset accordingly to develop optimal BBN models. The data analysis procedure starts by exploring the interrelationship obtained from the model represented by ‘arrows’ in the BBN structure. The mutual information of each relation helps to identify the significance of each relation in the network structure. Scenario analysis is crucial for decision-makers as it will assist in understanding the impact of predictor attitude and socio-demographic factors on the behavioural variables under different situations.

Further, characteristics of respondents that are likely to be associated with a specific driving behaviour can be identified by performing optimisation procedures. This is particularly important when prioritising preventative measures to positively affect driver behaviour under time and budgetary constraints. Bayesian analysis was performed to analyse the impact of different factors on the occurrence of various violations, errors, and lapses, which were the target variables in each model. The target variables responses were noted as discrete labels: Never, Hardly Ever, Occasionally, Often, Frequently and Almost always. To optimise the size of the probability distribution table, similar responses were aggregated to generate three categories of responses for the target variables as shown in Table 2.
Results and Discussion
In this analysis, the influence of socio-demographics and driver attitude on driving behaviour are explored. Variables related to socio-demographics and driver attitude were the input variables (12 input variables), while variables concerning driving behaviour were the target variables (13 target variables). Each target variable was examined individually to provide a comprehensive understanding. Thus, 13 Bayesian structures were developed to understand the relationship among the considered factors. These results are organised across three distinct sections:
-
Understanding the intensity of each relation with respect to mutual information value
-
Tree-based search optimisation to identify predictor variables maximising and minimising probability of behavioural constructs in DBQ
-
Identify the effects of attitudes and socio-demographics on driving behaviour
Mutual information value
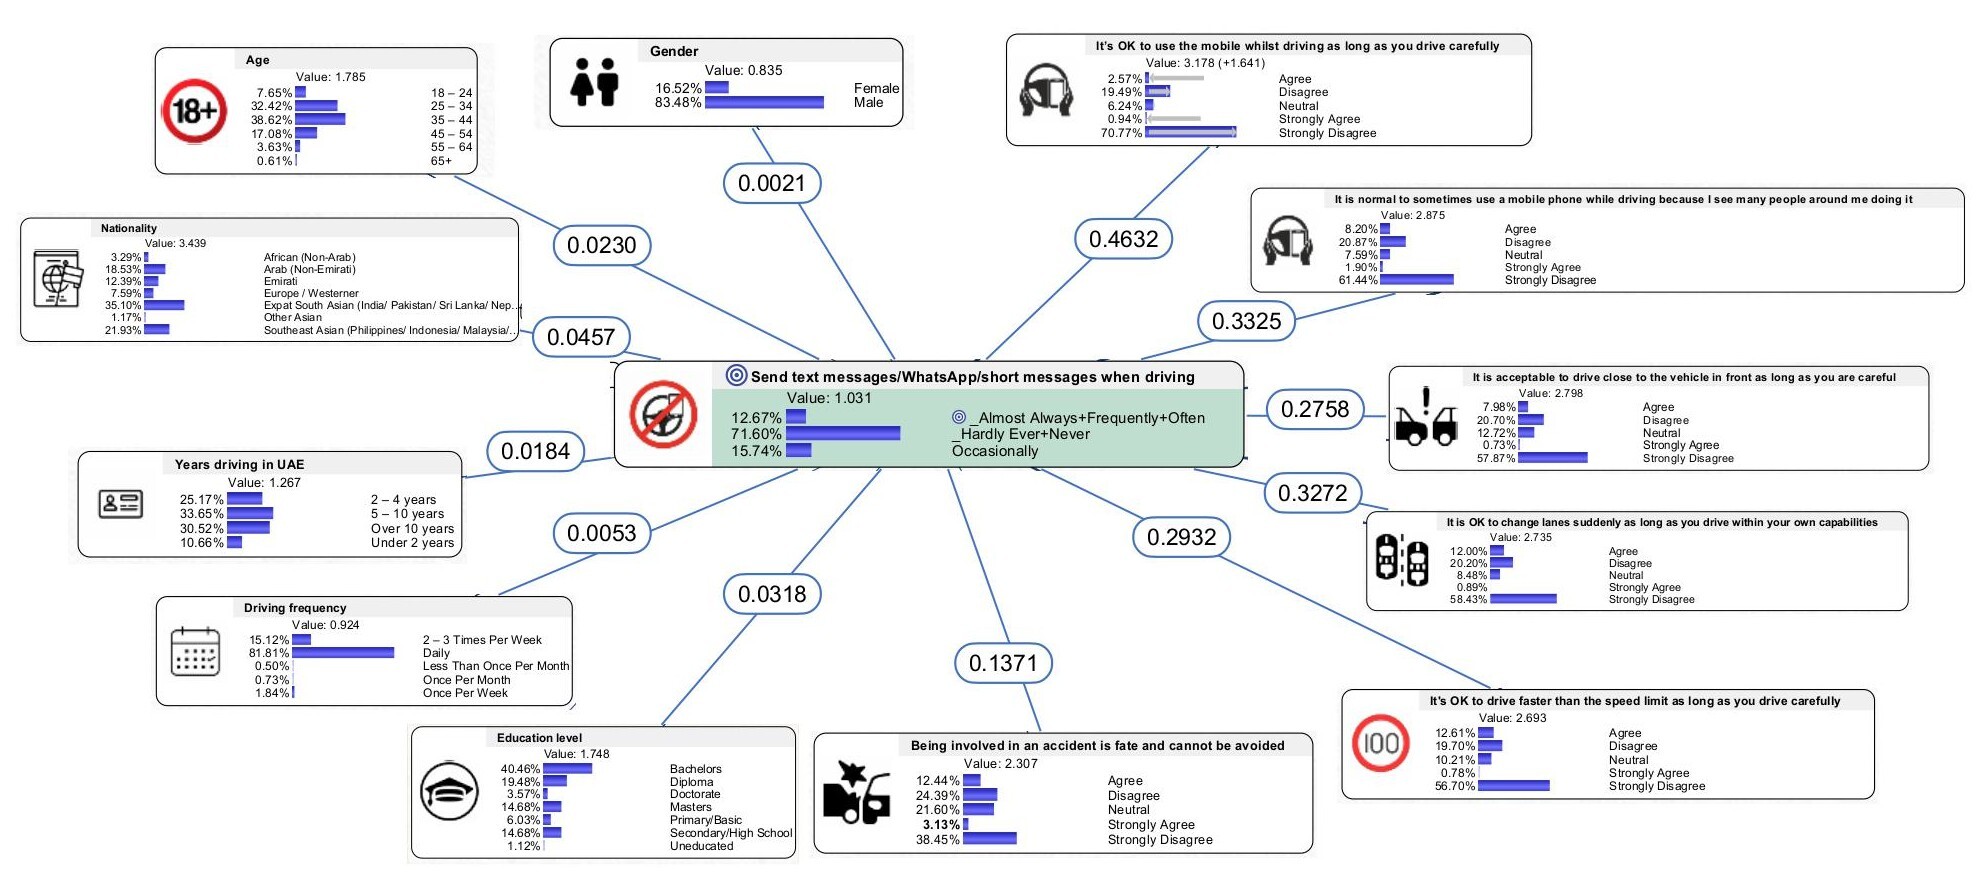
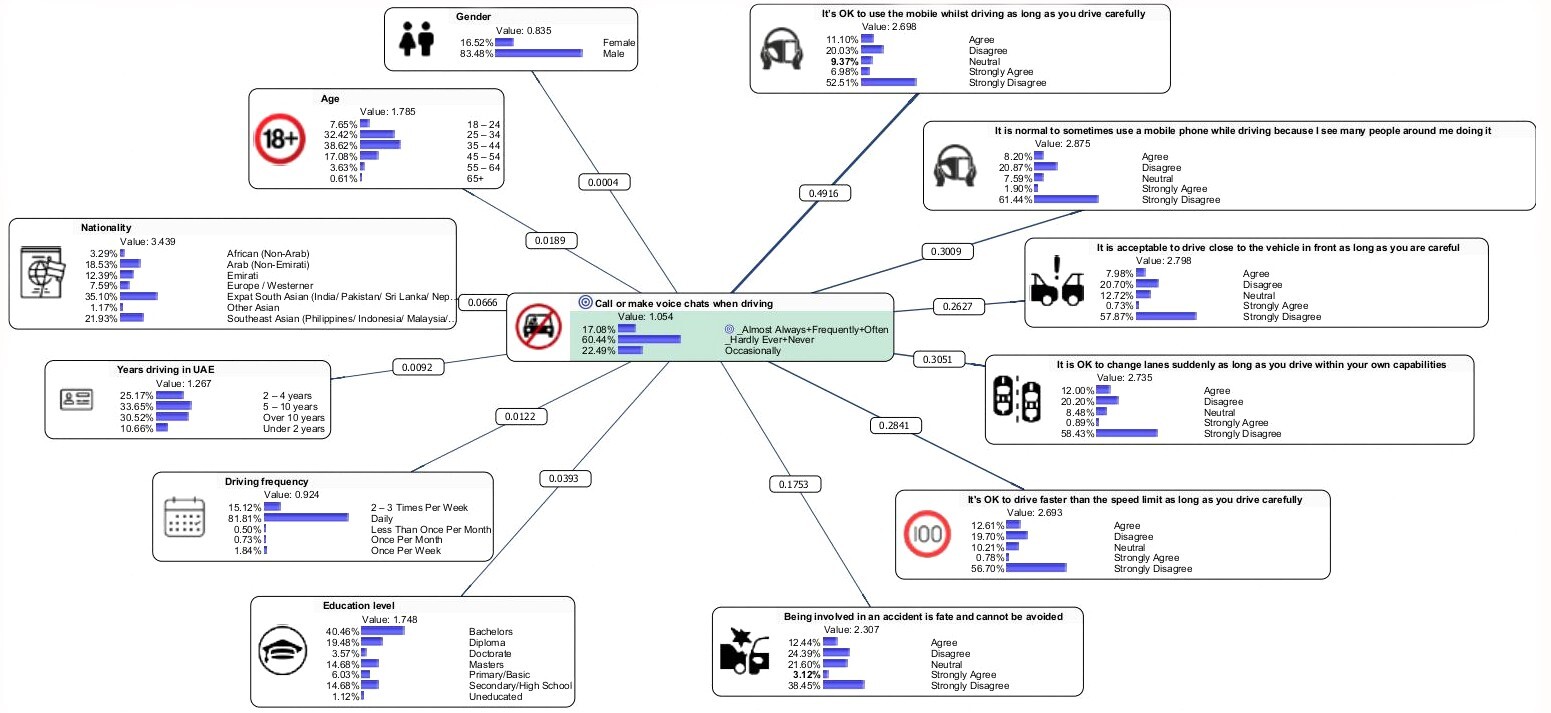
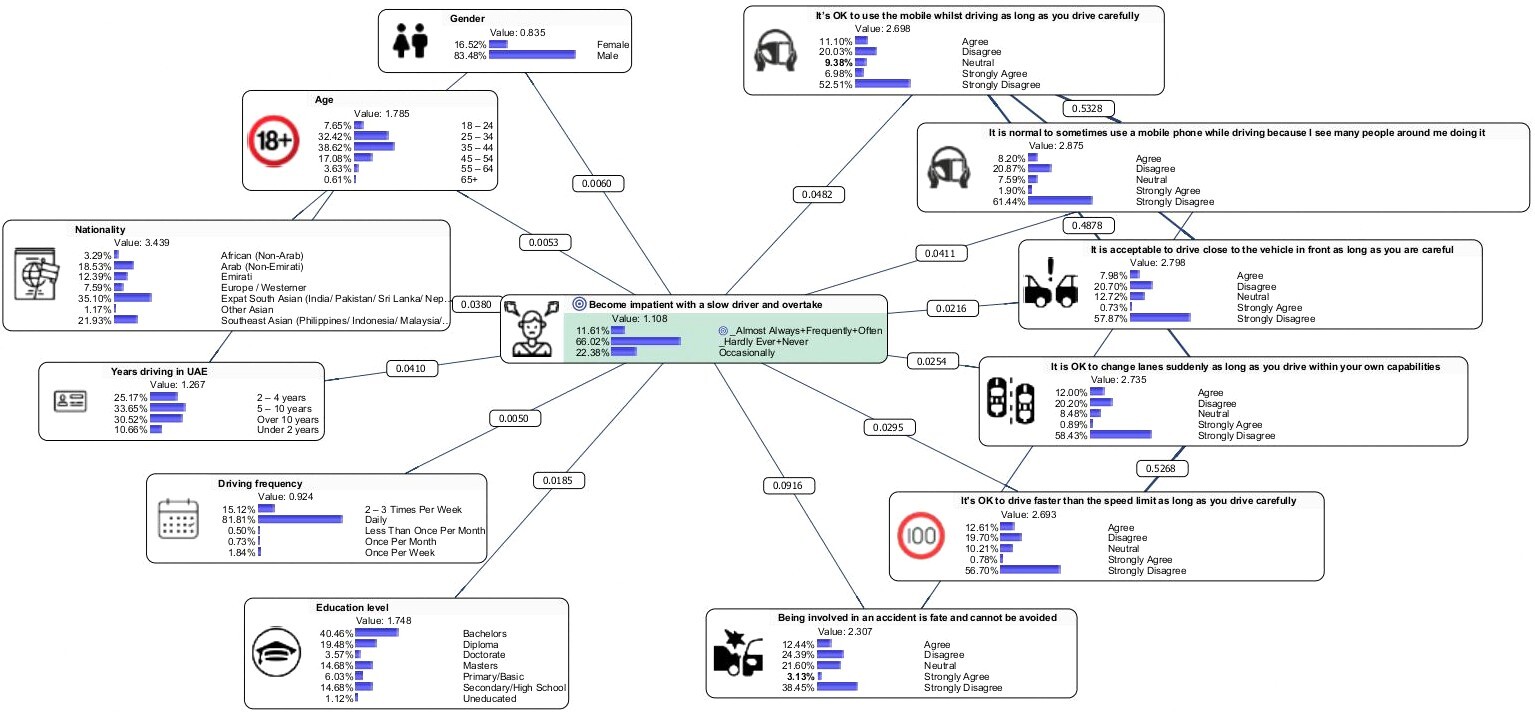
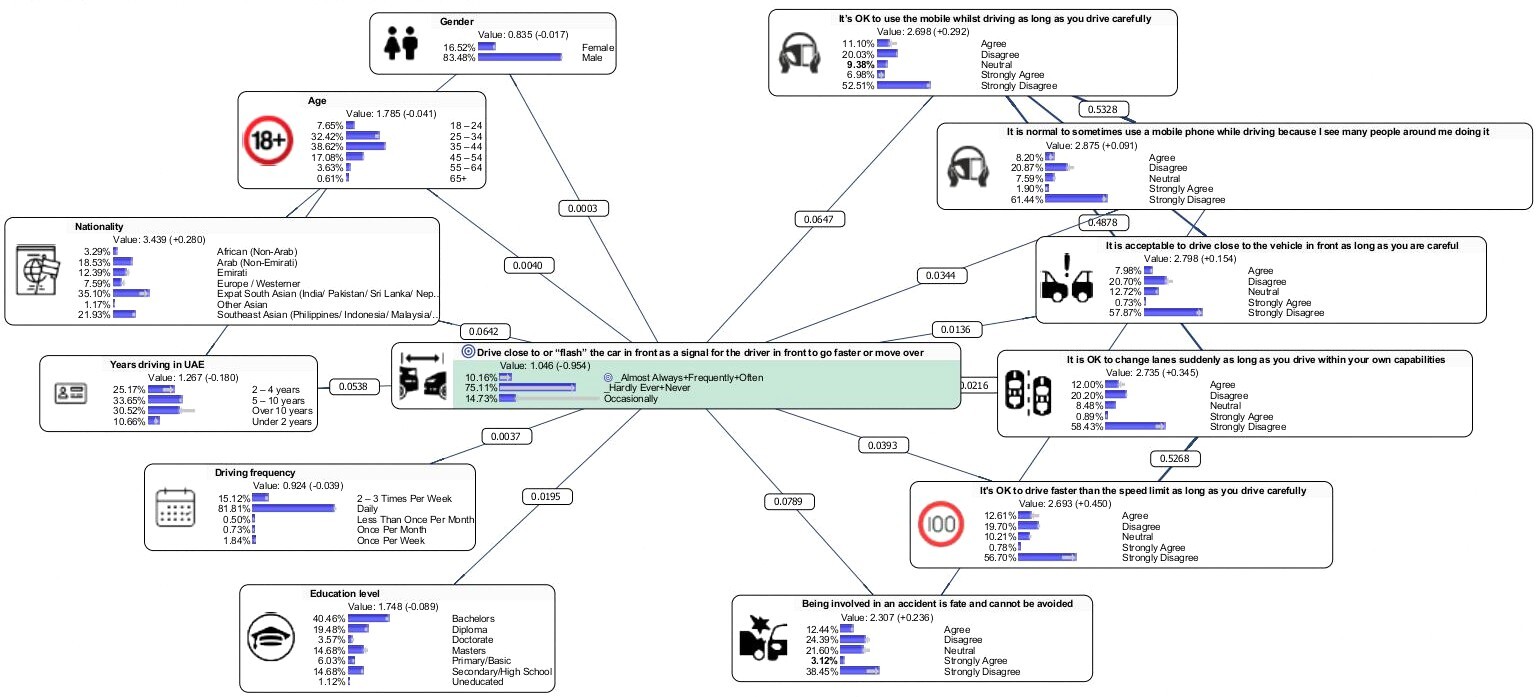
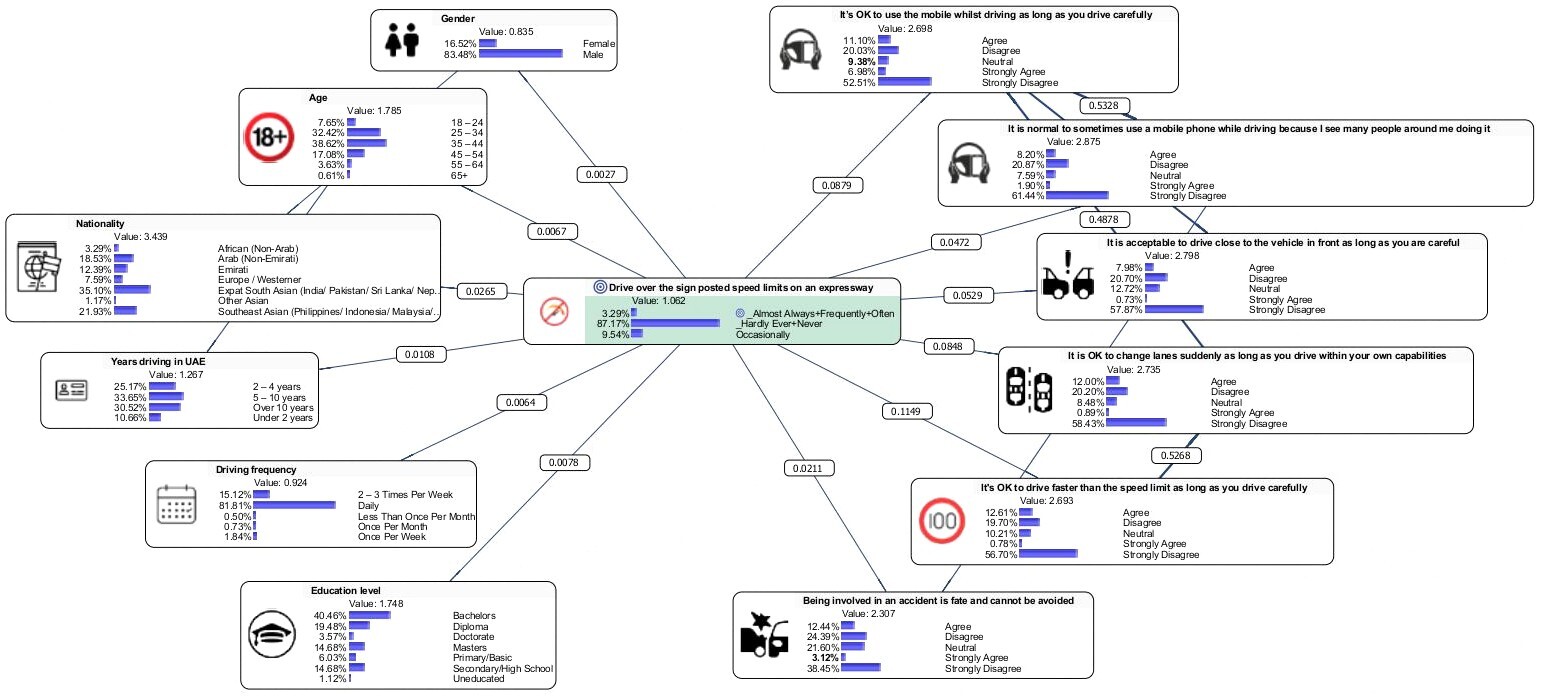
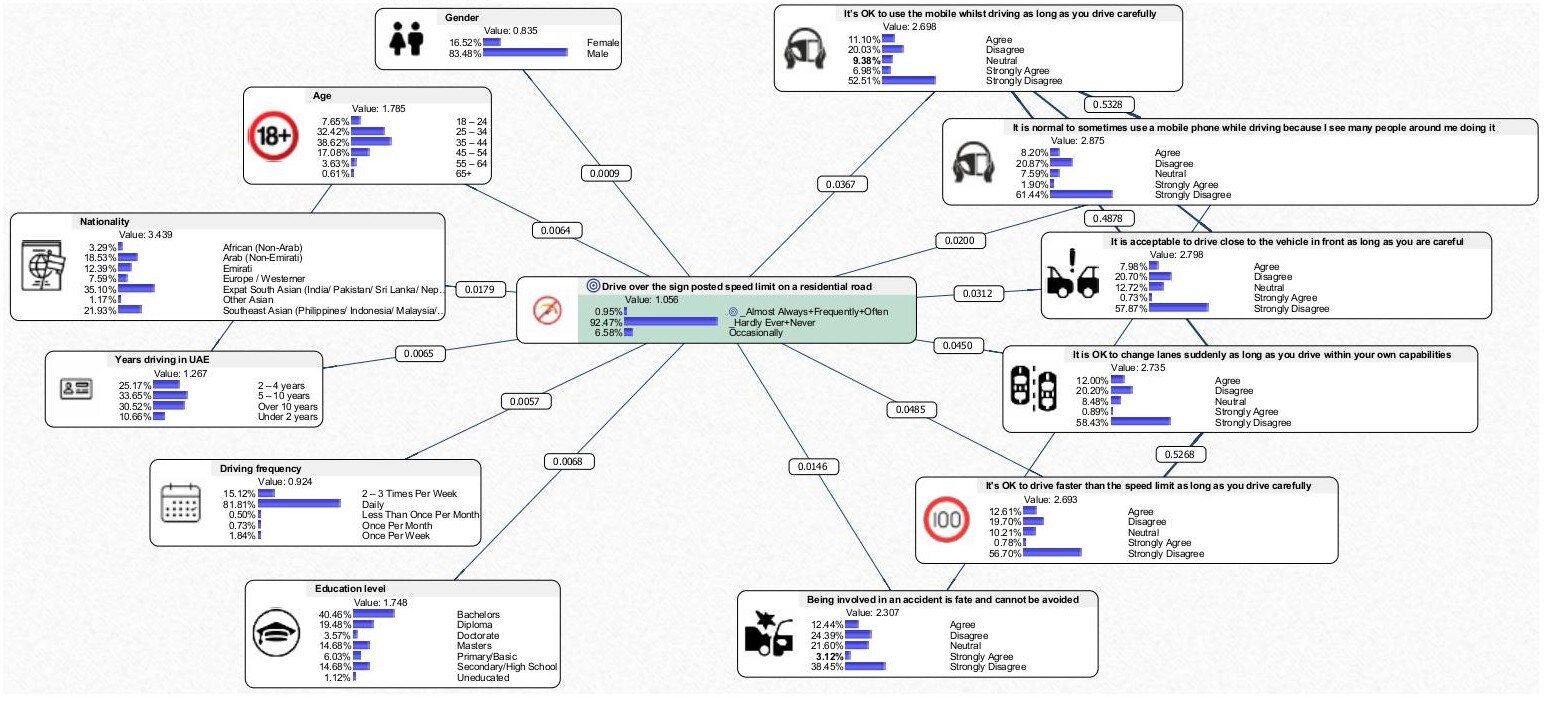
BBN model was developed by applying ML algorithms to deduce the relations existing among the DBQ variables. Each variable is represented as a box with different “states” of the variable and the corresponding probability distribution is obtained based on the collected dataset. The mutual information value related to each of the obtained relations is also represented.
Figure 3 shows the BBN model for the behaviour: “Send text messages/WhatsApp/short messages when driving” which is a violation related to the usage of phone while driving and is a common aberrant driving behaviour noticed among Asian and Middle Eastern drivers by other researchers (Alghnam et al., 2019). The highest correlation was observed for the attitude “It’s OK to use the mobile whilst driving as long as you drive carefully” based upon the magnitude of mutual information and this can be considered the most influential factor affecting the drivers’ tendency to commit the texting-while-driving violation. In contrast, “Gender” exhibited the least impact on this violation.

Similar analyses were performed on each driving behaviour construct in the DBQ to determine the highest and lowest correlation with the aberrant driving behaviour and the results for violations are presented in Appendix A. In general, the results show that the attitude of the drivers surveyed for the DBQ had a higher correlation with the driving behaviour compared to the socio-demographics variables.
Tree-based target optimisation
Target optimisation analysis was performed to identify the combination of different states of the predictor variables which maximised the target node. Tree-based search optimisation algorithm was used to perform this task. This type of optimisation analysis aided in exploring the characteristics of respondents who mostly perform the driving behaviour compared to respondents who hardly perform it. During the pre-processing phase, responses were aggregated into two groups: frequent violators (Almost always, Frequently) and non-violators (Hardly ever, Never).
During the optimisation process, the states of each variable that maximise the likelihood of a specific driving behaviour occurring were identified. To achieve this, various scenarios were presented to maximise the attributes of both frequent violators and non-violators. The contribution of these states was explained using a ‘risk score’ that represented the likelihood of a driver group committing violations. This score was determined by both the frequency of its occurrence across scenarios and the cumulative magnitude of its contribution from all scenarios.
Table 3 shows the optimisation results for the frequent violators and non-violators with respect to the violation “Send text messages/WhatsApp/short messages when driving” and the statements related to the driving factors which maximises and minimises the drivers’ tendency to commit the concerned violation. The Risk score indicates the magnitude of the risk level. For example, for the target “Send text messages/WhatsApp/short messages when driving”, the risk level of the state “normal to use mobile phone while driving = strongly agree” is almost four times higher than the state “education level = Diploma” for frequent violators.
Effect of driver attitudes on their driving behaviour
Understanding the attitudes that encourage drivers to engage in aberrant driving behaviour is crucial. From the data presented in Table 3, the risk levels of attitudes among frequent violators who commit this mistake can be ranked as follows:
-
It is normal to sometimes use a mobile phone while driving because I see many people around me doing it.
-
It is OK to use a mobile phone while driving as long as you drive carefully.
-
It is OK to change lanes suddenly as long as you drive within your own capabilities.
-
It is OK to drive faster than the speed limit as long as you drive carefully.
-
It is acceptable to drive close to the vehicle in front as long as you are careful.
-
Being involved in a crash is fate and cannot be avoided.
Effect of major socio-demographic factors on the driving behaviour
The initial BBN model assessment (Figure 3) identified that age, nationality, and education level are the most influential socio-demographic factors affecting driving behaviours. These factors significantly impact each driving behaviour construct in the DBQ. Table 4 details the socio-demographic factors that either maximise or minimise each driving behaviour for frequent violators and non-violators.
Table 4 provides an overview of the socio-demographic and behavioural characteristics of frequent and infrequent violators across violations, errors, and lapses. Younger Emirati drivers (aged 18-24 years) were identified as the group most frequently engaging in violations, such as sending text messages while driving and overtaking impatiently. In contrast, older expatriates (e.g., South Asian and African drivers aged 65+ years) consistently demonstrated safer driving behaviours, including adherence to speed limits and regular seat belt use. These findings underscore the importance of developing targeted interventions to address high-risk groups, particularly younger drivers to reduce violations and enhance overall road safety.
Due to the significant economic and social burden of traffic crashes, traffic safety has become a critical focus of road infrastructure management. Effectively reducing driver errors and distractions underpins all other road safety efforts. The UAE has experienced unprecedented economic growth and infrastructural development, attracting a large expatriate population. This has resulted in the formation of multi-cultural driving behaviour groups with diverse socio-demographics and attitudes.
Overall, attitudes had more influence on driving behaviour than socio-demographic features. The risk scores were analysed to identify the likelihood of specific driving behaviours. For the violation “Send text messages/ WhatsApp/ short messages when driving,” it was found that the attitude “It is normal to sometimes use a mobile phone while driving because I see many people around me doing it” had the highest risk score (87.01), while the least influential attitude was “Being involved in an accident is fate and cannot be avoided,” (risk score: 27.61). However, some effects of nationality and driver age were noted, with Emirati nationals and younger drivers showing a greater inclination towards negative attitudes. The insights from this analysis can help policymakers and decision-makers better monitor drivers and provide necessary awareness to enhance overall road safety.
Based on insights obtained from the BBN analysis in this study, several implications emerge to inform policies and regulations:
-
Prioritising Efforts: Understanding the significance of drivers’ age and nationality in relation to their tendency to commit violations helps in driver profiling and rationalising targeted improvement efforts.
-
Identifying Key Attitudes: Identifying the predominant driver attitudes and beliefs that influence the tendency to commit specific violations, such as the perception that using a mobile phone while driving is safe if done cautiously, aids in understanding unsafe behaviours.
-
Identifying Risky User Groups: Assessing which driver types are more predisposed to committing various types of violations enables the assignment of a risk score to each variable. Identifying combinations of variables with the highest risk scores facilitates the identification of the most high-risk user groups.
The approach used in this study models the domain comprehensively, facilitating an understanding of the complex mechanisms of variable interrelations and the direct or indirect implications of different interventions on various outcomes.
Study strengths and limitations
While this study provides valuable insights into the influence of socio-demographics and attitudes on driving behaviour, several limitations should be acknowledged. First, the data were collected exclusively from mall visitors, which may not fully represent the broader driving population. Expanding data collection to include other public settings and road user groups would enhance the generalisability of findings. Second, as self-reported data were used to assess driver attitudes and behaviours, the study is subject to potential biases, such as social desirability, where participants may respond in ways they perceive as socially acceptable. This may have influenced the observed relationships between attitudes and behaviours. Lastly, this study did not explore the perceived crash risk associated with specific behaviours, which could provide critical insights into drivers’ risk perceptions and decision-making processes. Addressing these limitations in future research would further refine and validate the study’s conclusions, ultimately contributing to more effective road safety interventions.
Conclusion
This study used a BBN approach to explore the relationship between drivers’ socio-demographics, attitudes, and their driving behaviours, using the Theory of Planned Behaviour as the analytical framework. A modified, attitude-inclusive DBQ tailored to the cross-cultural driver groups in Abu Dhabi and the region was constructed. Machine learning algorithms were used to train the data, and various BBN models were developed to study driving behaviours categorised as violations, errors, and lapses. The relationships among predictor variables (socio-demographics and attitudes) and the target variable (driving behaviour) were estimated, with the intensity of these relationships determined by mutual information value.
Identifying risky behavioural attitudes, beliefs, perceptions, and tendencies helps decision-makers develop targeted measures to improve driver awareness, enhance road risk perceptions, and encourage safe driving behaviours. Correlating stronger Likert scale values with specific socio-demographic categories can identify “risky” driver groups and their “harmful” attitudes for targeted intervention. A tree-based optimisation procedure was used to understand the combinations of predictor variable states that maximise and minimise the occurrence of aberrant driving behaviours such as speeding, tailgating, lane swerving, and flashing. Future research should use larger datasets with more balanced distributions of socio-demographic features for greater reliability and generalisability of findings.
Acknowledgements
The authors acknowledge Kenan Alzoubi in helping with the data collection.
AI tools
AI tools were not used in this study nor in the preparation of this paper.
Author contributions
Conception : Umair Hasan, Arif Mehmood, Sumaya AlNeyadi, Hamad AlJassmi Design: Umair Hasan, Arif Mehmood, Babitha Philip, Aisha Hasan, Sumaya AlNeyadi, Hamad AlJassmi Execution: Umair Hasan, Babitha Philip, Hamad AlJassmi Analysis and interpretation of the reported study: Umair Hasan, Babitha Philip, Hamad AlJassmi Draft article: Umair Hasan, Babitha Philip, Aisha Hasan Article revision: Umair Hasan, Babitha Philip, Aisha Hasan, Hamad AlJassmi Final approval of the version: Umair Hasan, Hamad AlJassmi Funding: Arif Mehmood, Sumaya AlNeyadi, Hamad AlJassmi All authors have read and agreed to the published version of the manuscript.
Funding
This research was funded by Integrated Transport Centre (Abu Dhabi Mobility) in Abu Dhabi.
Human Research Ethics Review
The study was reviewed and approved by UAEU Social Sciences Ethics Committee – Research /Course on 09/03/2024.
Data availability statement
Data will be available upon request.
Conflicts of interest
The author(s) declare(s) that there are no conflicts of interest.


