Introduction
Road safety is a fundamental concern for public health and development, and it is a major source of death and injury worldwide. Over the last four decades, there has been a steady rise in road traffic crash-related fatalities and injuries, which are increasing due to factors such as lack of awareness among drivers and the public, overpopulation, poor road quality, inadequate driver training, speeding and drink driving (Balasubramanian & Sivasankaran, 2021; Tsala et al., 2021). The India Status Report on Road Safety 2024 states that in 2021, injuries and fatalities from traffic crashes ranked as India’s 13th most common cause of mortality and 12th most common cause of health loss (Panwar & Tiwari, 2024). Among the top 10 causes of health loss in six states, including Uttarakhand, are road crashes (Panwar & Tiwari, 2024). In Uttarakhand, in 2022, the number of road crashes was 1,674, of which 1,042 people died, and estimates report another 1,613 people were injured. In terms of road-user categories, the most fatalities involved people riding two-wheeler vehicles (19.5%), followed by pedestrians (17.3%). However, among children and young people, aged 5 to 29 years, road traffic injuries are the leading cause of death (WHO, 2023).
Young drivers (aged 17 to 25 years) are frequently involved in traffic violations and risky behaviours, including speeding (Scott-Parker et al., 2013). Some studies found that young drivers tend to tailgate vehicles in front of them or overtake vehicles dangerously (Fernandes et al., 2010; Tarlochan et al., 2022). In addition, high-risk behaviours like street racing and on-road stunt driving are linked to a higher chance of crashes, injuries, and fatalities among young drivers (Vingilis et al., 2018). The skills required to identify and respond to road hazards in a safe manner are not completely developed in young drivers due to a lack of driving experience (Lyon et al., 2020). Additionally, driver inattention among young drivers is a substantial factor to collisions (Neyens & Boyle, 2008). This age group also statistically shows higher involvement in risky driving behaviours such as speeding, red light violations, and drink driving, making them a critical target audience for road safety awareness campaigns. Speeding is the leading cause of death among traffic rule violations, accounting for 46.8 percent of fatalities (State Transport Department, Government of Uttarakhand, India, 2024). Drink driving also contributes to a high proportion of crashes, more frequent among men aged 18 to 34 years than any other group (Shope & Bingham, 2015; Williams Jr et al., 2018; Wu & Chen, 2024) and intoxicated drivers were reported to be responsible for a substantial number of road incidents (5.7%), fatalities (2.9%), and injuries (4.2%) (State Transport Department, Government of Uttarakhand, India, 2024). Similarly, red light violations increase the likelihood of side-impact collisions at intersections, which can result in serious injuries or fatalities (Gopaul et al., 2016; Retting et al., 1999). However, despite this, road crashes and fatalities due to red light violations account for only 0.06 percent. Notably, 2,232 court summons were issued for red light violations, whereas only 1,032 instances of compliance were recorded (State Transport Department, Government of Uttarakhand, India, 2024). Immediate attention is needed to address the road safety concerns among young drivers.
Many studies have been conducted on road safety awareness, behavioural patterns, knowledge of basic traffic rules, and driving attitudes toward road safety among young people (Chaurasiya et al., 2020; Gaire et al., 2022; Oinam et al., 2019). There is an urgent need for innovative, scalable, and technological solutions despite numerous efforts by several sectors to raise awareness. The use of social media by individuals, organisations, and governments for communication has increased in recent years. With the increasing integration of social media into everyday life, many government organisations are creating a presence on these platforms (Bonsón et al., 2017). Government organisations, such as police departments, are increasingly utilising social media to engage with the public, share information, strengthen ties, and increase awareness (Charles & Pal, 2020; Dev & Mishra, 2024). The Uttarakhand police department in India recently implemented a strategy approach using social media platforms to engage, effectively communicate, and create public awareness about social and public concerns, including road safety. This innovative method uses humorous posts, such as internet memes and other comical posts, on their respective social media sites (Mishra & Chowdhury, 2024). Given their critical role in road safety, three issues, speeding, drink driving, and red light violations, have become key themes in public awareness campaigns, including through social media platforms using internet memes.
An internet meme is defined as “a piece of culture, usually a joke, that becomes influential through its transmission through the internet” (Davison, 2012, p. 122). It is a type of content that is quickly disseminated and highly captivating, typically in animation, GIFs, images, text, or video (Malodia et al., 2022; Mishra & Chowdhury, 2024). In previous studies related to the police force and departments, the internet meme strategy has led to a substantial rise in followers and has been demonstrated to be effective in increasing exposure and user engagement on the police department’s social media accounts (Charles & Pal, 2020; Wood, 2020; Wood & McGovern, 2020).
To the best of our knowledge, no study has explored the visual culture of internet memes used by the police force for awareness regarding societal issues, including road safety. Therefore, this study contributes new knowledge from an investigation of how the Uttarakhand police department designs and implements a “Safety on the Roads” campaign using internet memes to increase road safety awareness through its Facebook page. We also assessed the perceptions or opinions of their Facebook page followers regarding the visual and verbal evaluation of internet memes and examined how internet meme posts (incorporating humour or light-hearted elements) differed from non-meme posts (focusing solely on providing safety tips and advice without incorporating humour or light-hearted elements) in terms of their insights (i.e., exposure-reach, impression, and engagement). This study seeks to fill the gap in understanding how online activity from a road safety authority (Police) using humour and visuals intersects with behavioural messaging in the context of road safety awareness.
Method
Research design
This study used a quantitative, descriptive-comparative design to examine the objective and a cross-sectional design to investigate exposure and engagement dynamics over a set period.
Sampling design
For respondents
The Uttarakhand police Facebook page has 354,953 followers, with 94.9 percent based in India and the remaining 5.1 percent from other countries, and a wide range of socioeconomic backgrounds. Potential study participants were identified from followers of the page who were aged 18 to 29 years (the selection was conducted manually, where followers were reviewed based on publicly available profile information such as bio, location, profile activity, or age indicators). Those who appeared to meet the age and location criteria were contacted via direct message (DM) with a brief introduction about the study and a link to the questionnaire using the personal social media account of the co-author, which was used solely for academic purposes. The message clearly stated the voluntary nature of participation, ensured that the responses would remain anonymous, and clarified that no personal data would be collected or stored. The inclusion criteria was engagement with the Facebook page, including interactions with posts (i.e., reactions, shares, comments, or saves).
Quota sampling was employed to select the respondents (e.g., aged 18 to 29 years, residing in India, selected from followers of the Uttarakhand Police Facebook page). Based on Krejcie and Morgan (1970), the sample size for this population of followers is 384 with a 95 percent confidence level and a 5 percent error estimate. Over the four months from 10 May to 27 August, 2024, the survey was sent to 759 followers of the Uttarakhnad police Facebook page. In total, 507 responses were received, of which 384 completed surveys met the inclusion criteria.
For visual experts
The study included university-educated experts in visual arts and culture (n=6, aged 25-65, with experience of more than 10 years) affiliated with the faculties of arts and cultural studies at Indian universities. The visual experts were selected using non-probability convenience sampling. They were identified through institutional websites, research profiles such as Google Scholar, ResearchGate, academic recommendations, or prior professional interactions. All selected experts had formal qualifications and teaching or research experience in relevant areas, including visual communication, media studies, or cultural theory, ensuring their suitability for contributing to the study.
Data collection
Pictorial stimuli
We manually reviewed all the posts uploaded to the Uttarakhand police Facebook page between January and December 2023. We selected a sample of 25 road safety posts. As per the inclusion criteria, the post needed to have at least 1,000 Likes and be either a humorous meme (Carroll, 2014) or still (n=16, that addressed speeding, drink driving, red light violations) or a non-meme, non-humorous post that provided safety tips or advice (n=9). The police social media team provided metrics on the 25 posts using the Facebook business suite and included two measurements: Exposure (reach and impressions) and Engagement (reactions, shares, comments, saves).
Instruments
The survey link was sent to the Facebook followers with an option to answer in Hindi or English. The survey contained 13 questions, including 10 close-ended multiple-choice questions (Figure 1) and three statements with responses on a 5-point Likert scale (Table 2).
The five visual content experts assessed the top five meme posts and five non-meme posts on the internet based on visual and verbal characteristics. To complete the assessment, the experts used a visual and verbal evaluation survey adapted from Smirnova et al. (2021).
Data analysis
The results of the survey were examined using descriptive statistics such as mean, standard deviation, and percentage. To find out whether there is a statistically significant difference in reach, impression, and engagement between the two groups of internet meme posts and non-meme posts, a series of independent sample t-test was conducted. The statistical analysis was conducted using SPSS (Version 25.0).
Results
Facebook followers
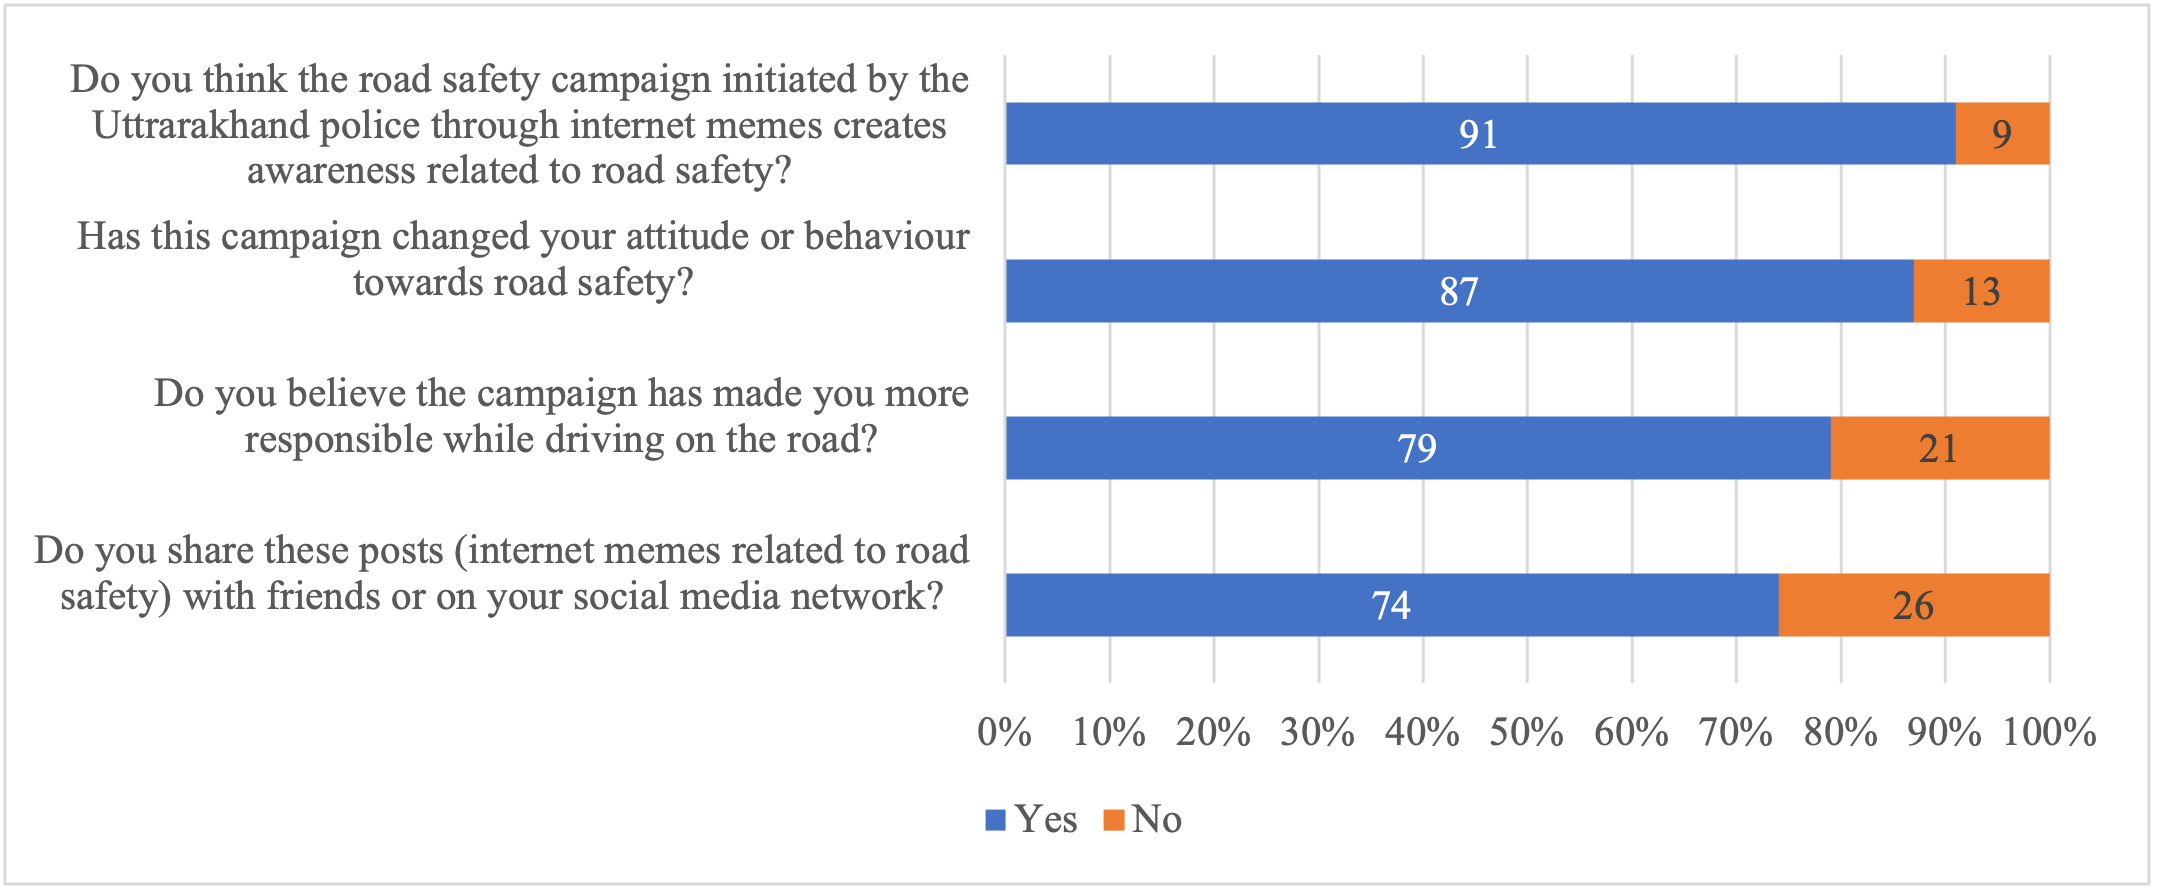
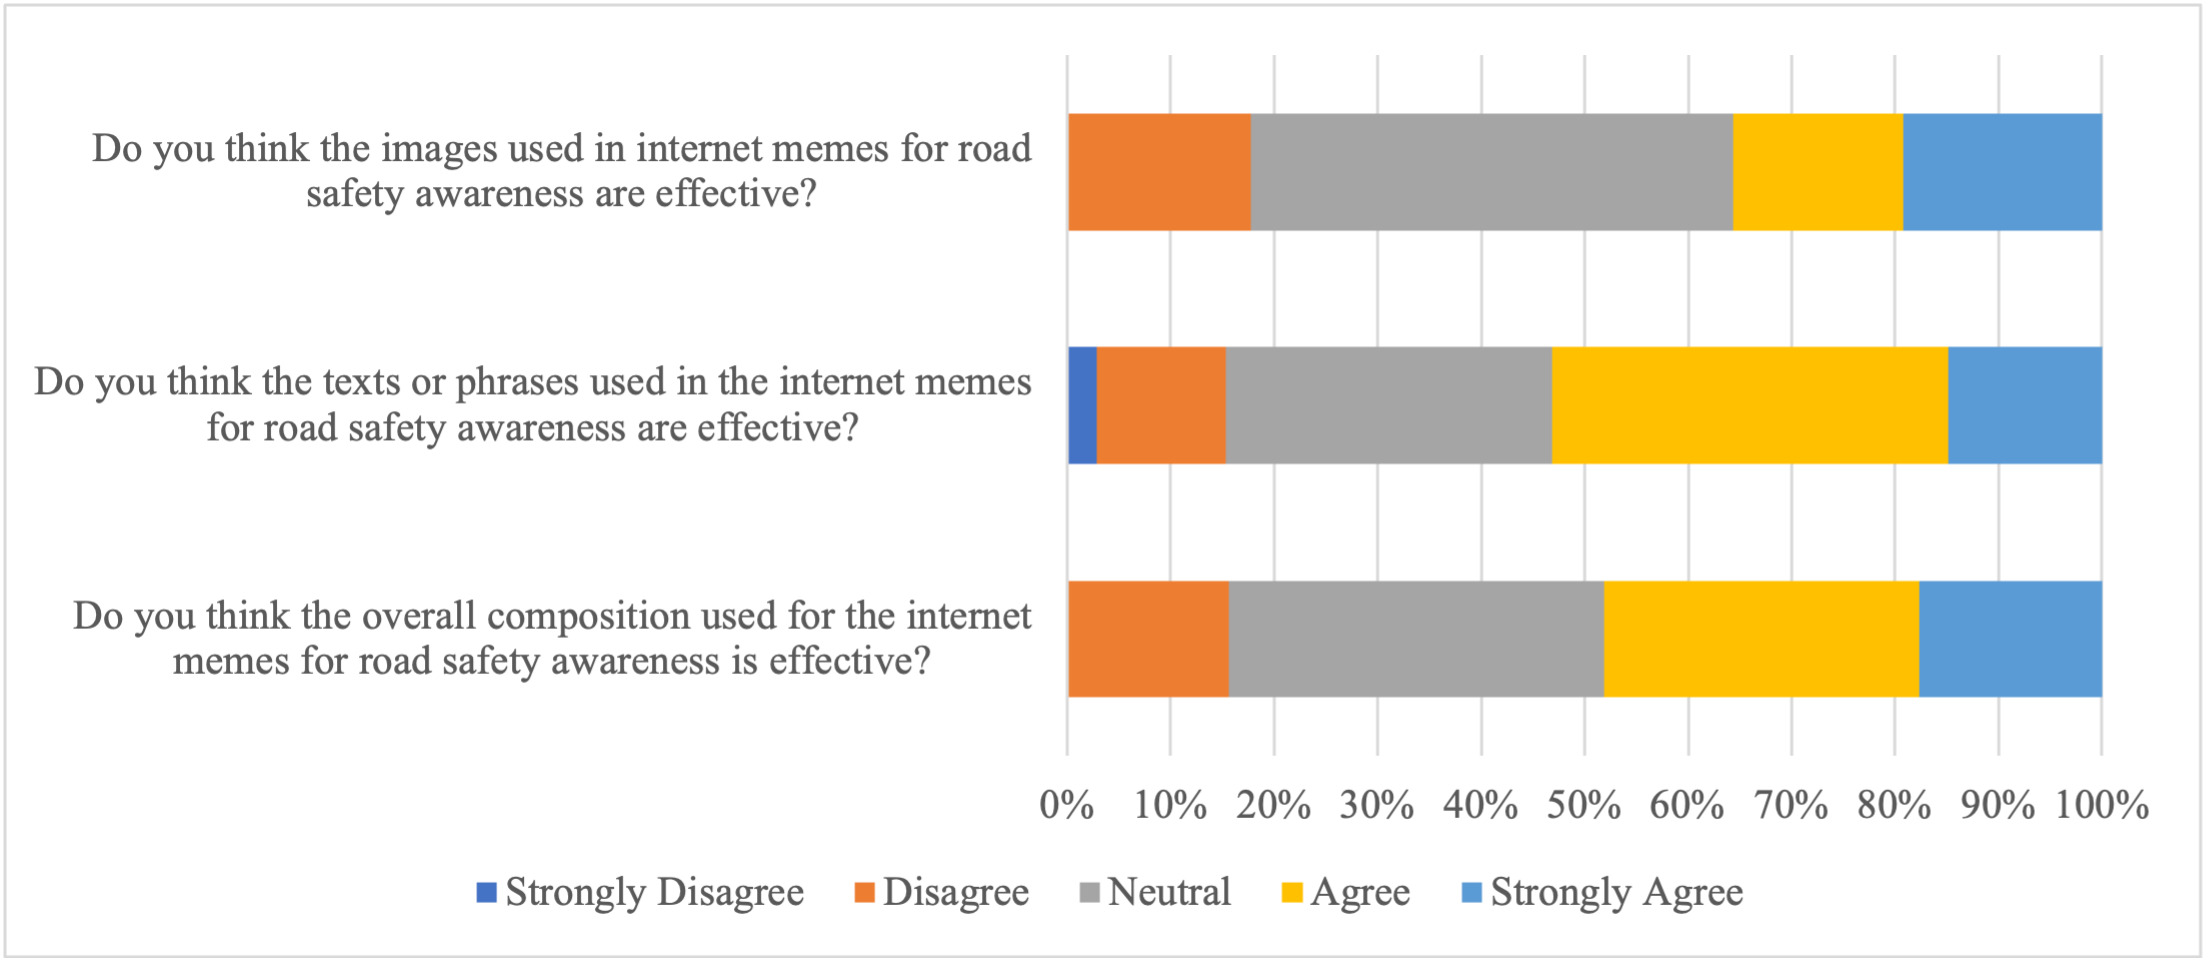
A total of 384 respondents who responded to the online survey were followers of the Uttarakhand police Facebook page. Table 1 displays the respondents’ demographic information. The majority of the respondents reported that the “Safety on the Roads” campaign initiated by the Uttrakhand police through internet meme posts created awareness related to road safety, changed their attitude or behaviour towards road safety, made drivers more responsible while driving on the road, also shared these posts with friends or on their social media (Figure 1). Self-reported perceptions of the respondents about visual and verbal evaluation of the internet memes are below (Table 2, Figure 2).


Visual content experts
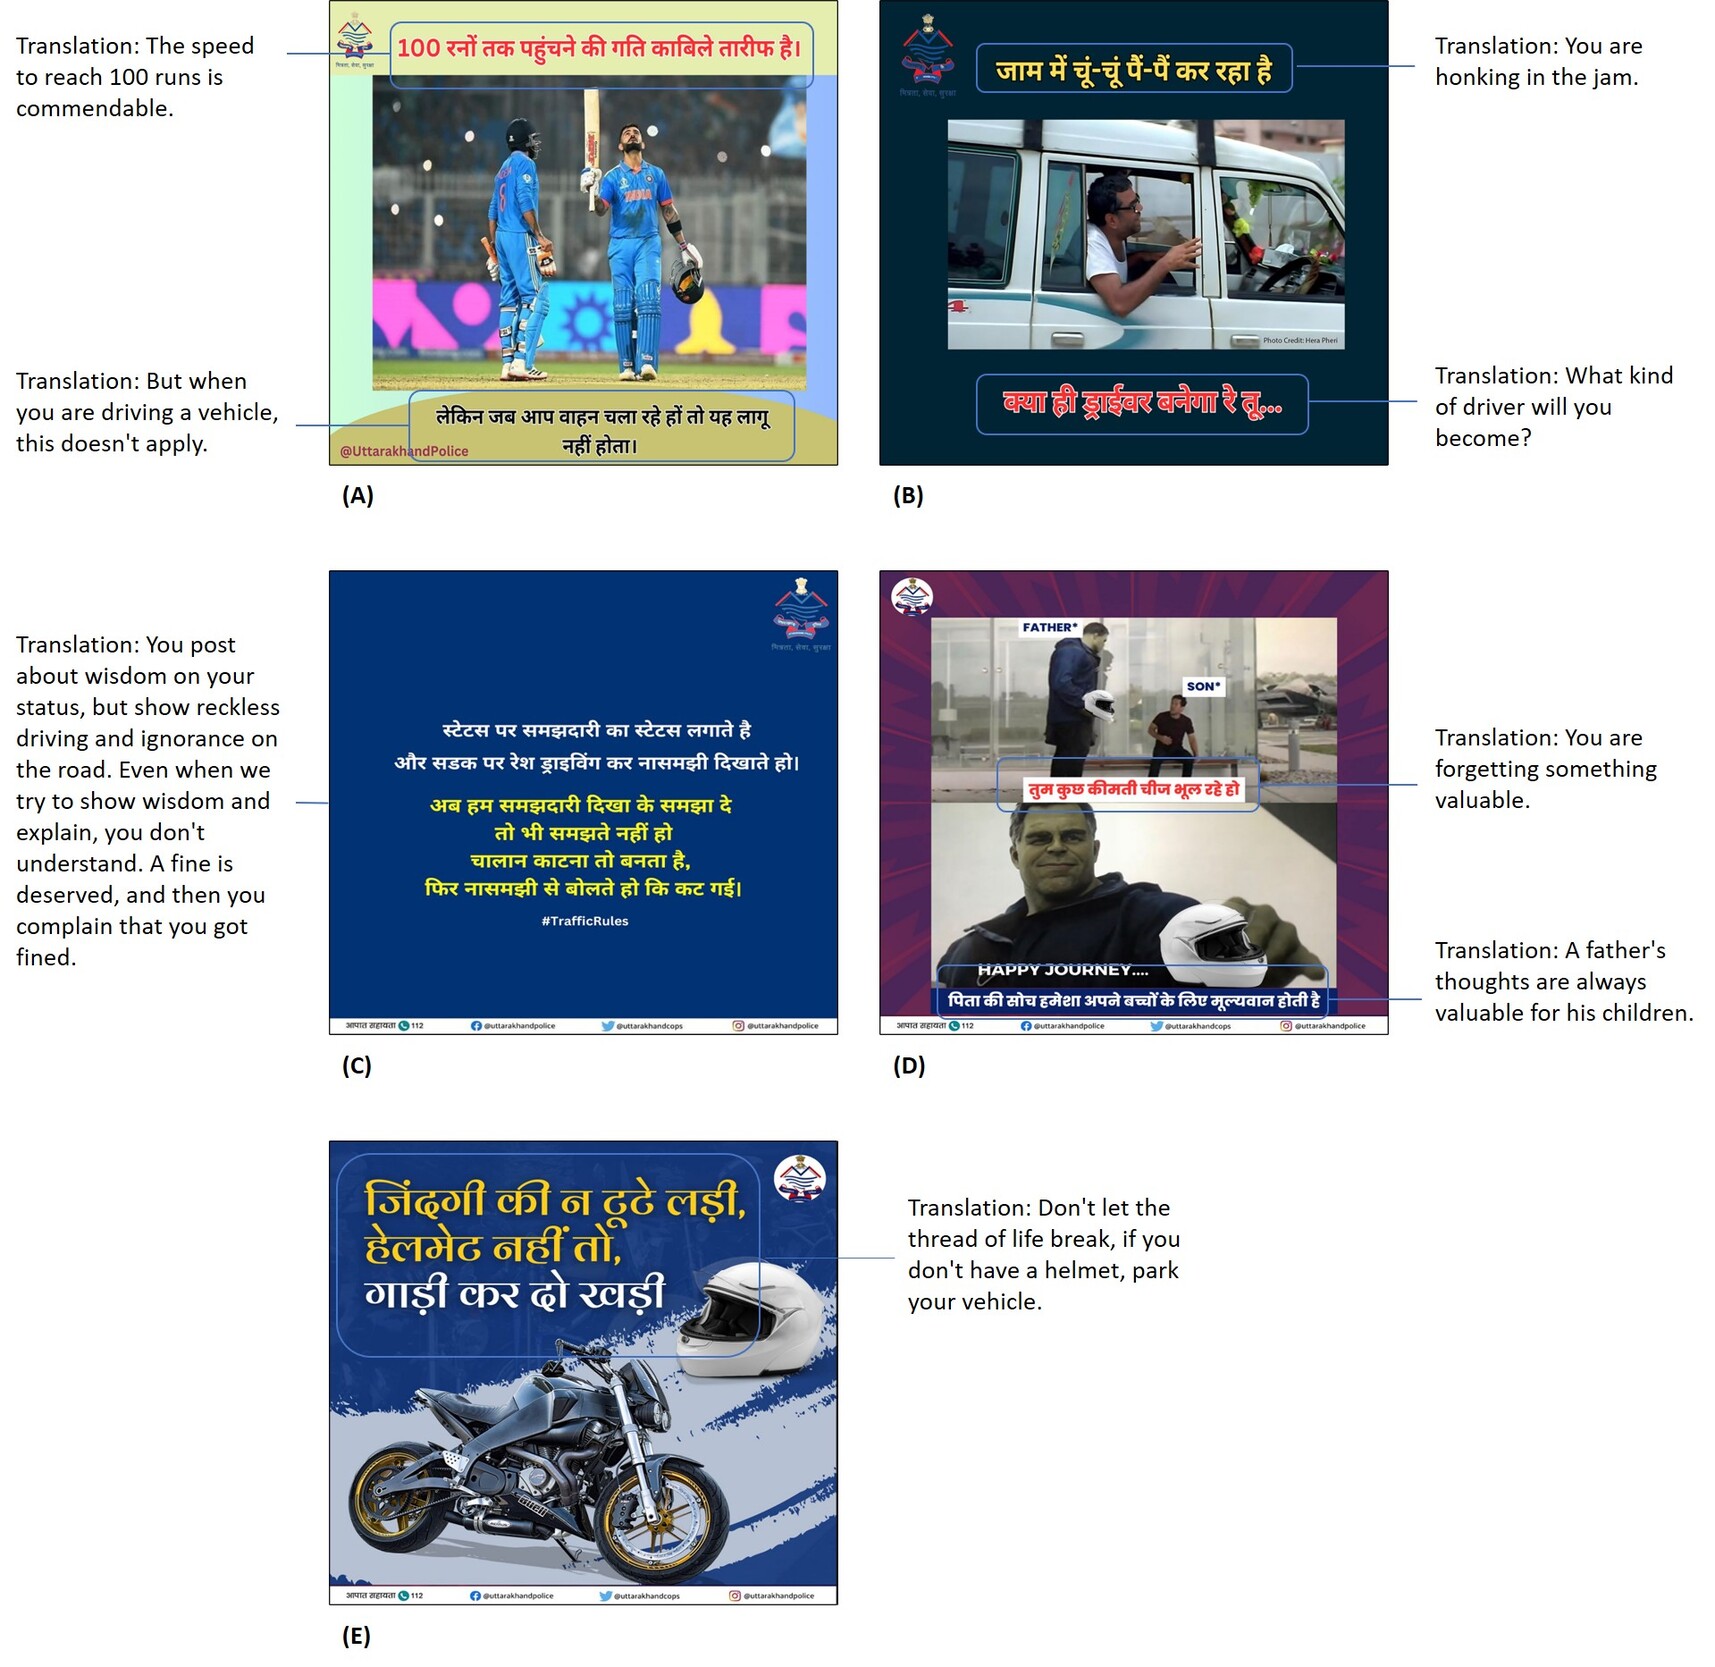
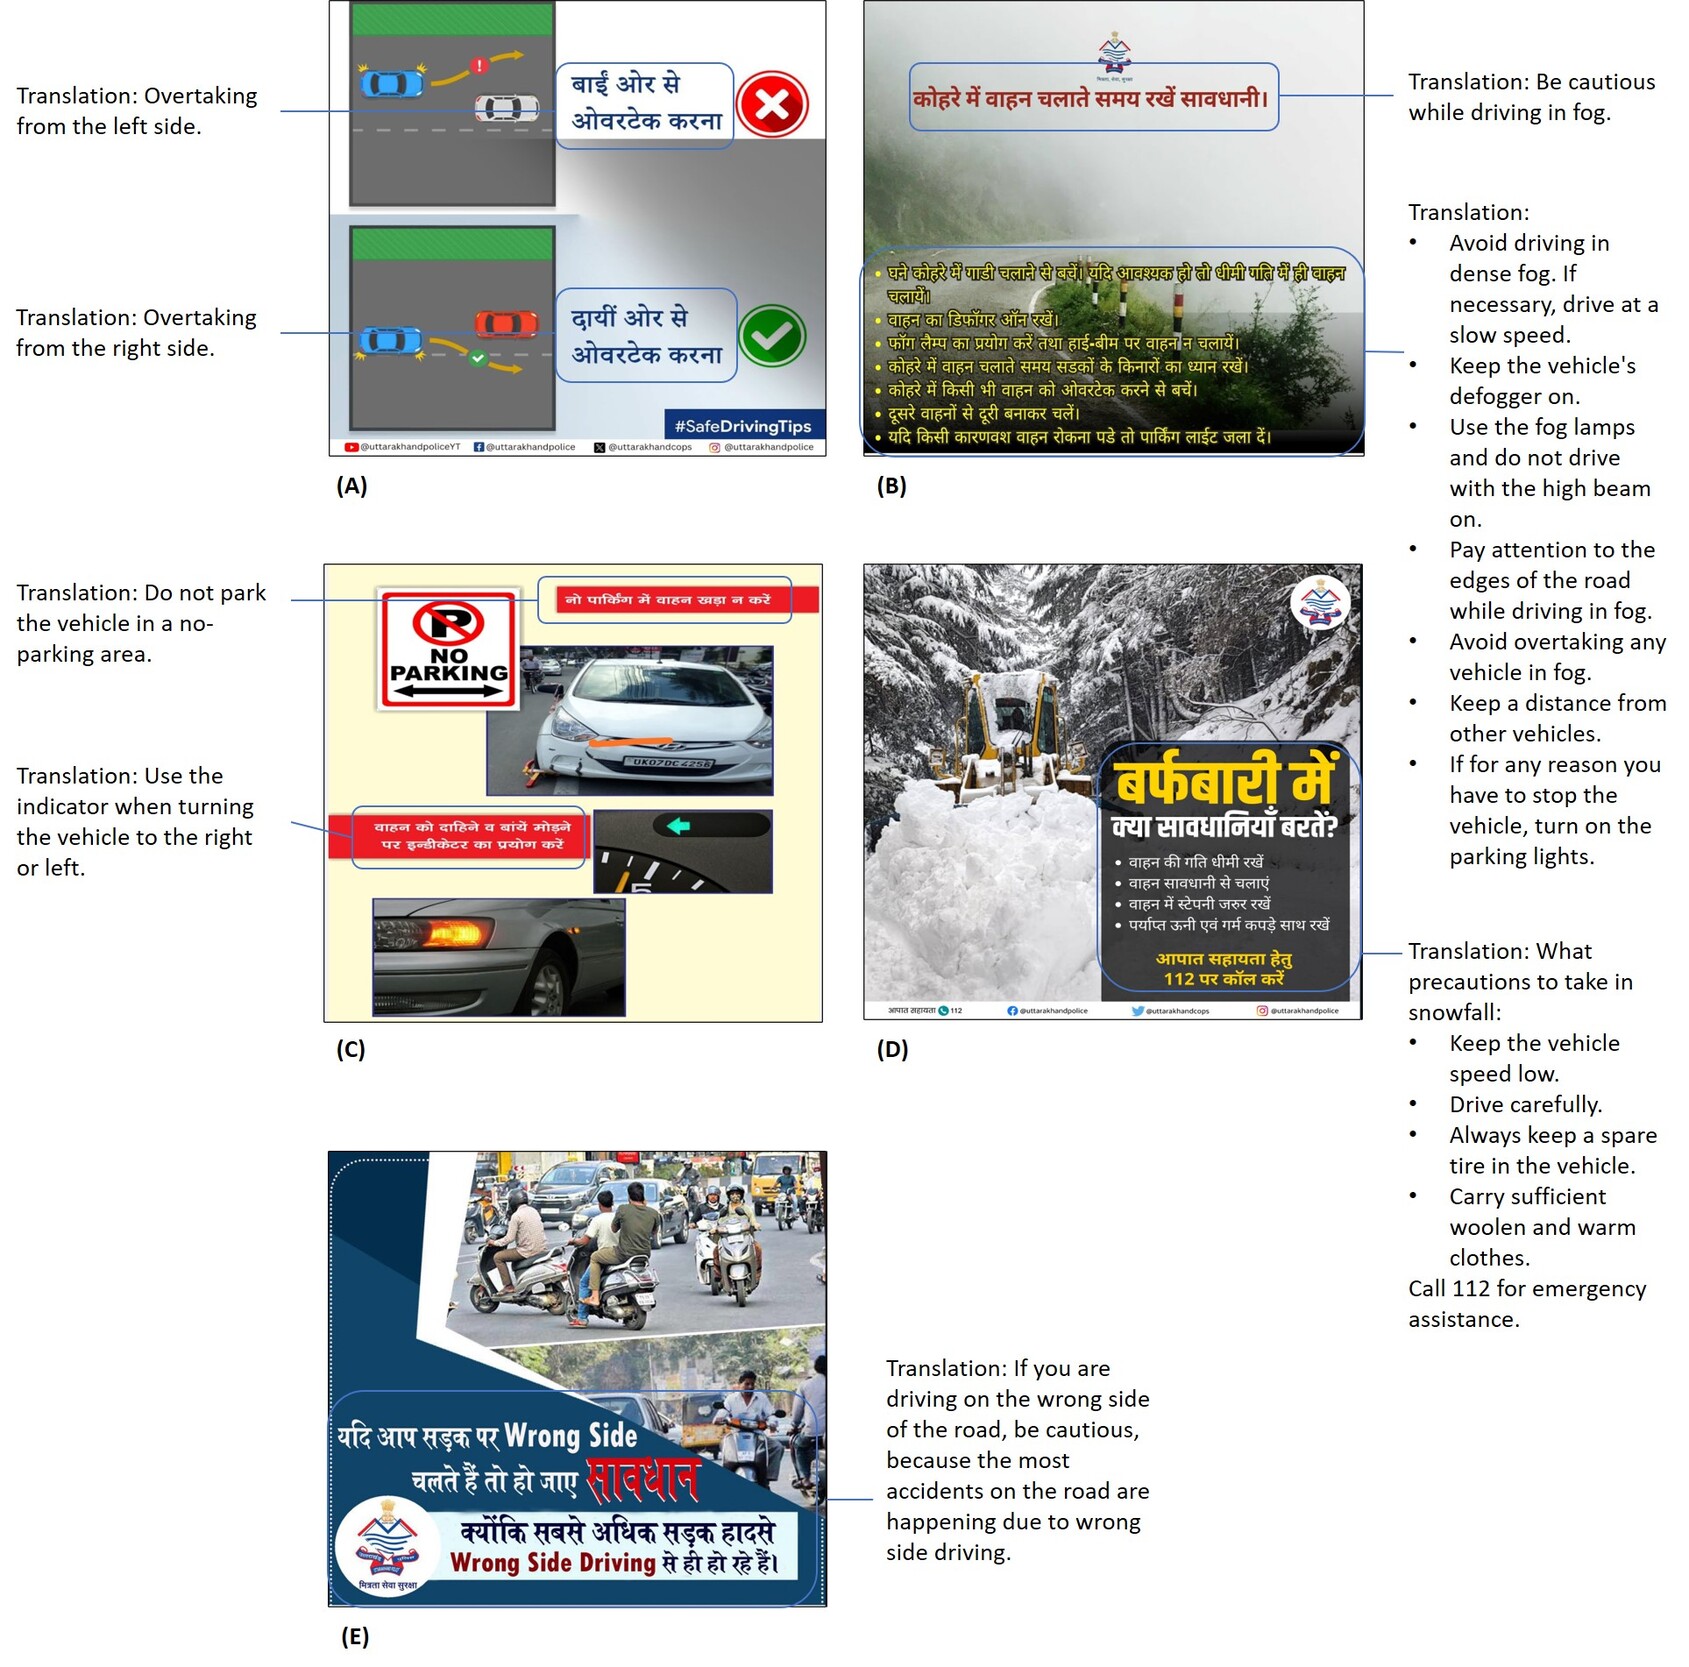
The visual content experts assessed for the five road safety-related internet meme posts (Figure 3) and five non-meme posts (Figure 4) on the Uttarakhand police Facebook page. Every internet meme post and non-meme post has used a table to show the visual experts’ average scores. By rating it on a scale of 1 to 5, experts determine an average score based on multiple factors related to their verbal, and visual qualities. Based on the survey results, Meme B got a higher overall score (visual and text elements) of 4.0 from the visual experts, while Meme C got a lower overall score (visual and text elements) of 2.4 from the visual experts (Table 3). Conversely, Non-meme A got a higher overall score (visual and text elements) of 3.4 from the visual experts, while non-meme B, C, and D got a lower overall score (visual and text elements) of 2.4 from the visual experts (Table 4). As a result, visual experts’ average scores for internet meme posts are greater than those for non-meme posts.


A series of independent sample t-test was conducted on the secondary data related to the post metrics obtained from the Facebook business suite and provided by the Uttarakhand police social media team. The purpose of the test was to compare the exposure- reach, impressions, and engagement between internet meme posts and non-meme posts.
Meme posts were more successful than non-meme posts across the three criteria: reach, impressions, and engagement (p<.05). Reach had significant differences (t (23) =2.903, p<.008) in the scores with the mean score for memes (M= 30618.12, SD= 8498.15) higher than non-memes (M= 20465.78, SD= 8191.70). The magnitude of the difference was significant (mean difference= 10152.34, 95%CI [2918.2, 17386.4]). Impressions had significant differences (t (23) =2.968, p<.007) in the scores with the mean score for memes (M= 31398.69, SD= 8701.43) higher than non-memes (M= 20838.67, SD= 8229.66). The magnitude of the difference was significant (mean difference= 10560.02, 95%CI [3198.78, 17921.25]. Engagement had significant differences (t (23) =2.487, p<.021) in the scores with the mean score for memes (M= 312.44, SD= 161.23) higher than non-memes (M= 166.44, SD= 91.27). The magnitude of the difference was significant (mean difference= 145.99, 95%CI [24.54, 267.44].
Discussion
The survey results based on respondents’ perceptions support the idea that the Uttarakhand police’s “Safety on the Roads” campaign using internet memes raised awareness, changed attitudes, or behaviour toward road safety. Internet memes have been utilised to increase awareness for a variety of initiatives, including endangered wildlife and climate change (Fraser et al., 2022; Lenda et al., 2020). It follows that wider, serious societal concerns can also be addressed through internet memes (Zhang & Pinto, 2021). In addition, the use of humorous internet memes proved to be an effective medium for engaging and easily shareable platforms for the intended demographic, namely the younger users of social media. Humour is a key element in the success of the Uttarakhand police’s “Safety on the Roads” campaign. When internet memes contain incongruent components like the use of movie scenes, movie actors/actresses, and cricketers, humour is created (Klien-Thomas, 2021) such as internet meme posts A, B, and D. Due to this, the campaign by Uttarakhand police was able to convey serious road safety messages in a way that was both entertaining and thought-provoking, increasing its exposure (i.e., reach, impressions, engagement) across various social media platforms and leading to increased awareness among young users.
The internet memes used in the Uttarakhand police’s “Safety on the Roads” campaign had impactful visual and verbal aspects, as affirmed by visual experts and respondents. The visual and text aspects of internet memes have not been examined in any previous research related to the police force or department, which sets this study apart from others in the field (Charles & Pal, 2020; Wood, 2020; Wood & McGovern, 2020). Conversely, Ling and Blackburn (2021) on meme virality identified that the visual design and composition of the image used in a meme can both draw viewers’ attention and help a meme become viral. The composition includes the number of panels (single or multiple), the type of images (photo, screenshot, illustration), scale (close-up, medium shot, long shot), and movement (physical, physical and casual, physical, emotional, and causal movement) to capture viewers’ attention. Further, the study by Smirnova et al. (2021) of COVID-19-related internet memes discovered that the visual element is critical to effectively understanding the internet meme. Findings in our study suggest that of the five road safety-related meme posts, the text only meme (post C) received a low score from all of the visual content experts. This suggests that image memes are frequently more succinct than textual memes and, due to their higher information density in the form of visuals, may even be more effective (Ling & Blackburn, 2021). In this study, composition scores were low for two meme posts (posts D and E). For meme post D, one explanation for the low score could be the use of two panels, which take longer to read than a single panel; thus, this could have a negative impact on capturing or retaining readers’ interest. For meme post E, the low score may be because of a lack of movement in a still image meme, and this may be less likely to capture the viewer’s attention (Ling & Blackburn, 2021).
As a result, the visual design of internet meme posts plays an important part in communication, capturing the viewer’s attention and drawing the audience back to the page. The findings suggest that the use of engaging visuals or pictures and enticing content (text or phrases) most likely improved overall message delivery and retention among the users. The effectiveness of the internet memes underscores the need for high design standards in campaign materials. Public sector agencies and government organisations should invest in professional visual design to ensure their messages are clear, attractive, and impactful, as well as provide training and resources to their communication teams on effective visual design principles. This could involve workshops with visual experts or collaboration with design professionals.
Humour is a key finding of this study. Humour was a central element of the meme posts that significantly outperformed non-meme posts in terms of exposure. The significant differences between meme and non-meme posts in reach, impressions, and engagement underscores the effectiveness of this communication strategy. Using humour and relatable content can make important messages more appealing and easier to disseminate. According to similar findings from earlier research, humour is a powerful tool for raising awareness in this era of information overload, particularly in online communities where it can promote a change in behaviour and consciousness and act as a tool for user affiliation and bonding. Conversely, non-meme posts or serious posts perform informative and persuasive functions (Dynel & Poppi, 2021). Similar research revealed that posts that particularly provide comedy and emotional support have a higher chance of being liked, shared, and commented on. However, information-related posts are unpopular with followers (Oviatt & Reich, 2019). Despite information-related posts having lower exposure, providing information to users regarding road traffic safety remains important. Though the Uttarakhand police campaign, which uses an “Internet Meme Strategy” to raise awareness of road safety, has only been active for one year, the response has been overwhelmingly positive. However, it must be noted that the popularity of this campaign is yet to directly impact road user behaviour in terms of preventing crashes. Traffic crash statistics from the State Transport Department, Government of Uttarakhand, India (2024) are equal to or greater than that of the previous year. However, it is not known if there has been a positive impact on unreported crashes related to speeding, drink driving, or red light violations. What is clear is the success of the Uttarakhand police campaign using internet memes to increase awareness among young road users. The strength of the findings supports the recommendation that other police departments and public government organisations could use similar strategies. Additionally, policymakers should consider incorporating social media strategies into their road safety programs.
While the question of whether an online meme communication campaign translates into changed behaviours on the road is outside the scope of this study, we have insights from our findings. Our Facebook followers survey result showed that a significant portion of respondents were more conscious of their driving habits after encountering the campaign meme messages. Further, anecdotal evidence suggests a beneficial influence on driving behaviour. A police officer involved in the campaign reported an observed improvement in traffic safety in an area where the campaign was extensively promoted. The police officer described an incident involving bike stunts by local riders, the police took immediate action, issued a court summons, and created an internet meme of the incident before the rider performed the stunts and after receiving the court summons. There was an observed decrease in risky riding activities. Further evaluations are required to determine if online campaigns have a direct impact on behaviour and reduce crashes, both reportable and non-reportable.
Strengths and limitations
This was the first known study to examine an online communication campaign by police, comparing meme and non-meme posts. By targeting a young cohort, we have demonstrated the value of using humour and social media platforms to reach the target demographic who are typically difficult to reach and engage. Further, the addition of assessments from visual content expertise provides practical guidance on the format and composition of memes that are likely to be noticed by young drivers. The study clearly establishes the value of this style of campaign and provides recommendations for future research to extend the influence among young drivers.
However, there are also limitations. This study relied on self-reported data, which may be influenced by social desirability bias. Moreover, all respondents were followers of the Uttarakhand police department’s Facebook page, which may indicate a pre-existing interest in road safety or positive bias toward meme-based communication. This self-selection limits the generalisability of the findings to the broader population. Additionally, the study used a cross-sectional design and did not employ a pre-post or experimental approach, which means that claims of attitude or behaviour change are based on respondents’ perceptions rather than measured change over time. In addition, future studies can use eye tracking to measure visual attention to internet memes to evaluate which design components draw more visual attention than others (Mishra & Chowdhury, 2023).
Conclusions
The Uttarakhand police’s use of internet memes in their “Safety on the Roads” campaign effectively raised awareness, changed attitudes, and promoted responsible driving behaviours. The campaign’s success underscores the importance of visual and textual design in communication, with internet memes significantly outperforming non-meme posts in exposure (i.e., reach, impressions) and engagement metrics. These findings demonstrate the potential of internet memes as a powerful tool in public safety campaigns, suggesting that similar strategies could be beneficial in other contexts. Internet memes are a powerful communication tool because they are concise, relatable, and humorous. They are also highly shareable and effective as an innovative and practical technique for spreading social awareness across multiple social media platforms by addressing public and societal concerns. Future research should continue to explore the intersection of visual design and message effectiveness to optimise public communication efforts.
Acknowledgements
The author sincerely appreciates all the users who participated in this study. Your invaluable contributions and feedback were crucial in shaping the research and enhancing the quality of our findings. This work would not have been possible without your active involvement and cooperation. We also sincerely thank the Uttarakhand Police Social Media Team for their valuable support in providing access to social media data. Your assistance was instrumental in the success of this research.
AI tools
AI tools were not used in this study nor in the preparation of this paper.
Author contributions
BM: contributed to the study’s conceptualisation, the research methodology’s design, and the survey instruments’ development. Conducted data analysis and interpretation, and drafted the manuscript. SD: Assisted in the design and implementation of the research methodology, played a key role in revising the manuscript, and integrated suggestions for improving the clarity and coherence of the paper.
Funding
The authors did not receive financial support for this article’s research, authorship, and/or publication.
Human Research Ethics Review
The study was approved by the Institutional Ethics Committee, UPES, Dehradun, India (Registration No. EC/NEW/INST/2022/2820). In the study, the participants’ data remained confidential, and informed consent was taken from all participants.
Data availability statement
The authors declare that no materials, data nor protocols were used.
Conflicts of interest
The authors declare that there are no conflicts of interest.