Introduction
Pedestrians are the most vulnerable road users and often overrepresented in fatalities from road crashes (Cantillo et al., 2015; Tiwari et al., 2021; Zannat et al., 2019; WHO, 2023). Pedestrian behaviour, specifically jaywalking, can increase their risk of vehicle-pedestrian collisions (Avinash et al., 2020; Wang et al., 2021). Younger children walking alone to or from school exhibit risky road-crossing behaviours while students walking with peers face a more severe collision risk (Koekemoer et al., 2017).
Globally, the highest number of fatality crashes on the road in 2021 occurred in South-East Asian countries, 17 percent of which involved pedestrians (WHO, 2023). Similar to many South-East Asian countries, Bangladesh faces significant road safety challenges arising from huge numbers of traffic incidents and fatalities. Road Safety Foundation (RSF) reported that in 2022, there were 6,829 traffic incidents in Bangladesh (7,713 fatalities, 12,615 injuries), with the most fatalities recorded in the Dhaka division (n=1,841) (Rahman, 2023). Pedestrians accounted for 21 percent while students accounted for 16 percent (Rahman, 2023) of the total fatalities. However, the actual figures could be higher since the WHO estimated that in 2021, there were 31,578 fatalities from road crashes compared to the officially reported number of fatalities (n=5,084). This discrepancy highlights the tendency of the authorities to underreport road fatalities (WHO, 2023). Using the Bangladesh police-reported MAAP Database (1998-2004), Anjuman and Siddiqui (2007) reported children under 15 made up an average of 21 percent of traffic crash fatalities and comprised approximately 80 percent of pedestrian fatalities on average.
In July 2018, the death of two students in a road crash near their institution in Dhaka city sparked a nationwide movement demanding better road safety (“Reckless Driving Takes Two Young Lives,” 2018). Research evidence has shown that most crashes involving school-aged children occurred near schools, putting children at a higher risk in these areas and middle and high school students were more likely to be involved in crashes (Abdel-Aty et al., 2007). Shankar Saha (2024) reported that road crashes involving children often occur on their way to or from educational institutions. With Dhaka city housing 615 educational establishments, including colleges, junior high schools, and secondary high schools, the highest number in any city in Bangladesh (BANBEIS, 2023), significant attention is needed to improve road safety for school-aged children.
Road user behaviour is a critical factor as in a significant proportion of crashes, the pedestrian was jaywalking (Choi et al., 2013), specifically, crossing a road in a way that disregards traffic regulations (Shiwakoti et al., 2017). According to the Road Transport Act (n.d.), pedestrians are legally required to use designated crossing facilities where available (e.g., zebra crossings, foot overbridges, underpasses etc.) and failure to comply is considered an offence.
However, in Dhaka city, inadequate road infrastructure and poor traffic management influence the number of jaywalkers at road sections (Ali et al., 2023; Hamidun et al., 2021) including around the numerous educational institutions in the city. Despite the frequency of this crash type, there is no comprehensive research to identify the factors that encourage jaywalking among the student population in Bangladesh. Therefore, this study was conducted to explore the factors that may be contributing to fatality crashes involving students in Dhaka city in Bangladesh.
Existing literature examined factors influencing pedestrians’ risky crossing decisions including vehicle speed, gap judgment, road lanes, waiting time, crossing point, crosswalk location, platoon size, and destination (Connely et al., 1998; Avinash et al., 2020; Shaaban et al., 2018; Wang et al., 2021). Wang et al. (2021) analysed the pedestrians’ behaviour in China and reported jaywalking was significantly influenced by crosswalk locations and sidewalk length. In Downtown Doha, Qatar, Shaaban et al. (2018) found that pedestrians in groups waited longer to cross roads than people who waited alone, with larger groups exhibiting even longer wait times. Cantillo et al. (2015) explored factors such as motivations, pedestrian preferences and perceptions, and safety/security of crossing facilities while studying pedestrians’ road crossing choices.
However, for pedestrians aged 11 to 18 years (student-aged), factors like pedestrian infrastructure, school route safety and parental supervision are crucial. Studies have highlighted children’s road crossing behaviours in the context of both lower and higher income countries. Studies of children have reported that distance gap thresholds remained consistent regardless of the approaching vehicle’s speeds, and young children may lack the perceptual and cognitive abilities needed to make these judgments effectively (Connelly et al., 1998). There is also a gender factor with boys encouraged to behave independently and recklessly in risky situations whereas girls are taught to act cautiously (Schwebel & Barton, 2005). Children with lower thrill-seeking behaviour were less likely to cross the road unsafely or play on the road (Sullman et al., 2012). Observations at pedestrian crossing at unsignalised mid-blocks in Beijing, China, suggest children’s behaviours were significantly influenced by adults, and they showed dependency on parents (Li et al., 2013) while in Cape Town in South Africa, children with higher safety knowledge had more severe collisions, likely to be associated with negligent behaviour (Koekemoer et al., 2017).
The Safe Routes to School (SRTS) programs aim to enhance the safety of students’ travel routes and specifically against jaywalking (San Francisco Safe Routes to School, n.d.). However, there is a lack of rigorous evaluations of such programs, which are needed to better understand their effectiveness in improving safety and promoting walking and cycling (Weigand, 2008). Larouche et al. (2018) did a systematic review of interventions aimed at increasing Active School Transport (AST) among children and adolescents and highlighted the quality of most studies was weak due to methodological limitations and insufficient follow-up and recommended exploration of factors influencing travel behaviour to enhance future interventions.
Studies conducted in Bangladesh have investigated how pedestrians’ experiences and environmental factors influence road crossing behaviour (Debnath et al., 2021), the relationship between inadequate pedestrian facilities and lower perceived Pedestrian Level of Service (PLOS) (Zannat et al., 2019) and development of a school zone road safety risk rating (Bari et al., 2019). Although pedestrian research in Bangladesh is limited, the current knowledge indicates that student-aged pedestrians perceive risk differently and may lack the perceptual and cognitive abilities to make these decisions effectively. Parenting and supervision significantly influence these behaviours and may be affected by parents’ socio-demographics, which previous research has not thoroughly examined. This study aims to fill this gap by analysing the potential impact of various underexplored factors, including parental socio-demographics, traffic awareness, safety knowledge, parental supervision, travel habits, and crash history, alongside road infrastructure and demographics, on an adolescent student’s jaywalking decision-making process. Addressing these targeted interventions will be crucial for developing Safe Routes to School (SRTS) programs for Dhaka City.
Method
This study was conducted in Dhaka City, Bangladesh using a physical questionnaire survey to investigate adolescent students’ jaywalking decision-making process. Data were also collected in a field observational study to depict the real on-field scenario but was not used for analysis.
Sample and Recruitment
The samples for analysis were collected from Dhaka city, the target study area. Considering a 90 percent confidence interval, a 5 percent marginal error, and a 50 percent portion of the student population of 2,377,178 (BANBEIS, 2023) in Dhaka, the resultant sample population was 273 students.
Recruitment of students was based on education institutions based in five areas in Dhaka city. These areas were chosen based on land use (e.g., residential, commercial, mixed-use), real estate costs and road infrastructure conditions (e.g., footpath, road crossing infrastructure, etc.) (Table 1).
Inclusion criteria for educational institutions were: the three main teaching mediums in Bangladesh (English Medium, English Version, and Bangla Medium), morning and day class shifts, and the presence of nearby legal crossings (overpasses, underpasses, zebra crossings, intersection crossings (signalised and unsignalised), etc.). Based on these criteria, schools were shortlisted, and 13 educational institutions were randomly selected. From these schools, 273 randomly selected students from grades 6 to 12 participated in the survey. Gender equality among boys and girls was considered, with surveys conducted outside school premises after school hours.
Field Observational Study
The survey was preceded by a field observational study conducted within an approximate 25m radius of the nearest pedestrian crossing of five randomly selected schools and colleges from the shortlisted educational institutions in five locations (Table 1). Observations were conducted in each location continuously across 30 minutes by one observer (positioned within the specified radius of the nearest pedestrian crossing at each location), who received extensive training in identifying jaywalking behaviours. The observer counted the number of all male and female adolescent student pedestrians both jaywalking and not jaywalking. Observations varied to align with the educational institution operating hours (morning shift with school hours ending at 12:30pm, observations: 12:30-1pm; day-shift with school hours ending at 4:30pm, observations: 4:30-5pm).
The field observational study captured instances of jaywalking, including crossing at midblock, crossing the roads by avoiding traffic personnel assistance and avoiding the use of designated pedestrian crossings (e.g., zebra crossings, overpasses, at grade median openings). The results provide an important context for the five locations but are not directly related to the survey results (Table 2).
Questionnaire Survey
The questionnaire survey was developed iteratively. Initial questions were drafted based on literature reviews and local observations during field visits, followed by a focused group discussion with a small representative sample to refine the questions for clarity and relevance. The final questionnaire included 59 questions across seven sections: respondent demographics, individual characteristics, guardians’ socioeconomic status, traffic awareness, travel habits, collision history, and use of road crossing options. Factors affecting jaywalking behaviour were obtained from the questionnaire.
Although the questionnaire was prepared in English, respondents were briefed in both English and Bangla to ensure understanding, especially regarding jaywalking, which was defined with examples. While all students may not walk to school nor cross the road, their perceptions were included in the survey because they regularly navigate the same road infrastructure. Thus, understanding their experiences and views further strengthens the comprehensive picture of crossing behaviour and safety concerns in such zones. Care was taken to ensure that students’ responses were not influenced by guardians or peers. Ethical considerations, including participant confidentiality and informed consent, were maintained.
Analyses
In road safety studies, logistic regression models are widely used (Tay et al., 2008; Valent et al., 2002) and are conventional for classifying multiple explanatory variables (Hosmer et al., 2013). The questionnaire survey data were pre-processed to eliminate discrepancies, outliers, and irrelevant entries. The resulting dataset was deployed in a mixed-model approach using three statistical models—logistic regression (fixed and random coefficient) models and Bayesian belief network (BBN)— to understand jaywalking behaviour. The dependent variable was jaywalking (Yes/No). Various factors/independent variables affecting jaywalking were retained through iterations of the logistic regression models and analysed in terms of fixed and random coefficients. These models examined the fixed and individual or category-specific variability among respondents. Identifying new significant variables from the random coefficient model provided insights beyond the fixed coefficient model.
While the regression model focuses on a single dependent variable against multiple independent variables, BBN determines an optimal connection pattern in a network to forecast the target variable, implying that a change in any variable can influence the probabilities of all other connected variables. In developing the BBN, significant variables from fixed and random coefficient models were used as the primary nodes, which further validated the findings from the regression models. Through multiple iterations, the BBN was refined, and these factors, along with others, captured the complexity of correlations and interdependencies among factors affecting the jaywalking tendency.
Logistic regression model (fixed and random coefficient)
Logistic regression models are described with odds ratio (OR), which in this study explains the relationship between independent variables and the dependent variable (jaywalking). It expresses the ratio of event occurrence odds in one group or category relative to another. An increase in independent variables by one-unit changes the odds, as explained by the OR. If the OR is greater than 1, the odds of the event occurring increase; if the OR is less than 1, the odds decrease. The odds, O is expressed in equation 1, where P stands for probability.
O=P1−P
In the fixed coefficient model, the coefficient, establishes a constant relationship between the dependent variable, X, and multiple predictor/independent variables, Y obtained from the questionnaire. The model is expressed in equation 2.
Y=logit (P)=ln(P1−P)=βX
However, in the random coefficient model, the model coefficient varies and is examined in terms of individual or category-specific variability. This approach provides more flexibility and can reveal insights that fixed coefficient models may overlook (Schunck, 2013). This can potentially highlight new significant variables and offer a more in-depth analysis. The study analysed the fixed coefficient model using STATA 15 software, and the random coefficient model was analysed using R-Studio software.
Bayesian belief network (BBN)
This machine learning tool uses conditional probability to describe itself, which in this study explains the cause-effect relationship between jaywalking behaviour (target node) and the factors affecting it (such as traffic condition, mode of travel, etc.) and their interdependencies. This causality framework is visually represented through a directed acyclic graph (DAG) and a conditional probability table (CPT). The DAG structure includes nodes representing the various variables and arrows indicating conditional probabilities, with parent nodes having outgoing edges that provide conditional probabilities affecting connected child/descendant nodes and child/descendant nodes having incoming edges from parent nodes with their probability distributions determined by these parent nodes and described in a CPT. Here, the significant variables obtained from fixed and random coefficient models were chosen as the primary nodes for iteration. The following equation 3 represents the foundation of the Bayesian network.
P(A|B)=P(B|A) P(A)P(B)
P(A) and P(B) are the probabilities of events A and B, respectively, while P(B|A) and P(A|B) are the conditional probabilities of B given A and A given B, respectively. These probabilities are obtained from the BBN and are organised in a conditional probability table (CPT) (Table 6). The casual Bayesian network’s capacity to account for cause-effect relationships provides a better explanatory framework.
The model was run on the academic version of GeNIe 3.0. It used the Peter-Clark (PC) method to learn the structure and the built-in expectation maximisation (EM) to learn the parameter. The significant variables obtained from the BBN are then analysed to study the jaywalking behaviour of the target group.
Results
Fixed coefficient logistic regression model
After running the pre-processed data in STATA 15, the study retained significant variables in the fixed coefficient model. The descriptive statistics of the retained variables from the models are presented in Table 3.
After more than 325 iterations, the model retained 16 significant variables based on their p-value (significant variables, P<0.05 and marginally significant variables, P<0.1) from 14 questions (43 variables) (Table 4). These variables were also checked for correlation, all of which had a low correlation (less than 0.5). The questionnaire sections, namely respondent’s particulars, travel characteristics, and walking behaviour, significantly affected the dependent variable. In contrast, crash history and demographic characteristics did not show significant influence.
The fixed coefficient model was statistically significant χ2 (df=16, N=273) =124.62, P<0.1. The model explained 49.6 percent (Nagelkerke R2) of the variance in jaywalking behaviour and correctly classified 78.4 percent of cases.
The significant variables included adolescent student behaviours. Jaywalkers were 3.49 times as likely to be students from classes 6-8 as non-jaywalkers (OR=3.49, 95%CI [1.36, 8.99]). While students from classes 9-10 were 3.01 times likelier to jaywalk than their peers in other classes (OR=3.01, 95%CI [1.2,7.54]). Length of time students had lived in Dhaka was also significant with jaywalkers who had lived in Dhaka for 5-10 years, 2.56 times more likely to jaywalk than students who had lived in Dhaka for less than 5 years or more than 10 years (OR=2.56, 95%CI [1.1,5.98]). Jaywalkers were 2.83 times more likely to jaywalk if they observed others jaywalking (OR=2.83, 95%CI [1.40,5.70]). Specific road features also increased the likelihood of jaywalking, which include: no safety of the overpass (OR=2.86, 95%CI [1.43,5.74]), bad condition of the footpath (OR=1.53, 95% CI [1.00,2.34]) and using distraction while crossing the road (OR=2.17, 95%CI [1.41,3.33]).
However, several factors decreased jaywalking. Students aiming to reach school “just in time” were 0.45 times less likely to jaywalk compared to students who arrived early (OR=0.45, 95%CI [0.21,0.95]). Similarly, students exposed to traffic during the evening were 0.4 times less likely to jaywalk than students at other times (OR=0.40, 95%CI [0.19,0.84]). Students whose mothers were businesswomen showed less jaywalking behaviour than those employed in service, teaching, homemaking, and other occupations (OR=0.14, 95%CI [0.04, 0.55]). Other factors that decreased the likelihood of jaywalking included: travel modes of “walk only” (OR=0.41, 95%CI [0.14,1.2]) or “rickshaw” (OR=0.32, 95%CI [0.13,0.78]), traffic condition of the road (OR=0.56, 95%CI [0.28,1.08]), and willingness to learn about traffic safety (OR=0.28, 95%CI [0.14, 0.57]).
Factors that did not affect the likelihood of jaywalking behaviour included: impulsive character, gender, the presence of law enforcers, traffic signs, and accompanying people.
Random coefficient logistic regression model
The same data set was run in the R-Studio for the random coefficient model, keeping the significant variables from the fixed coefficient model as the model’s primary input. After more than 475 iterations, 10 significant variables (P<0.05 and P<0.1) were obtained that had a low correlation (value less than 0.5). These variables are from the same 14 questions included in the fixed coefficient model. However, there were 6 new variables, namely using distraction while crossing (rarely and frequently), travel mode (private car and four-stroke three-wheelers), school zone (residential) and footpath condition (poor). While the model was also tested for category-specific variability, it was only effective for individual-specific variability (Table 5).
The random coefficient model was also statistically significant, χ2 (df=13, N=273) =107.83, P<0.1. The model explained 44.1 percent (Nagelkerke R2) of the variance in jaywalking behaviour and correctly classified 77.3 percent of cases.
In Table 5, the random coefficient model suggested that jaywalkers were 2.60 times as likely to jaywalk if they observed others jaywalking compared to non-jaywalkers (OR=2.60, 95%CI [1.37,4.93]), which is similar to the result in the fixed coefficient model (OR=2.83, 95%CI [1.40,5.70]). While in the random coefficient model, for the variable footpath condition (poor, moderate, good), “poor” was significant (OR= 2.49, 95%CI [0.23,4.92]), these categories were not significant in the fixed coefficient model. However, it was significant for binary categories (good or not) (OR=1.53, 95%CI [1.00,2.34]). Here, footpath condition refers to the physical condition, such as the presence of potholes, smoothness, walkability, etc. Again, in the random coefficient model, the variable “using distraction while crossing” (never, rarely, always, frequently), “frequently” (OR=4.64, 95%CI [1.72,12.52]) was significant. In the fixed coefficient model, these four categories were not significant, whereas, for binary categories (yes or no) (OR = 2.17, 95% CI [1.40, 3.33]), they were significant.
Interestingly, in the random coefficient model, “travel mode” was significant as travelling by private car increased the likelihood of jaywalking by 3.52 times (OR=3.52, 95% CI [1.81,6.86]) and by four-stroke three-wheeler 3.10 times (OR=3.10, 95% CI [0.83,11.59]) whereas the fixed coefficient model revealed that travel modes such as walking and rickshaws decreased the jaywalking likelihood. Similarly, factors including school location in different zones (significant category: residential, OR=2.92, 95% CI [0.33,6.15]) and residency in Dhaka (significant category: 5-10 years, OR=3.65, 95% CI [0.52,7.97]) increased jaywalking behaviour in the random coefficient model.
Conversely, in the same model, independent variables including mother of occupation (businesswoman) (OR=0.25, 95% CI [0.07,0.90]), willingness to learn about traffic safety (OR=0.33, 95% CI 0.18,0.61]), and encroachment of footpaths (OR=0.49, 95% CI 0.21,1.18]) decreased the jaywalking likelihood, similar to the fixed coefficient model.
Bayesian belief network
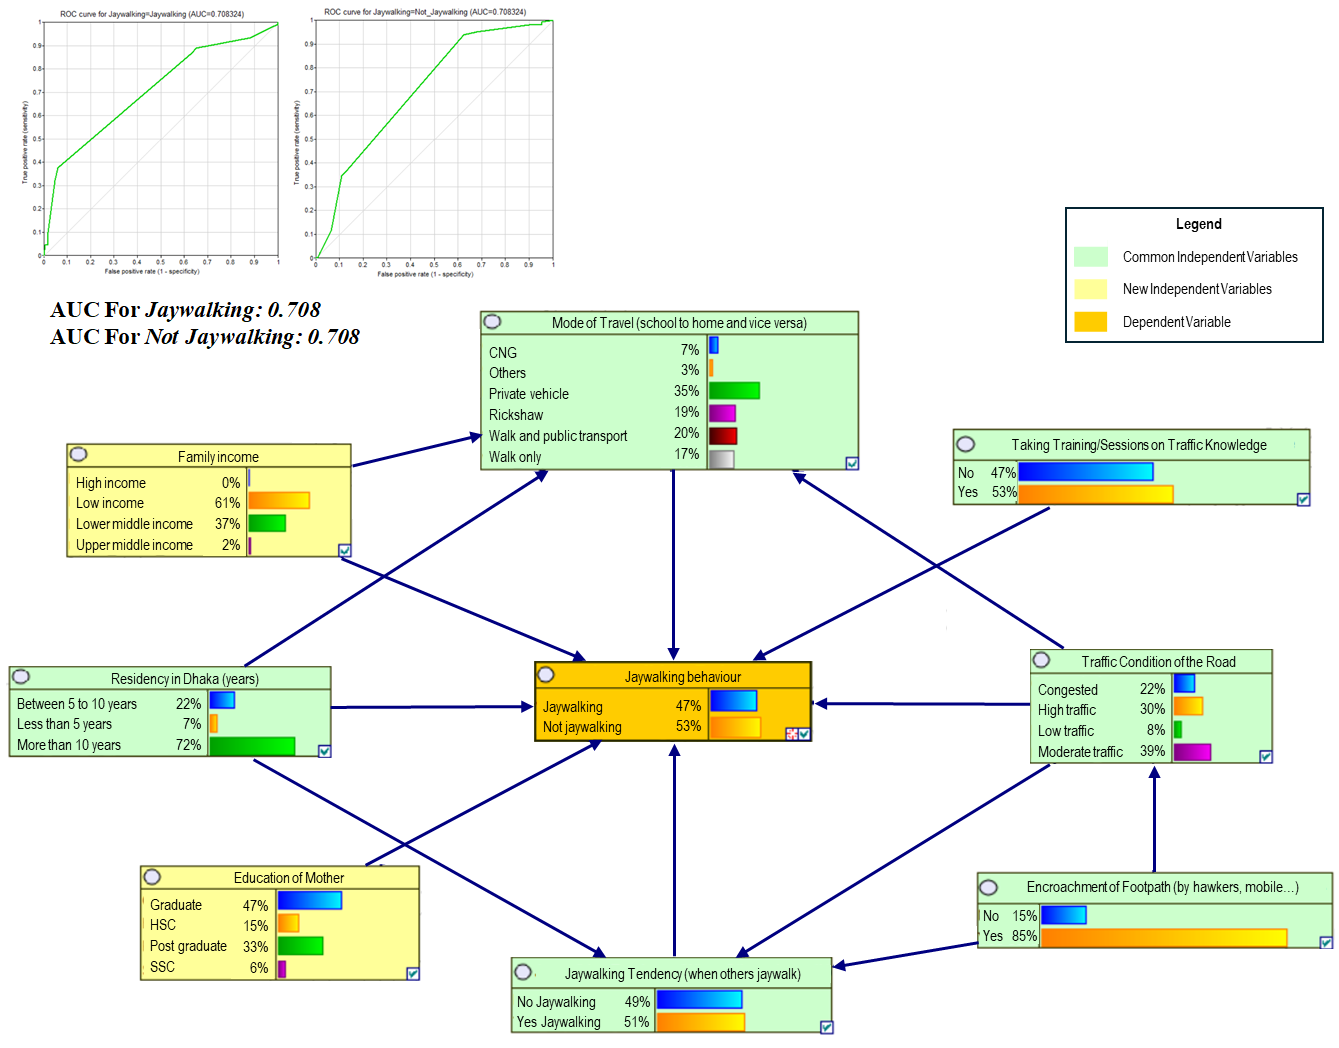
The model was iterated over 735 times, during which the study identified eight sensitive variables, including two new variables (“family income”, “education of mother”) which were not significant in either of the logistic regression models (Figure 1). The remaining six common independent variables were significant in either the fixed or the random coefficient model or both.
.png)
In the BBN network (Figure 1), “jaywalking behaviour”, the target node is the child/descendant node to several parent nodes: education of mother, travel mode, family income, residency in Dhaka, the jaywalking tendency (when others jaywalk), road traffic condition, and willingness to take traffic training sessions. “Road traffic condition” was identified as the parent node to travel mode, jaywalking behaviour, and jaywalking tendency (when others jaywalk). Similarly, “residency in Dhaka” is a parent node to travel mode, jaywalking tendency, and jaywalking behaviour. Although “Footpath encroachment” (illegal occupancy of the footpath by various mobile shops, businesses, and other establishments), as a parent node, influences road traffic conditions and jaywalking tendency, it does not directly affect jaywalking behaviour. Finally, “family income” is a parent node for travel mode and jaywalking behaviour.
Model Validation
Model validation accurately represents the application’s functionality within the model. The receiver operating characteristic (ROC) curve visually represents various cut points and their corresponding sensitivity versus the false positive rate (1-specificity), which showcases the advantages of a particular predictor or predictive model, enabling the identification of multiple cut points for diverse applications depending on the associated “cost” of misclassification. The area under the curve (AUC) compares predictive modes (two or more) and gauges the predictor’s efficiency. The area under the curve (AUC) for jaywalking and not jaywalking within the jaywalking behaviour group derived from the receiver operating characteristic (ROC) curve were both 0.708 (approaching 1). This suggests that the model demonstrates efficacy in its predictive performance.
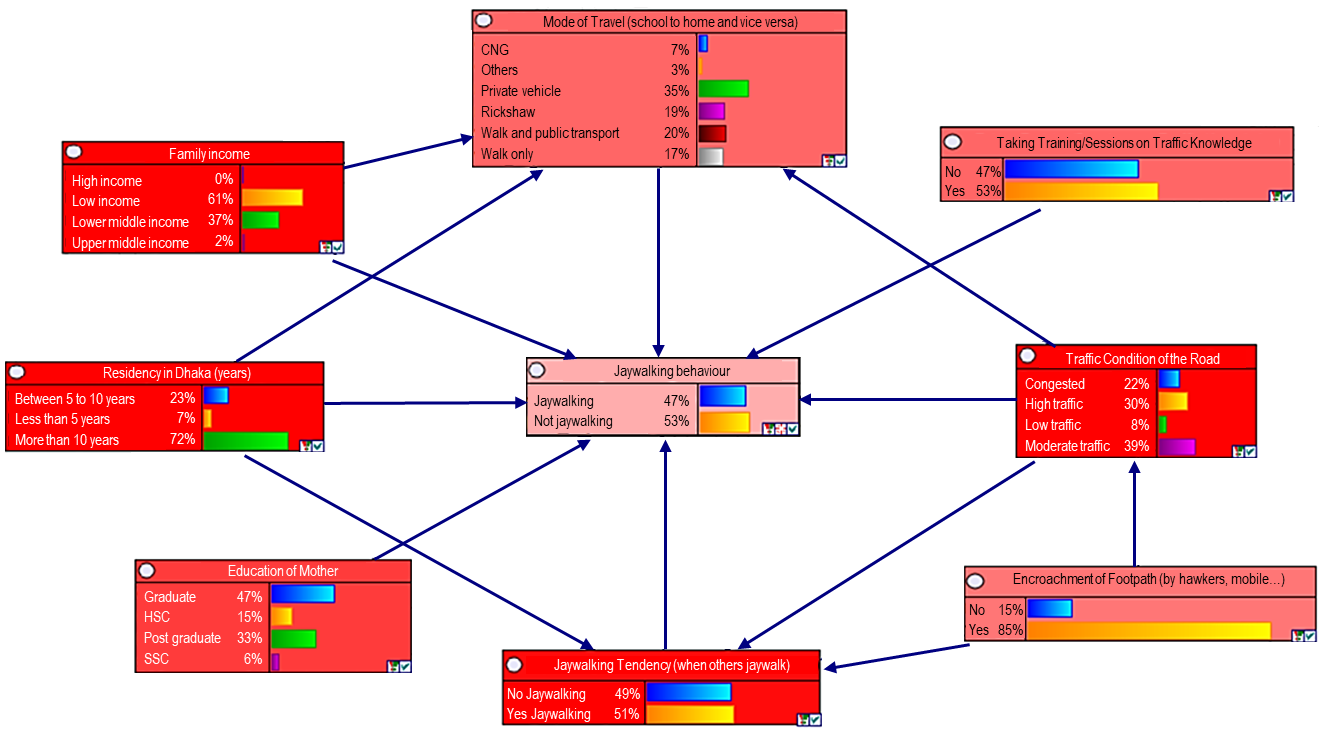
Sensitivity Analysis
The model was also validated through sensitivity analysis (Figure 2). The most sensitive variables are represented with darker shades of red, indicating the highest impact, and the grey or lighter shades of red denote a lower impact on the target node. The most sensitive variables were family income, residency in Dhaka, jaywalking tendency (when others jaywalk), and traffic condition, followed by the mother’s education, travel mode, willingness to learn traffic, and footpath encroachment.
.png)
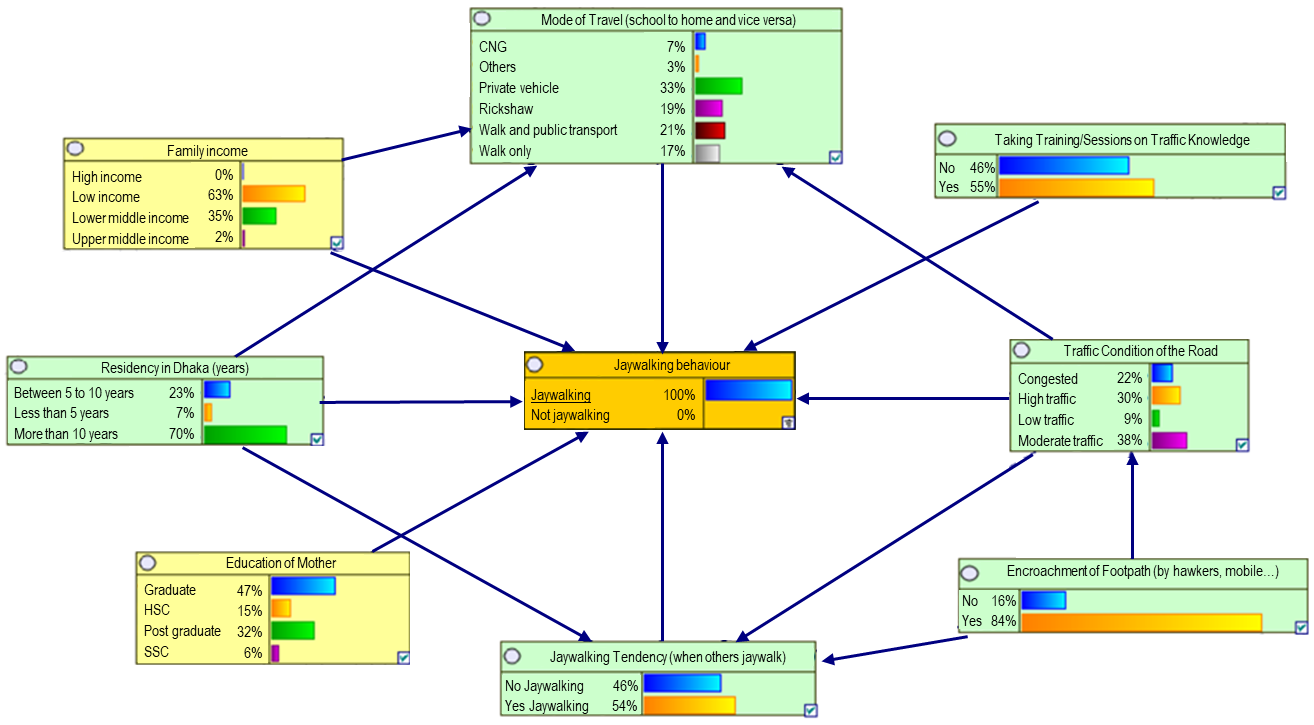
BBN Analysis
The sensitive variables were analysed by setting ‘Jaywalking’ as evidence in the jaywalking behaviour node (Figure 3). The student who jaywalked had a 63 percent marginal probability of coming from a family background with low income, while 35 percent of the students came from a lower middle-income family. In a similar setting, the marginal probability of a jaywalking student living in Dhaka for more than 10 years was 70 percent whereas for the rest of the students either living in Dhaka for 5-10 years (23%) or less than 5 years (7%). Similarly, there was also a 55 percent marginal probability regarding willingness to learn about traffic safety, 84 percent marginal probability for road encroachment and 9 percent marginal probability for low traffic condition.
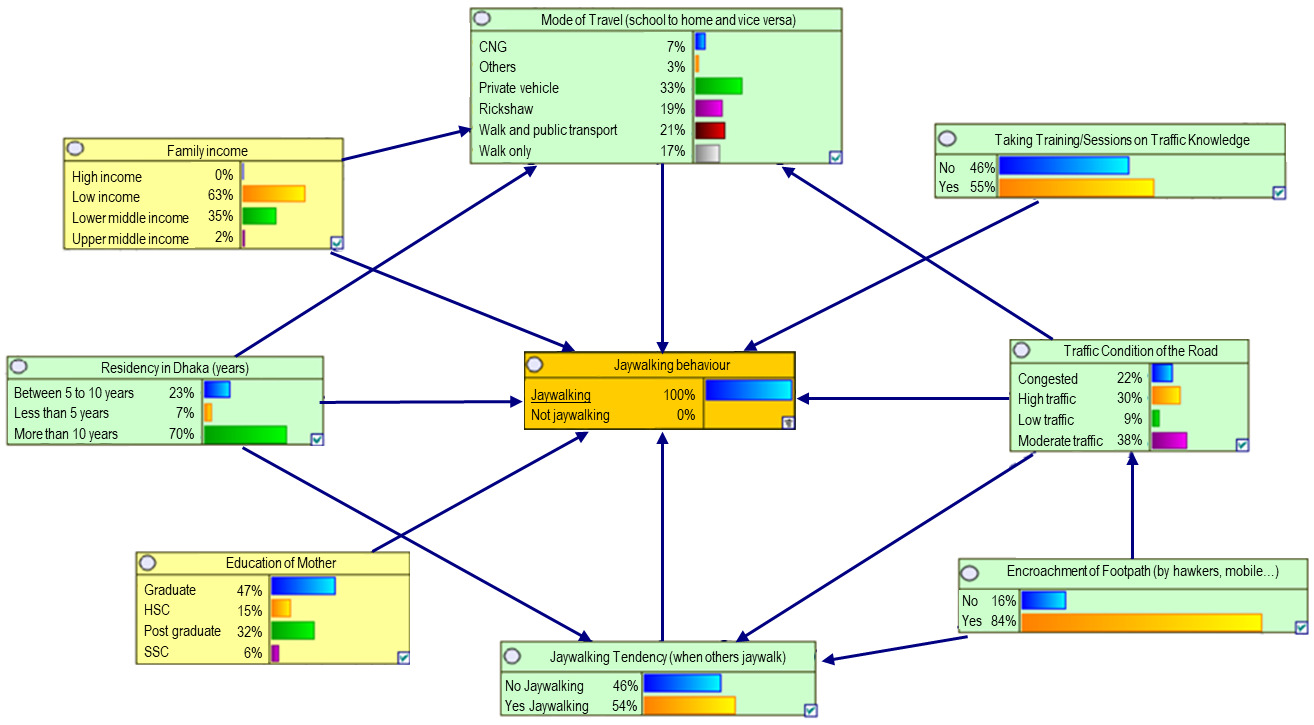
Table 6 represents the marginal probability changes in all nodes when the evidence at the “Jaywalking Behaviour” node is set to “Jaywalking” and “Not Jaywalking”, respectively. When the evidence shifts from “Jaywalking” to “Not Jaywalking”, the marginal probability of students coming from a lower middle-income family increased (35% to 38%), whereas there was a decrease among students from low-income families (63% to 59%). Likewise, marginal probability changes were observed for the variables: mother’s education, willingness to learn about traffic safety, residency in Dhaka, jaywalking tendency (when others jaywalk), footpath encroachment, and traffic conditions.
Discussion
The advanced statistical analysis used in this study adds a nuanced understanding to the jaywalking behaviour of adolescent students in Dhaka City, Bangladesh. The findings of some significant variables identified in the logistic regression models and the Bayesian Belief Network (BBN) highlight common variables such as jaywalking tendency (when others jaywalk) and footpath encroachment. However, some variables captured different views in the logistic regression models, such as willingness to learn about traffic safety. Not all categories under a variable provided the same findings, with new categories of variables- road traffic conditions, mode of travel, and residency in Dhaka—found sensitive in BBN. The BBN also identified two new sensitive variables: family income and mother’s education.
Students from comparatively higher-income settings are less prone to jaywalking compared to students from low-income settings. The former group may be more aware of jaywalking-induced risks, likely due to better access to resources and information. Many parents and caregivers report being too busy to accompany their children to and from school, especially in low-income settings, perhaps due to work obligations (Porter et al., 2010). This could be because low-income families, facing financial pressures that require longer work hours, may view jaywalking as a necessary risk driven by practical needs.
Travel mode was also an important factor. As per BBN analysis, the probability of jaywalking by students travelling via personal motorised modes of transport (e.g., four-stroke three-wheeler and private vehicles) decreased, and the marginal probabilities of using rickshaws, public transport, and walking increased. This indicates that students using motorised transport tended to jaywalk less. This finding aligns with earlier research that reported children who spent more time walking were more likely to engage in riskier behaviour (Koekemoer et al., 2017). Being accompanied by guardians on motorised transport could contribute to heightened awareness of traffic rules and safety measures, thereby reducing jaywalking. The structured nature of motorised transport, such as designated pick-up and drop-off points, may reduce the urgency for jaywalking. However, findings from the fixed coefficient logistics regression model challenged that view. There was a lower odds of jaywalking by students who “walk only” and use “rickshaws” according to this model. For students who walk, this may be due to being more familiar with crossing safely on their routine routes. For students commuting by rickshaws, their flexibility in choosing drop-off points likely reduces students’ need to jaywalk, as rickshaws can drop students directly at the school entrance. This flexibility may contribute to the lower odds of jaywalking among rickshaw users.
In the BBN, when the evidence was changed from “Not Jaywalking” to Jaywalking", the marginal probability of students wanting to take traffic training increased. This may be because children who undergo pedestrian safety training and acquire knowledge may not change their behaviour. This is consistent with previous research that reported while systematic and consistent traffic training significantly reduces collision risk, it does not unequivocally ensure road safety (Corbett & Morrongiello, 2017). Further, results from the logistic regression models constructed in this study suggested jaywalking may also be influenced by cultural differences in communities, regional social norms, and social desirability bias evident among students of different ages and genders.
The study also analysed the impact of self-reported traffic densities, where findings from the BBN network revealed that moderate traffic conditions decreased jaywalking. At the same time, this behaviour increased in low traffic (Table 6). A possible reason could be a higher perceived risk during moderate traffic conditions and a lower risk during low traffic conditions as suggested in previous research that reported pedestrians were less likely to jaywalk during higher traffic densities (Wang et al., 2021).
Footpath encroachment decreased the likelihood of illegal road crossings. Footpath encroachments reduce the space available to pedestrians. Permanent or temporary structures as well as roadside pedestrian safety railings can limit student access. A study in Dhaka City reported that that pedestrians did not use grade separated infrastructure (i.e., overpasses or underpasses) to cross roads because of the presence of beggars and hawkers at the entrances (Pasha et al., 2015).
The study observed social norms of road crossing behaviours of the bystander effect where the presence of others diminishes personal responsibility, leading to a diffusion of accountability and potentially increasing jaywalking. Student jaywalking increased when they saw other people jaywalking and decreased when the crowd did not jaywalk. Studies have reported peer-pressure among children with older children more inclined to risky road behaviours than younger children (Peden et al., 2008)
An unexpected finding was that students whose mothers had completed post-graduate education were less inclined to jaywalking. A possible explanation may be that higher education often correlates to better socioeconomic conditions and a stronger emphasis on education. Thus, providing a better role model for adolescent students helps channel a better perception of safety. A previous study also found a correlation between lower maternal education levels and poor road crossing behaviours (Tiwari et al., 2021). However, this factor was not statistically significant perhaps because of social bias, self-reporting bias and differences in cultural norms and societal values.
A common finding from the analysis of all the models suggest that students who had lived in Dhaka for a moderate duration (between five and ten years) were more inclined to jaywalk. This pattern likely arises from an inflated sense of confidence which in return drives a false perception of expertise about the local traffic conditions. Debnath et al. (2021) found that overconfidence can cause pedestrians to underestimate their limitations, leading to poor decision-making on the road and an increased likelihood of involvement in a crash. A finding from the BBN analysis was that the student cohort with less than ten years of residency was more inclined to jaywalk while the student cohort with long-term residency (above 10 years) was less inclined to jaywalk, suggesting that extensive experience about the local road conditions makes them more aware of the inherent risks associated to jaywalking. This may be because extended residency increases familiarity and improves navigation expertise and awareness of traffic-related information.
Factors like distraction while crossing roads, safety of overpasses, condition of footpaths, zone of educational institutions (e.g., commercial zone, residential zone, etc.), and occupation of mother, which were significant in both the fixed and random coefficient models, were not found to be sensitive in the BBN. This discrepancy can be attributed to BBN’s probabilistic approach that considers conditional dependencies, where a factor’s influence might vary if its effect is indirectly captured through other variables. Nevertheless, various research highlights the importance of these non-sensitive factors. For instance, Gitelman et al. (2019) found that impaired judgement from lower risk perception due to distractions like using a mobile phone can induce unlawful crossing. Another study found that accessibility, comfort, and attractiveness of roadways significantly impact pedestrians’ perceived safety on footpaths (Zannat et al., 2019). Similarly, studies by Pasha et al. (2015) and Cantillo et al. (2015) found that security issues of overpasses (i.e., mugging, pickpocketing, hijacking, etc.) affected crossing behaviour.
Study strengths and limitations
The mixed methods approach to understanding adolescent students’ behaviour as pedestrians as key strength of this study. Surveyors’ rigorous training and field observations of students’ jaywalking behaviours was a valuable method to reduce potential sampling bias in the self-reported data. To ensure data reliability from the field observation, the observer received extensive training to promptly identify jaywalking behaviours, maintain objectivity while minimising confirmation and recall biases. Selection bias was addressed in the sampling frame by accounting for socioeconomic, infrastructural, and land use zoning factors in the choice of educational institutions Additionally, the selected areas represent different land use types and diverse road infrastructure conditions.
This study also has limitations, such as a minimal sample size and self-reporting bias of the questionnaire survey. A larger sample size would improve representation of students in countries like Bangladesh. Unfortunately, no specific census data is available depicting the composition of education and income level of adolescent students’ parents, nor is there any area-based income data currently available for Dhaka, Bangladesh. Hence, in future studies, the results from the analysis of socio-economic factors can be compared with the census data, if available. This research could be expanded by integrating video data of student jaywalking in conjunction with the self-reported survey to consider the surrounding traffic environment (e.g., traffic density, condition of infrastructure).
Conclusion
This study provides insights into the complex interplay of factors influencing the jaywalking behaviour of adolescent students in Dhaka city. Findings in the BBN suggest that students from a low-income background who used cheaper and more flexible travel modes (e.g., rickshaw, public transport and walking) and lived in Dhaka for up to 10 years were less motivated to use road crossing facilities. In addition, students with lower traffic density on their travel routes were more inclined to jaywalk. Moreover, there was a strong association between the mother’s education level and jaywalking behaviour, as higher maternal academic achievement was correlated with lower jaywalking. Further, students from a lower-middle income and above backgrounds, who used motorised transport modes like sedans and four-stroke three-wheelers, and had lived in Dhaka for 10 years or more, were more inclined to use legal road crossings. Fellow pedestrians’ jaywalking behaviour also influenced students, as lawful crossing practices among other pedestrians lowered jaywalking among students. It is also crucial to recognise that footpath conditions, overpass safety, being distracted (e.g., mobile phone use), traffic exposures, and location of educational institutions affected the tendency to jaywalk. The respondent’s crash history did not influence jaywalking, however, demographic characteristics had an impact.
Overall, this research provides insights for regulatory authorities and planners to develop student safety intervention strategies. Although road safety and first aid training are included in the school curriculum of Bangladesh, incorporating a road safety field development plan for parents and children by utilising our findings would be beneficial. Findings from this study suggest that actions could include: peer-to-peer learning program that encourages mentorship from older students on road safety; and creating Safe Route to School (SRTS) programs in Dhaka city. Local authorities, schools, NGOs, and community members can incorporate factors like modes of travel, footpath conditions, and traffic conditions to create these programs. Successful SRTS programs in Coconino County, Arizona (Kinsey Elementary), Boulder, Colorado (Foothill Elementary), and Indianapolis, Indiana (St. Thomas Aquinas School), among others in the US (National Center for Safe Routes to School, n.d.), can serve as inspirations. Additionally, imposing transport restrictions, speed limits, and speed-bumps in school zones can act as a calming factor for students. Optimising signalling times and providing child-friendly pedestrian infrastructure with improved footpath conditions, dedicated cycling lanes, and encroachment-free walking conditions throughout school zones can reduce jaywalking and promote walking and cycling to school.
Author contributions
Aditya Basunia: study conception, methodology development, development and execution of the fixed coefficient model and Bayesian belief network, primary manuscript draft, result interpretation, and critical revisions for intellectual content. Tanzim Hossain Anchal: dataset preparation, data analysis, development of the fixed coefficient and Bayesian belief network, and manuscript draft revisions. Jemima Tasnim: development of the random coefficient model, result interpretation, and development of comparative studies. Niaz Ahmed: methodology development and preparation of critical revisions for intellectual contents. Tanzila Zannat Mahzabeen: dataset development and development of the fixed-coefficient logistic regression model. Shakil Mohammad Rifaat: study conception, methodology design, and critical revisions for intellectual contents. All authors have read and agreed to the published version of the manuscript.
Funding
This research did not receive any specific grants from funding agencies in the public, commercial, or not-for-profit sectors.
Human Research Ethics Review
The study protocols were discussed and approved by the CEE undergraduate thesis committee with the identification code of 2023-B3G2.
Data availability statement
All materials, data, and protocols associated with the publication of this manuscript are available upon request. Details of the dataset can be shared upon request.
Conflicts of interest
The authors declare that there are no conflicts of interest.