Introduction
Trams, also known as streetcars, constitute a vital part of the public transport systems in many cities like Zurich, Berlin, Vienna, Prague, Toronto and Melbourne. Tram systems can help reduce traffic congestion with positive effects for mitigating the effects of the climate emergency (Aftabuzzaman et al., 2010; IPCC, 2023) as well as overall traffic crashes by reducing car traffic (Truong & Currie, 2019). However, trams often operate in mixed traffic and frequently interact with motorists, pedestrians and cyclists, which can lead to frequent and sometimes severe tram-related crashes (Cameron et al., 2001; Phan et al., 2022). Most tram crashes involve vehicles due to the operation of trams within mixed-traffic environments (Mitra et al., 2010). For example, in the United States of America (US), about 76 percent of tram collisions between 2002 and 2017 were between trams and motor vehicles (Ziedan & Brakewood, 2020). In Switzerland, tram-vehicle collisions account for approximately 65 percent of all tram-related crashes, according to data from 2010 to 2013 (Marti et al., 2016). In Italy, tram-vehicle crashes represent nearly 72 percent of tram-related crashes in 2016 (Guerrieri, 2018).
The interaction between trams and pedestrians is another safety concern, as pedestrians represent the largest group of vulnerable road users involved in tram crashes. In Melbourne, for example, 82 percent of tram-related incidents (37 out of 45) in the vicinity of tram stops involved a pedestrian, highlighting the high-risk environment created by the concentration of pedestrian movements and tram operations (Currie & Reynolds, 2010). A study by Mitra et al. (2010) found that around 42 percent of tram-related injuries in Melbourne were due to tram-pedestrian collisions. Similar percentages were observed in European cities, where pedestrians were involved in about 30 percent of tram crashes (Lackner et al., 2022). In a study from the US by Ziedan and Brakewood (2020), the proportion of tram-pedestrian collisions was lower (19%). These figures indicate that pedestrian-tram crashes are a widespread safety issue across different countries although the magnitude varies in different urban contexts.
Travelling near tram tracks is challenging for bicyclists with issues such as track skidding and track wedging; consequently, tram tracks are often cited as a significant risk factor for bicycle crashes (Beck et al., 2019; Leune et al., 2021; Teschke et al., 2016). Using self-reported data from Melbourne, Reynolds et al. (2024) showed that 21 percent of surveyed cyclists were involved in at least one tram-track-related crash in the last five years. However, no collisions between trams and cyclists were captured in the survey. Using hospital data, Gerber et al. (2021) found that tram-track-related bicycle crashes accounted for 11 percent of all bicycle crashes in Bern, Switzerland. In a study from Germany by Ruf et al. (2023), perceived safety was found to affect cyclists’ lane position and cyclists generally felt safer on sites without tram tracks. While much research has investigated bicycle crashes on tram tracks, very few have examined traffic crashes between trams and cyclists. For example, Maempel et al. (2018) showed that, in Scotland, while a significant proportion of bicycle crashes involve tram tracks (89%), 8 percent of cases involved a collision with a cyclist or another mechanism. Consequently, there is a need to understand tram-cyclist crashes further.
Previous studies have investigated factors contributing to tram crash frequency and severity. For example, Naznin et al. (2016) found that the frequency of tram-related crashes in Melbourne was affected by tram stop spacing, traffic volume, service frequency and priority measures. According to a study in the US, the frequency of tram-related injuries was significantly influenced by speed and right of way (Ziedan & Brakewood, 2020). In another study in Melbourne, Naznin et al. (2016), suggested that tram travel speed, tram priority lanes and tram age were determinants of injury severity that resulted from a tram crash. Nevertheless, there is a lack of research investigating the severity of tram crashes and particularly the relationship between pedestrian and cyclist involvement and tram crash severity.
This study aims to explore the severity of tram crashes and the relationship between pedestrian and cyclist involvement and the severity of tram crashes. An understanding of tram crash severity and its influencing factors is essential for developing strategies to improve tram safety and enhance pedestrians’ and cyclists’ safety along tram routes. Melbourne is selected as a case study, given the city’s operation of one of the world’s largest tram networks and especially on-street tram networks with a high level of interactions with pedestrians, cyclists and motorists. Specifically, Melbourne has over 250 kilometres of tracks, of which 74 percent are in mixed traffic, primarily serving the central business district (CBD) and inner suburbs. The network has approximately 1,700 tram stops and is operated with a fleet of more than 500 trams, delivering around 5,000 services daily (Yarra Trams, 2024) and completing about 300,000 passenger trips daily (VISTA, 2023). In Melbourne, trams are the second most popular mode of public transport after trains, contributing to approximately 3 percent of all trips and 1 percent of total kilometre travelled (VISTA, 2023).
Method
This research utilised police-reported crash data from Melbourne between 2012 to 2023, as it represented the most recent and publicly accessible information about traffic crashes in the city. It is noted that these data included casualty crashes only. Tram crashes were extracted using the details of vehicles involved in the crash records. The involvement of pedestrians and cyclists in these crashes was identified using person and vehicle details. Crash data were linked with traffic volume data to obtain traffic information, such as traffic volume and the proportion of heavy vehicles. Tram right of way variables included fully exclusive (i.e., fully separated or separated by hard median), semi-exclusive (tram lanes or protected by mountable kerbs) and shared right of way. Area-wide variables (such as population density, proportion of commercial, residential, and industrial land uses, tram stop density, and intersection density) based on traffic analysis zones where the crash occurred were also integrated for the analysis. All data were obtained from data.vic.gov.au and the Australian Bureau of Statistics census and processed using the R statistical packages like sf and dplyr (Pebesma & Bivand, 2023; R Core Team, 2024). Table 1 provides a summary of key variables in the analysis.
Tram, tram-pedestrian and tram-cyclist crashes were first analysed using descriptive statistics and visualised using maps. A hotspot analysis of tram crashes was performed using network kernel density estimation (KDE) (Okabe & Sugihara, 2012). Bivariate analyses were also conducted using the Chi-squared test. Given the relatively small number of fatal crashes, fatal and serious injury levels were combined into a severity level, that is, fatal or serious injury (FSI). It is noted that the severity of a tram crash was identified using the highest level of severity among involved road users (FSI if there was at least one fatal or serious injury; other injury otherwise). A Bayesian mixed effect binary logistic regression was then employed to explore the effects of explanatory variables, especially pedestrian and cyclist involvement, on tram crash severity (1 for FSI and 0 for other injury). The mixed (random) effect approach was adopted to account for potential unobserved heterogeneity in the data. The estimation of model coefficients was conducted using Markov Chain Monte Carlo (MCMC) simulation. Specifically, model estimations were based on 20,000 samples after removing 20,000 burn-in samples. The convergence diagnostic was employed (Vehtari et al., 2021). Model selection was performed using the Widely Applicable Information Criterion (WAIC), where a lower WAIC score indicated a better model fit. The variance inflation factor (VIF) was applied to assess potential multicollinearity issues. The analysis was conducted using the R statistical packages such as brms (Bürkner, 2017; R Core Team, 2024).
Results
Descriptive Statistics and Maps
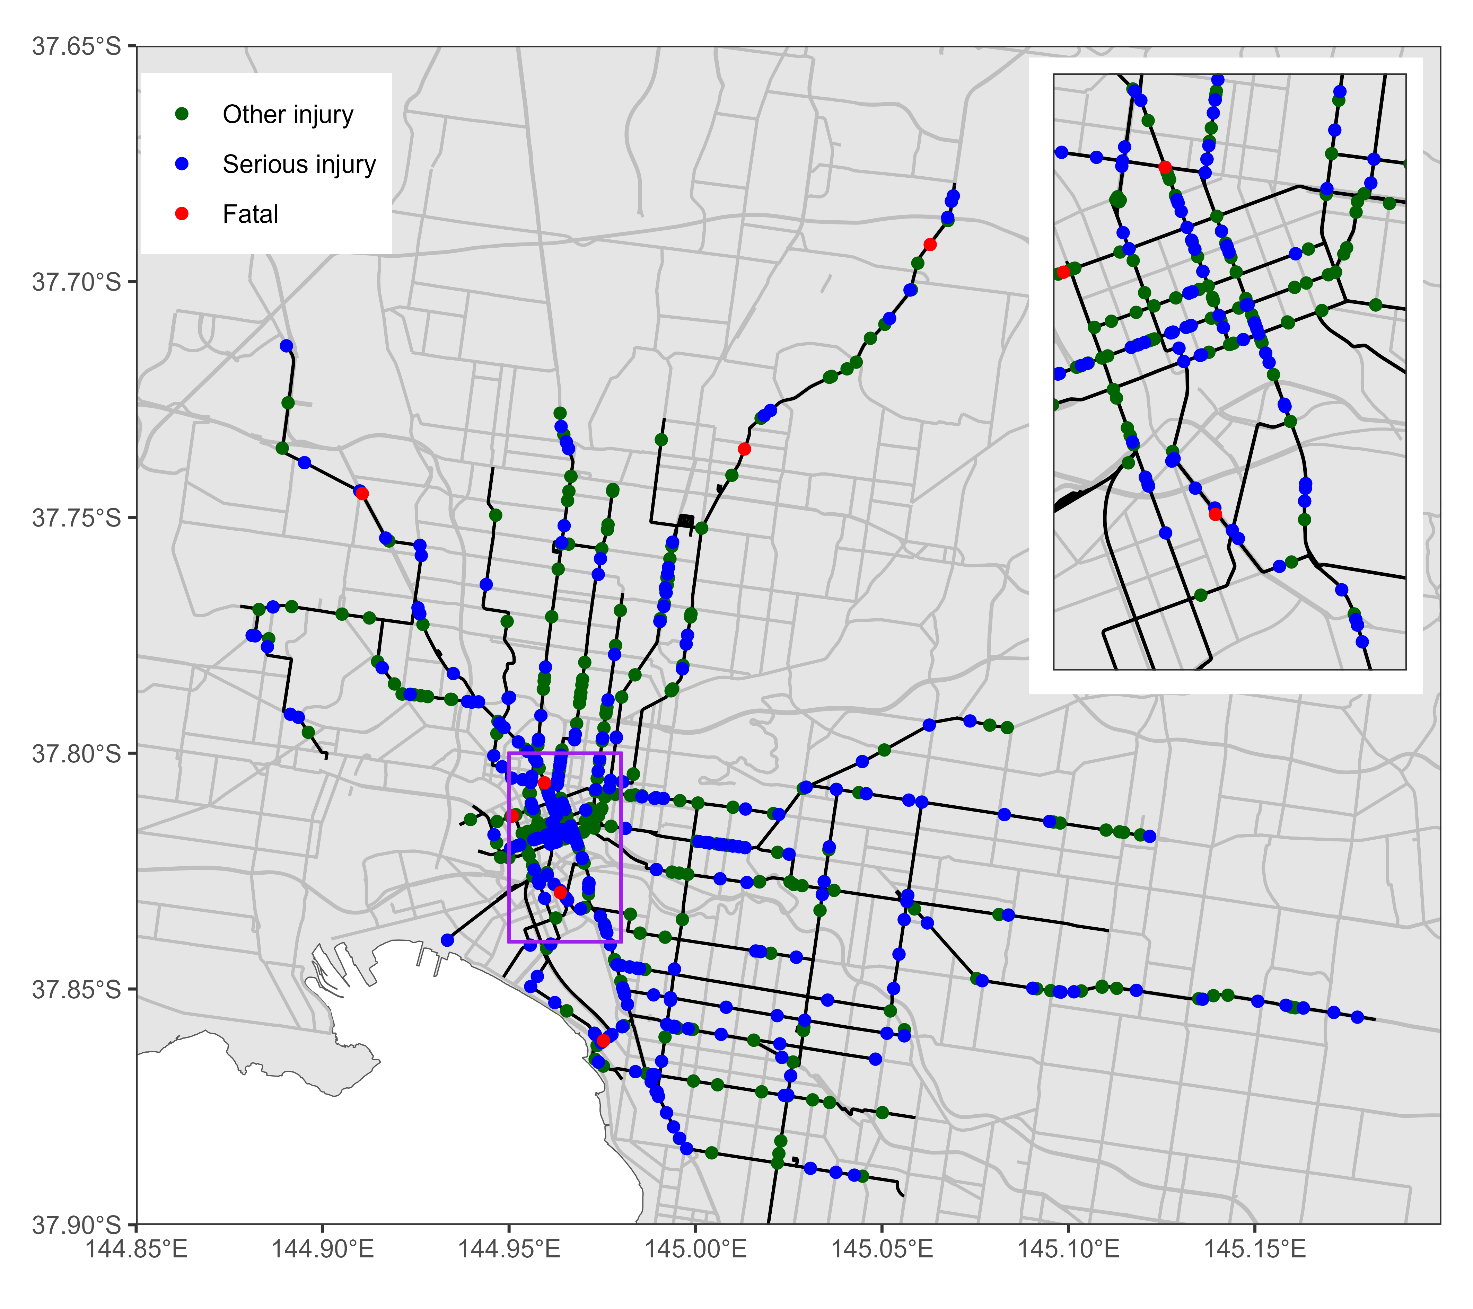
Between 2012 and 2023, there were 639 tram crashes in Melbourne, including 7 fatal crashes (1.1%), 286 serious injury crashes (44.8%) and 346 other injury crashes (54.1%). Thus the number of FSI tram crashes was 293 (46%). All seven fatal crashes were tram-pedestrian crashes. Figure 1 illustrates the distribution of tram crashes along the tram network in Melbourne. It shows a higher concentration of crashes, especially serious injury and other injury crashes, in the CBD and inner suburbs, with fewer crashes extending into the middle suburbs. Fatal tram crashes are infrequent and scattered throughout the tram network. Tram crashes tend to cluster around intersections (approximately 56%), which is expected considering the conflicts between different modes of transport, such as trams, cyclists, pedestrians and other vehicles.
.png)
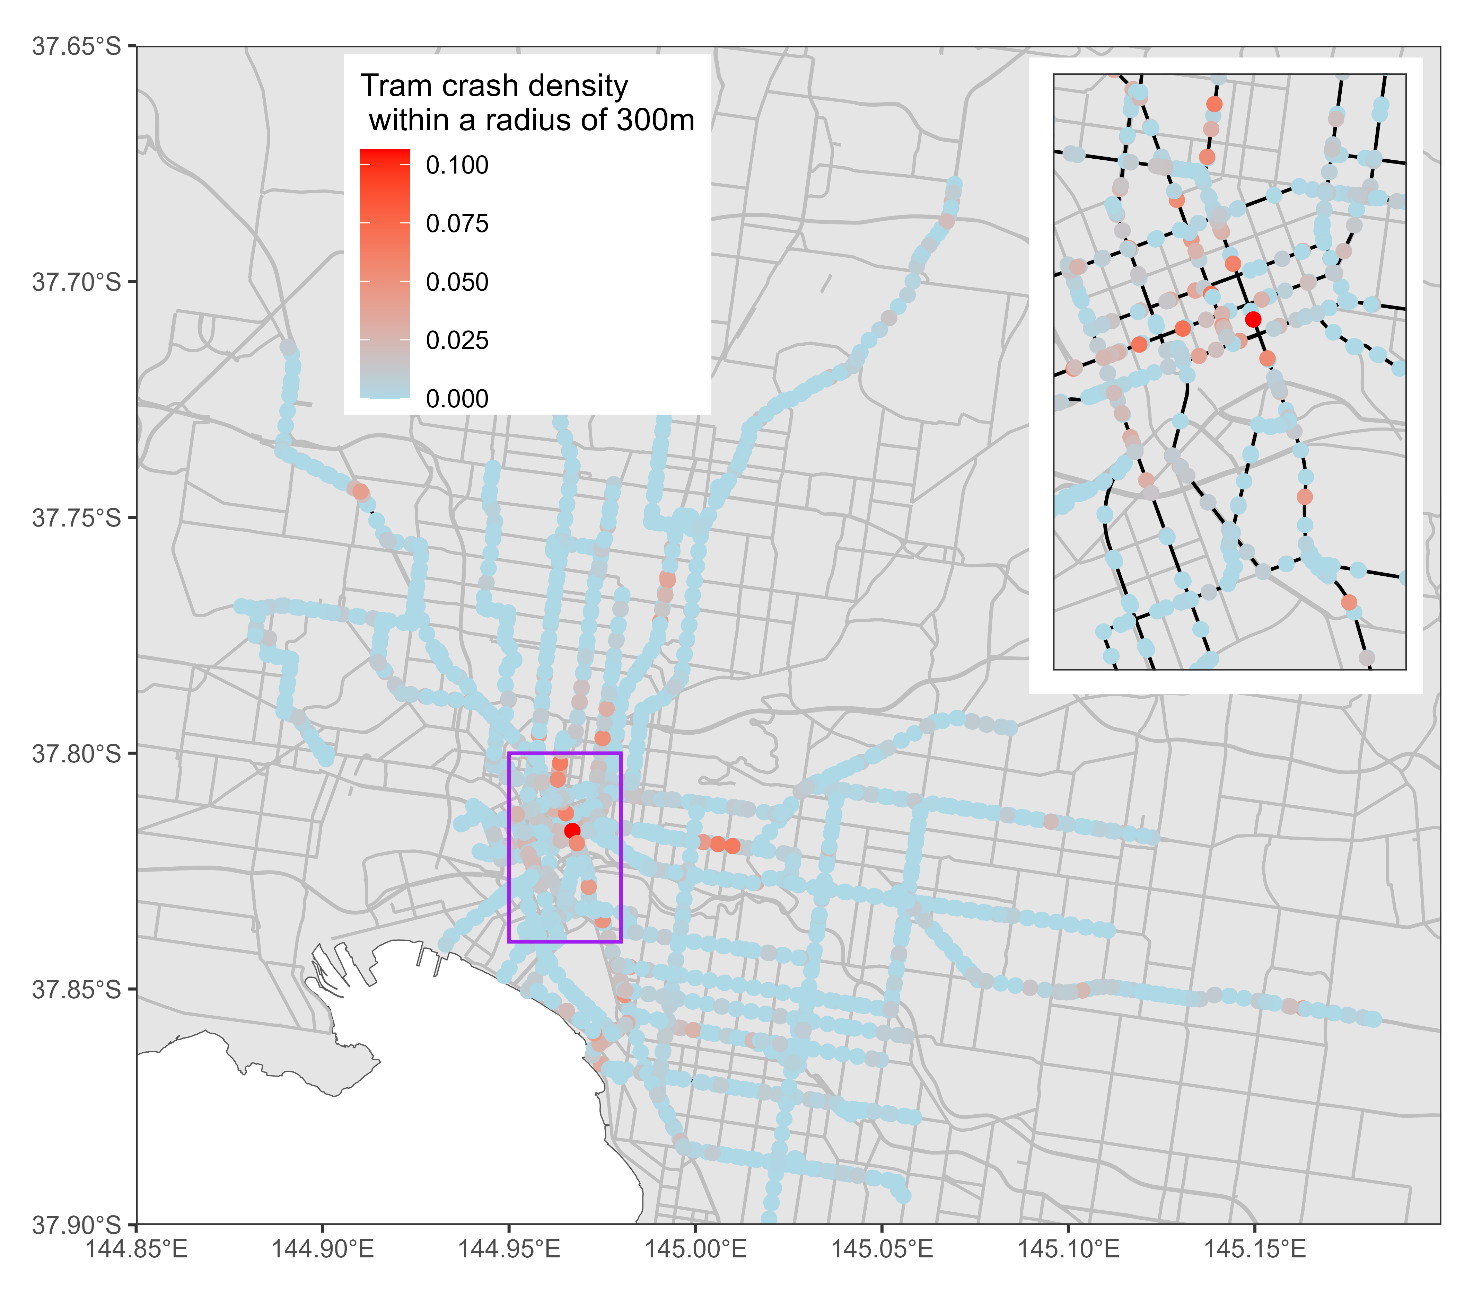
Figure 2 presents the density of tram crashes within a 300-metre search radius calculated using the network kernel density estimation (KDE), further visualising tram crash hotspots across the network. The density values ranged from zero to one, with higher values indicating a greater concentration of tram crashes. The densest hotspots are concentrated in the CBD and its immediate surroundings. This suggests that the inner city, where tram routes are densely packed with generally high levels of traffic, pedestrian and cyclist activities, experiences the highest concentration of tram crashes. Several tram corridors, such as St Kilda Road and Bridge Road, also experience a significant concentration of tram crashes.

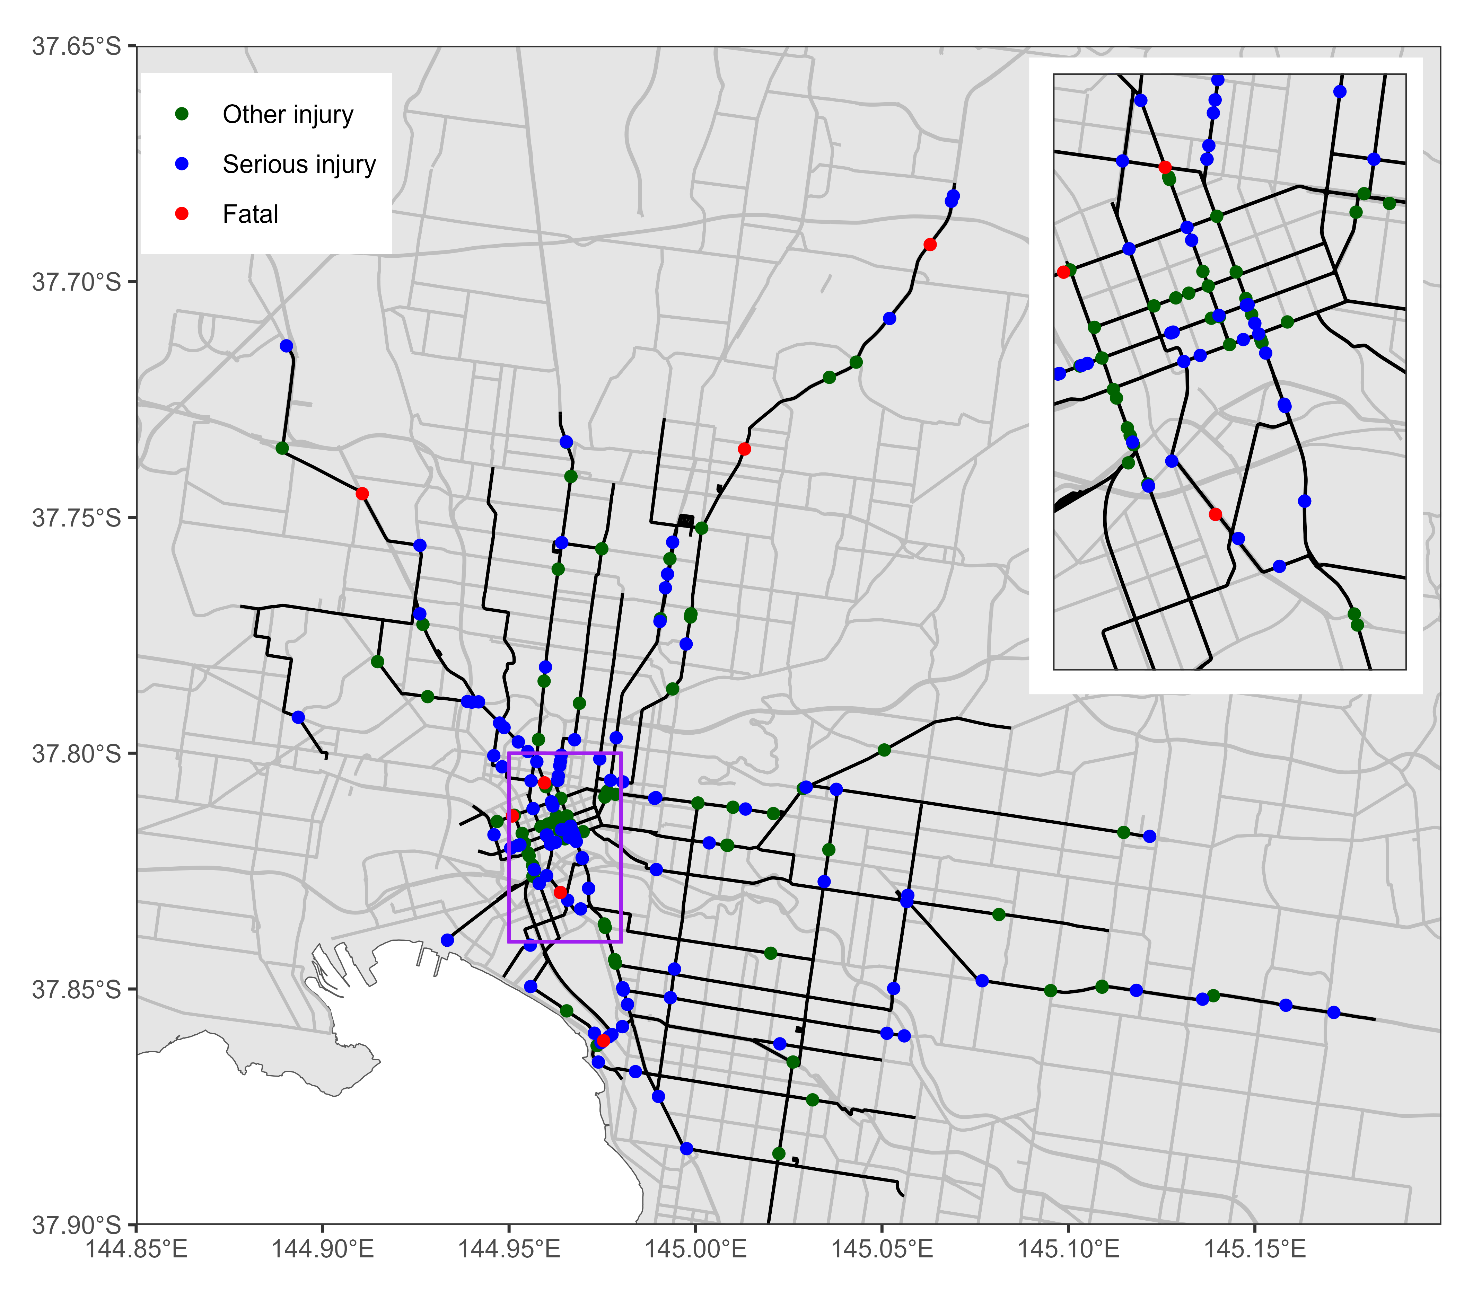
Out of the 639 tram crashes analysed, 196 (31%) were tram-pedestrian crashes, of which 112 were FSI (7 fatal and 105 serious injury) crashes and 84 were other injury crashes. Thus, around 57 percent of tram-pedestrian crashes resulted in fatalities or serious injuries. Approximately 47 percent of tram-pedestrian crashes occurred at mid-block locations. Bivariate analysis shows that tram crashes involving pedestrians are more severe than crashes not involving pedestrians (Chi-squared = 13.87, df =1, p<0.001). The spatial distribution of tram-pedestrian crashes is depicted in Figure 3. Similar to overall tram crashes, there is a noticeable concentration of tram-pedestrian crashes in the CBD and adjacent areas. The spread of fatal and serious injury crashes across both inner and outer areas indicates that tram-pedestrian safety is a concern across the entire network. An analysis of DCA coding (Definition for Classifying Accidents) revealed that the most common type of tram-pedestrian crashes involved pedestrians being struck from the right (near side), accounting for 78 crashes, followed by pedestrians being struck from the left (far side), with 32 crashes.
.png)
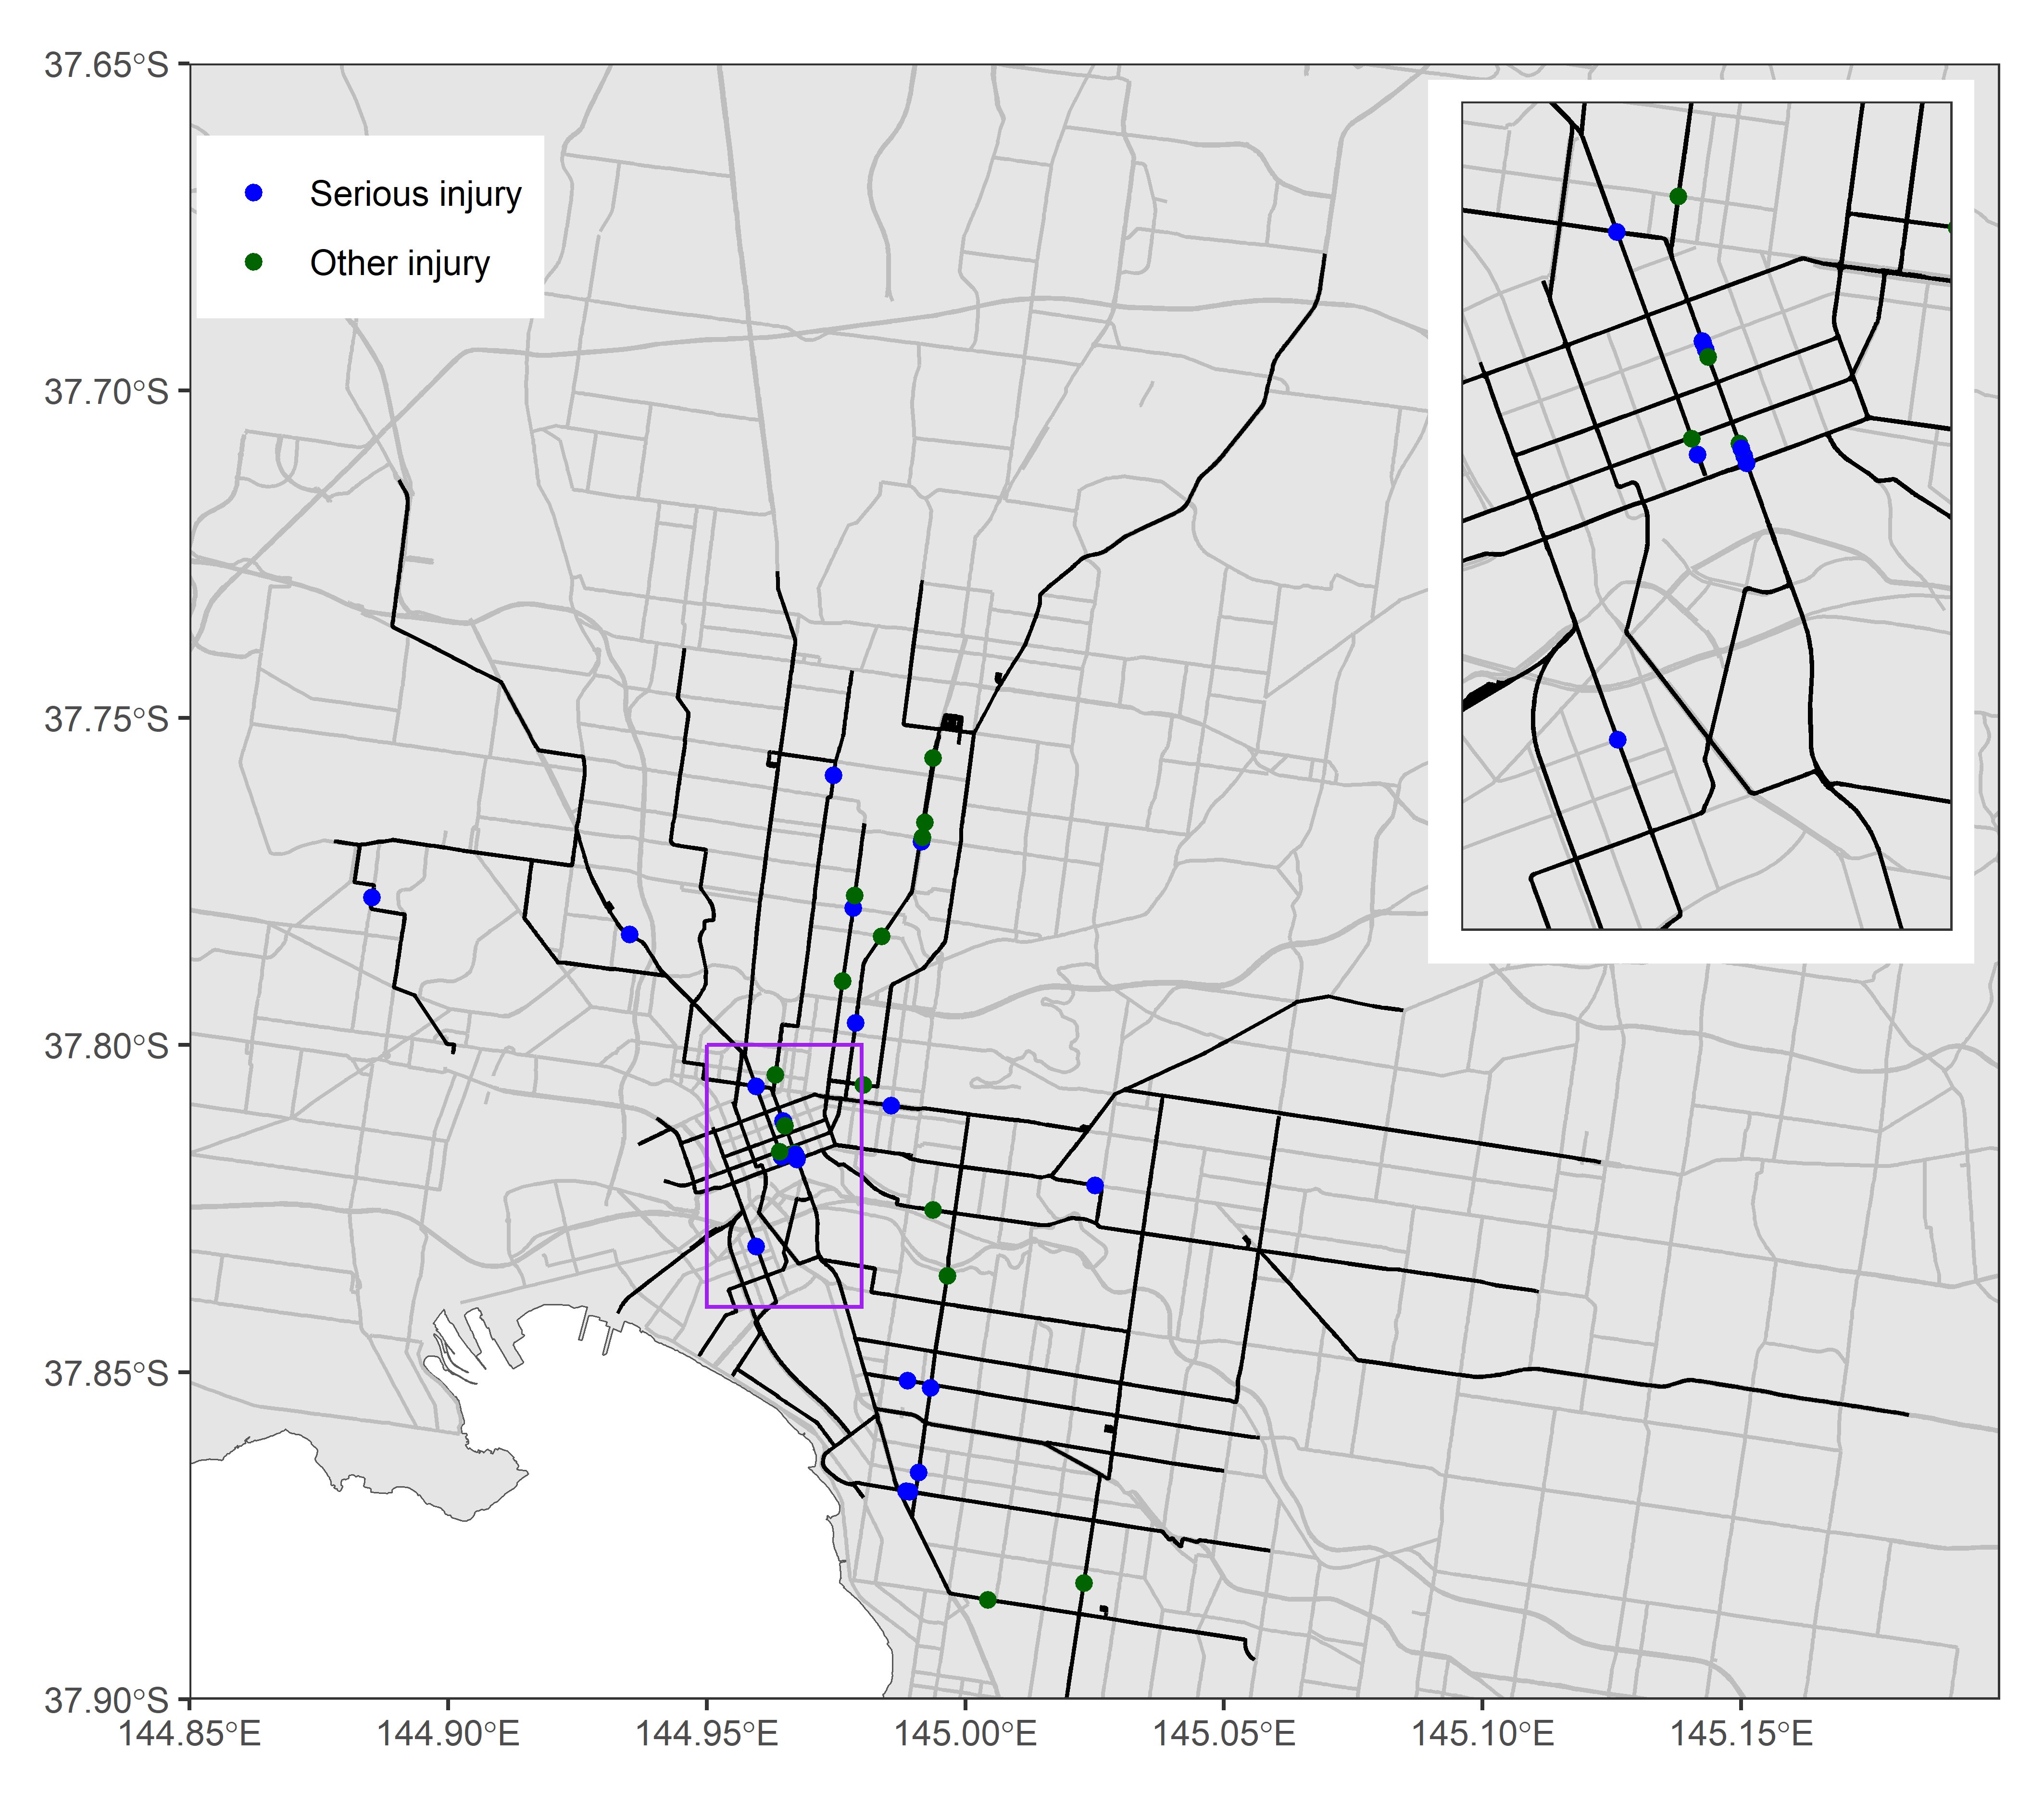
During the 2012-2023 period, 40 tram-cyclist crashes (6% of all tram crashes) occurred, with 23 being FSI (0 fatal and 23 serious injury) crashes and 17 being other injury crashes. In other words, approximately 57 percent of tram-cyclist crashes resulted in serious injuries. About 45 percent of tram-cyclist crashes occurred at mid-block locations. While the severity of tram crashes involving cyclists appear more severe than those not involving cyclists, this relationship is insignificant (Chi-squared = 1.86, df = 1. p =0.17). Figure 4 highlights that tram-cyclist crashes are most frequent in the CBD and inner suburbs along major tram routes, where both cycling and tram usage tend to be higher. While there is an absence of fatal tram-cyclist crashes, the concentration of serious injuries still suggests substantial safety concerns. The lack of recorded tram-cyclist crashes in the outer areas should not be interpreted as an absence of safety concerns, as the data do not account for non-casualty tram crashes. The most common type of tram-cyclist crashes was related to lane changing, accounting for 10 crashes, followed by lane side swipe with 5 crashes.
No tram crashes involved both cyclists and pedestrians.
.png)
Regression Model
Table 2 summarises the estimated results of the mixed effect binary logistic model for FSI versus other injuries. Only variables with 95 percent Bayesian credible intervals (BCI) that did not contain zero (i.e., having a significant effect) were included in the final model (see Table 2). It is noted that right of way variables were tested but found to be insignificant and therefore were excluded from the final model. The WAIC value of the final model was 855.9, significantly lower than that of the intercept only model (883.5), suggesting a good model fit. The mixed effect, accounting for unobserved heterogeneity, had a standard deviation of 0.08 (95% BCI: 0.004 to 0.23).
Four crash-level variables were significant, including speed limit, number of vehicles involved, pedestrian and cyclist involvement. The inclusion of two binary variables for pedestrian and cyclist involvement enabled comparisons with the reference crash type, tram-vehicle crashes.
Pedestrian involvement had a positive coefficient of 1.25 (95% BCI: 0.75 to 1.76), suggesting tram crashes involving pedestrians were 3.48 times more severe compared to tram-vehicle crashes. A positive coefficient of 0.47 (95% BCI: 0.10 to 0.85) for the speed limit variable showed that tram crashes in areas with a speed limit of 60km/h or above were more severe than those in areas with a lower speed limit. This is an expected result, considering the key role of speeds on crash severity. It is worth noting that the speed limit applies to all vehicles, including trams. The 60km/h threshold was selected since approximately half of the tram crashes occurred on roads with a speed limit below 60km/h.
Similarly, cyclist involvement had a positive coefficient of 0.80 (95% BCI: 0.11 to 1.52), indicating that if a tram crashed with a cyclist, the likelihood of severe injuries was 2.22 times higher compared to crashes without cyclist involvement. It can be argued that vulnerable road users such as pedestrians and cyclists are at a greater risk of severe injuries in tram crashes when compared to car occupants due to their higher exposure to impact.
The number of vehicles involved was positively associated with severity, as shown in a positive coefficient of 0.38 (95% BCI: 0.04 to 0.75). This indicated that the likelihood of severe crashes was 1.47 times higher with each additional vehicle involved.
The effects of area-wide variables on tram crash severity were evident. It was found that tram crashes were more severe in areas with a higher population density (0.25, 95% BCI: 0.007 to 0.50) but less severe in areas with a higher proportion of commercial land use (-0.75, 95% BCI: -1.39 to -0.12). Regarding infrastructure, tram stop density had a positive coefficient of 0.01 (95% BCI: 0.001 to 0.02), meaning tram crashes in areas with a higher tram stop density were more severe.
Discussion
This study investigated tram crash severity and associated factors using data from Melbourne’s tram network. The results highlighted the relationship between tram crashes and pedestrian or cyclist involvement and injury severity. Approximately 31 percent of tram-related crashes in Melbourne involved pedestrians, indicating an overrepresentation compared to the overall share of pedestrian crashes of 11% in all traffic crashes across the city (CrashStats, 2024). This figure is similar to a European observation (Lackner et al., 2022), but much higher than that in the US (Ziedan & Brakewood, 2020). The discrepancy between the share of tram-pedestrian crashes in Melbourne and Europe compared to that in the US could be attributed to several factors. In many European cities and in Melbourne, trams are often operating in densely populated areas where pedestrian activity is high and walking mode share is generally higher than in the US.
Importantly, this study found that cyclists were involved in approximately 6 percent of all tram-related crashes in Melbourne. This was lower compared to the overall share of cyclist crashes of all traffic crashes in Melbourne (12%) (CrashStats, 2024). However, when considering cyclist crashes related to tram tracks, the overall involvement of cyclists in tram system-related crashes could be substantially higher. This highlights the need to understand tram-cyclist crashes as well as tram-track-related crashes in order to improve tram and cyclist safety.
Injury outcomes from crashes involving trams were fatal (1.1%), serious injuries (44.8%) and other injuries (54.1%). All fatal crashes involved pedestrians, indicating that tram-pedestrian collisions are particularly hazardous. While the number of tram-cyclist crashes was substantially lower than tram-pedestrian crashes, the proportion of severe injuries in tram-cyclist crashes was similarly high (57%). The results of a Bayesian mixed effect binary logistic regression model further corroborate these observations. Tram-pedestrian crashes were 3.48 times more likely to result in a death or serious injury compared to tram-vehicle crashes. In addition, severe injuries were 2.22 times more likely in a tram-cyclist crash compared to a tram-vehicle crash. Overall, these results suggest that when trams collide with pedestrians or cyclists, the risk of severe injuries (or fatalities) is high, which could be attributed to the large mass and limited stopping capabilities of trams, which exacerbate the impact on pedestrians and cyclists. More tolerant front-end tram designs and low floor trams could be considered to reduce the impacts on vulnerable road users such as pedestrians and cyclists (Lopot et al., 2023).
Results show that lower speed limits could reduce the severity of tram crashes, which aligns with the finding from previous tram safety research (Ziedan & Brakewood, 2020). This effect is consistent with the Safe System approach, which emphasises the increased risk of harm at higher speeds. Therefore, incorporating speed management strategies is crucial to creating safer environments for tram systems. In addition, as the number of vehicles involved in tram crashes increases, the potential for severe outcomes also increases, which is consistent with previous research (Barua & Tay, 2010) and could be attributed to the risk of multiple impacts. It was also observed that higher tram stop density could increase tram crash severity. Higher tram stop density can lead to more frequent stop-and-go movements by both trams and surrounding traffic, as well as increased boarding and alighting activities. These factors could increase the likelihood of more severe conflicts between trams and vulnerable road users, especially pedestrians. For instance, the presence of tram stops significantly increased the likelihood of FSI crashes at intersections (Xu et al., 2016), suggesting that the increased interactions and conflicts at tram stops could contribute to crash severity. Tram crashes could be more severe with increased population density and decreased proportion of commercial land use, highlighting the effects of built environment factors. Previous research found that densely populated areas could experience more pedestrian crashes (Guerra et al., 2019), largely due to increased pedestrian activity and the complex interactions between various road users. Similarly, in such areas, tram crashes are more likely to involve pedestrians, who are particularly vulnerable to severe injuries. Areas with a higher proportion of commercial land use could experience more crashes (Hovenden & Liu, 2020), but potentially lower severity, arguably due to better infrastructure such as separated tram lanes and safety platforms.
Study strengths and limitations
The strength of this research was the combination of crash-level and areawide data to explain tram crash severity, moving beyond a focus on crash-level data commonly observed in previous studies. The application of Bayesian mixed effect modelling approaches provided robust results, accounting for potential unobserved heterogeneity. Nevertheless, a limitation of this research is that the data do not include non-casualty crashes and near misses. Thus, it was not possible to consider the distinction between casualty and non-casualty tram crashes. In addition, the range of crash types and area-wide variables could have been more extensive. Since this study focused solely on data from Melbourne, conducting similar analyses in other cities with tram networks could enable meaningful comparisons and support broader generalisations of the findings.
Conclusions
This research has explored the severity of tram crashes in Melbourne and associated factors. Approximately 46 percent of tram crashes led to fatalities or serious injuries. About 57 percent of tram-pedestrian and tram-cyclist crashes resulted in fatalities or serious injuries. The results suggested that tram-pedestrian crashes were more than three times as likely to be fatal or lead to serious injuries compared to tram-vehicle crashes. In addition, tram-cyclist crashes were more than two times as likely to be more severe compared to tram-vehicle crashes. The findings suggest a critical need to improve the safety of pedestrians and cyclists around tram routes in order to achieve Australia’s 2030 road safety targets (DITRDC, 2021).
The insights from this research also identified areas that require further research. Future work should extend the analysis with additional explanatory variables concerning demographics (e.g., age, gender), street design (e.g., number of lanes, lane width, on-street parking), tram network design (e.g., types of tram stops), and operational characteristics (e.g., tram frequency, operating travel speed). The effects of tram right of way characteristics should be explored further using more detailed sub-types as suggested by Korve et al. (1995) and Reynolds (2020). Future research could also compare the severity of tram-pedestrian/cyclist crashes with that of car-pedestrian/cyclist crashes, providing valuable insights into the unique characteristics of tram-related crashes in cities.
Data availability statement
Data will be provided upon request.
Conflicts of interest
The author declares that there are no conflicts of interest.
Australasian Road Safety Conference 2024
This paper was first submitted as an Extended Abstract to the Australasian Road Safety Conference 2024 (ARSC2024) held in Hobart, Tasmania, Australia from 30 September to 3 October. The anonymised peer-review process recommended this paper be accepted and it was including as an Oral Presentation and the Extended Abstract was published in the ARSC2024 Proceedings. This paper extends the Extended Abstract works and was underwent further peer-review by two independent subject matter experts. The paper includes content already published in the ARSC2024 Proceedings and is reproduced here with permission.