


Glossary
CFR Case Fatality Rate
DMAIC Define, Measure, Analyse, Improve, and Control
FRSC Federal Road Safety Corps
HD Human Damage
MRP Mortality Rate per Population
RTC Road Traffic Crashes
Introduction
Road Traffic Crashes (RTC) remain a leading cause of mortality and a direct economic burden worldwide (WHO, 2023). Accordingly, it is projected that if sustained actions are not taken, RTC will become the seventh leading cause of death by 2030, particularly affecting developing countries and causing substantial socioeconomic burden (WHO, 2023). Alarmingly, 90 percent of road crashes occur in low- and middle-income countries, (WHO, 2018) that have not yet benefited from the stricter vehicle standards and effective traffic safety laws established in high-income countries (Ning et al., 2016; Pal et al., 2018).
In Nigeria, the road serves as the most practical mode of transportation for a larger percentage of its citizens. However, the roads are not safe with approximately 5,500 deaths and 39,000 injuries are recorded on Nigerian roads annually FRSC, 2021; Modobi, 2021. Given the overwhelming challenges affecting road transportation in Nigeria, road safety research has recently attracted government and scholarly attention. The Federal Government of Nigeria (FGN) is dedicated to reducing RTC while also ensuring a secure transportation system for all types of road users. Nevertheless, even with the commendable initiatives taken by the government, RTC remain notably high, indicating that the country has not yet achieved an effective solution (Atubi, 2022; Siyan et al., 2019).
In Nigeria, crash statistics analysis literature (Liu et al., 2021; Song et al., 2019) including the usefulness of analysing spatial and temporal information of road crashes have determined the severity index of crashes and identify locations most prone to crashes. For instance, Lawan et al. (2018) explored the spatial and temporal patterns of RTC between Kano-Wudil on Kano Maiduguri road utilising monthly data and multiple linear regressions, descriptive tools, and geographic information system (GIS) to demonstrate the result of the findings.
Road crash analysis involves identifying and investigating individual crashes focusing on immediate causes like driver error or vehicle malfunction. However, this approach often neglects the underlying systemic factors contributing to the problem. To close this gap, the inclusion of the Six Sigma (DMAIC) cycle in RTC analysis has recently attracted scholarly attention due to the expansion of the research scope (Umit & Ali, 2017), which is the novelty of the current study. Six Sigma methodology has been adopted in many industries as a business management tool to improve operational capabilities and reduce defects in any process. The technique improves existing business processes through regular review and fine-tuning (Ankesh et al., 2023). Six Sigma employs a five-step approach: Define, Measure, Analyse, Improve, and Control (DMAIC). DMAIC methodology of the Six Sigma initiative is the roadmap for continuous improvement (V. Gupta et al., 2018). Numerous effective Six Sigma studies are documented in manufacturing and other industries (N. Gupta & Bharti, 2013; Mamatha & Vasuki, 2014).
Therefore, incorporating Six Sigma (DMAIC) approach offers a structured framework for analysing complex systems like road traffic crashes. This forms the study’s contribution and remains novel. The study’s results are significant and will assist policymakers within Nigeria and other developing countries to develop and keep track of existing road safety policies and take further actions to reduce RTC in the future.
Methods
Data source
The data on RTC and causative factors for this study were obtained from the quarterly reports of the Federal Road Safety Corps (FRSC) of Nigeria, published by the National Bureau of Statistics of Nigeria from 2020, Quarter 4 to 2023, Quarter 1 (NBS, 2023). The RTC data were divided into three severity categories: fatal crash, serious crash, and minor crash. A fatal crash is defined as a collision that directly results in the death of at least one individual, either at the scene or within 30 days post-crash due to injuries sustained or direct complications (WHO, 2023). A serious crash is defined as an event that results in injury to any of the parties involved and requires medical attention. A minor crash is defined as an event where no one needs medical attention but an injured person may sustain some bruising and superficial cuts (Shakil et al., 2023).
Variable definition and metrics classification of crash incidence and severity
Using Equations (1), (2) and (3), RTC were analysed based on three different epidemiology metrics to evaluate the severity of traffic crashes.
Mortality Rate per Population (MRP)=Number of people killed (NK)Population of region (P)×100
Human Damage (HD)=Number people seriously injured (NI)Population of region (P)×100
Case Fatality Rate (CFR)=Number of people killed (NK)Total Number of people killed or seriously injured (Casualties) (TC)×100
NK denotes the total number of people killed, NI denotes the total number of people seriously injured, P denotes the population of each region and TC denotes the total casualties, that is the number of people killed or seriously injured. While MRP denotes mortality rate per population, case fatality rates (CFR), and HD denotes human damage. As indicated by its name, the HD describes the average human damage per crash. The CFR index describes the proportion of deaths within a designated population of crash cases (Hayakawa et al., 2000).
Case study on Sigma DMAIC implementation on RTC Analysis
The study used a conceptual framework developed with a qualitative and quantitative approach, creating an in-depth case study of RTC analysis records. The case study allowed the possibility of implementing the Six Sigma technique for crash prevention to be examined. The DMAIC methodology framework used in this research is categorised into the following five basic phases (Table 1). The outcome of the analysis will enable road safety regulators to develop evidence-based rules or policies on road safety and uncover the causes of crashes to prevent future crashes.
Define phase
The RTC in Nigeria have increased annually since 2017 (Figure 1). While acknowledging the overall RTC trend in Nigeria, the specific objective of the current study is to address the road safety challenges inherent in the south-south and southeast regions of Nigeria between 2020 (Quarter 4) and 2023 (Quarter 1). This involves exploring the regional trends and key drivers that contributed to fatalities and injuries and suggesting improvement measures, based on the research outcomes.
.png)
Measure phase
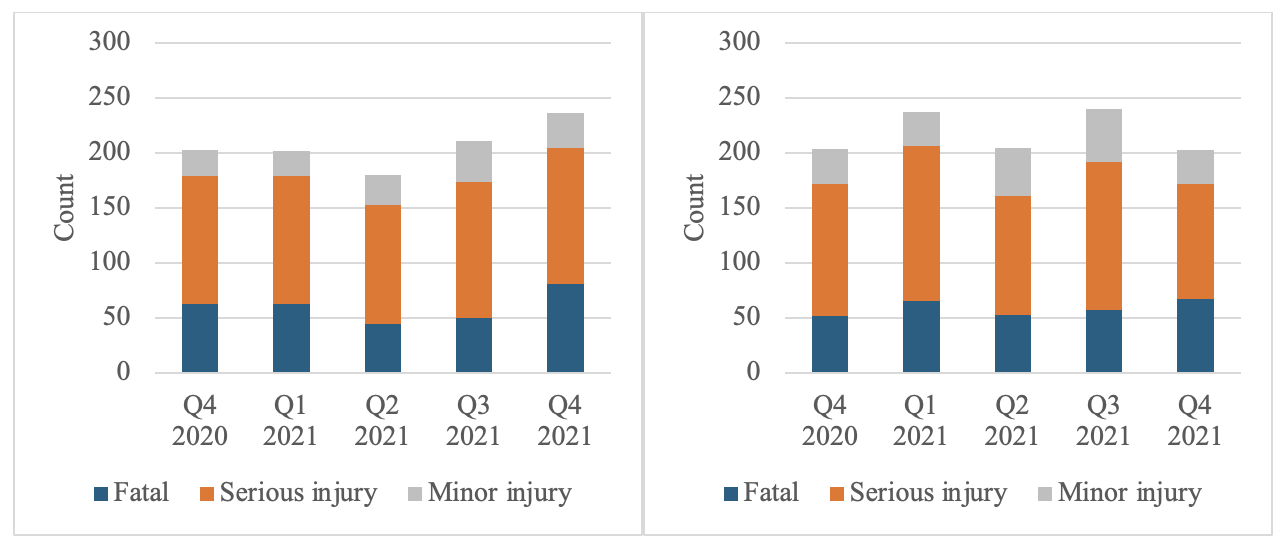
The measure phase involved two major steps, 1) the collection of historical data on road traffic crashes, including the frequency, severity, temporal changes, and contributing factors and, 2) developing baseline metrics to assess the current state of road safety. The number of RTC that occurred in the two regions are presented in Figure 2. The south-south region recorded the highest number of crash cases during the study period (2,013, 50.4%). The quarter with the highest number of crashes was Q1, 2022. While in the southeast region, 1,980 crashes occurred and Q3, 2021 had the highest number of crashes.
_and_southeast_region_(rig.png)
A comparison of crash categories shows that serious cases were the most common crash outcome in both regions (south-south: 55.6%; southeast: 56.9%). However, the time of these peaks varied (south-south, Q1 2022, 57.5%; southeast Q1 2021, 59.1%).
Data presented in Table 2 show the south-south region experienced a total of 6,281 serious casualties from Quarter 4 2020 to Quarter 1 2023; of these, 5,179 were injury-related (82.5%) and 1,102 were death-related (17.5%). Quarterly data reveal a complex trend following a 12.9% increase in Quarter 1 2021, serious casualties in Quarter 2 2021 declined by 13.2 percent. This was succeeded by an increase of 18.4 percent and 20.1 percent in Quarter 3 2021 and Quarter 4 2021, respectively. In subsequent quarters, serious casualties fell sharply by 2.54 percent, 10.2 percent, 24.6 percent, and 27.3 percent in Quarter 1 2022, Quarter 2 2022, Quarter 3 2022, and Quarter 1 2023, although there was a notable increase of 22.7 percent in Quarter 4 2022.
In contrast, the southeast region recorded 6,529 serious casualties between Quarter 4 2020 and Quarter 1 2023, with 5,590 being injury-related (85.6%) and 939 being death-related (14.4%). Here, the quarterly patterns showed a significant 25.7 percent decrease in Quarter 2 2021 following a 16 percent increase in Quarter 1 2021, with a recovery of 25.3 percent in Quarter 3 2021. This decline persisted in subsequent periods, culminating in a considerable 28.4 percent drop in Quarter 1 2023.
Severity of crash casualties
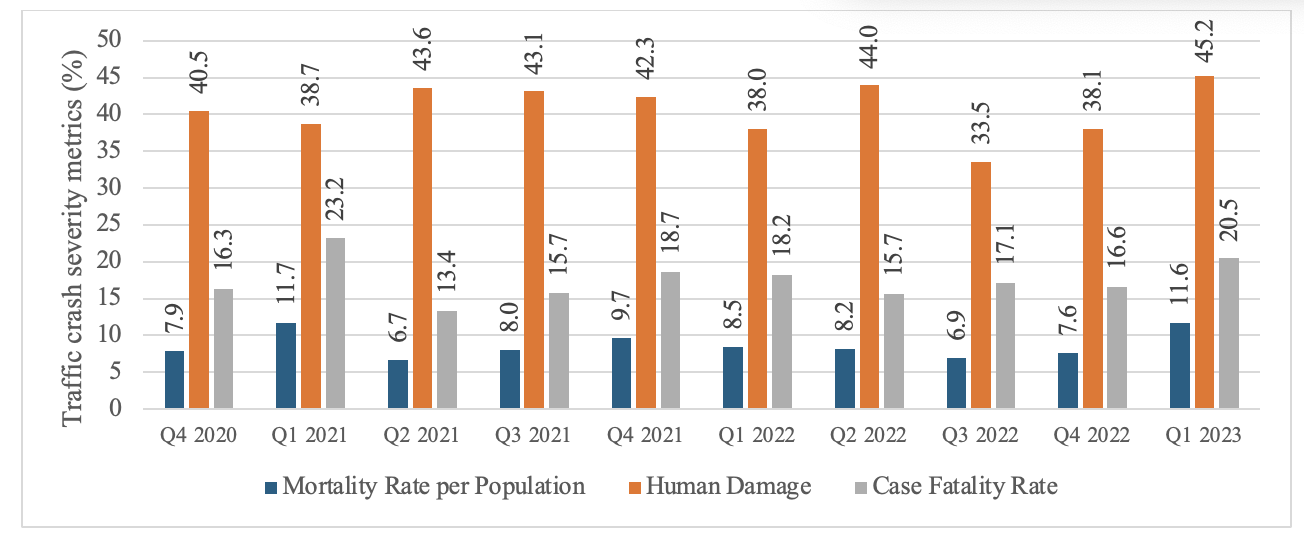
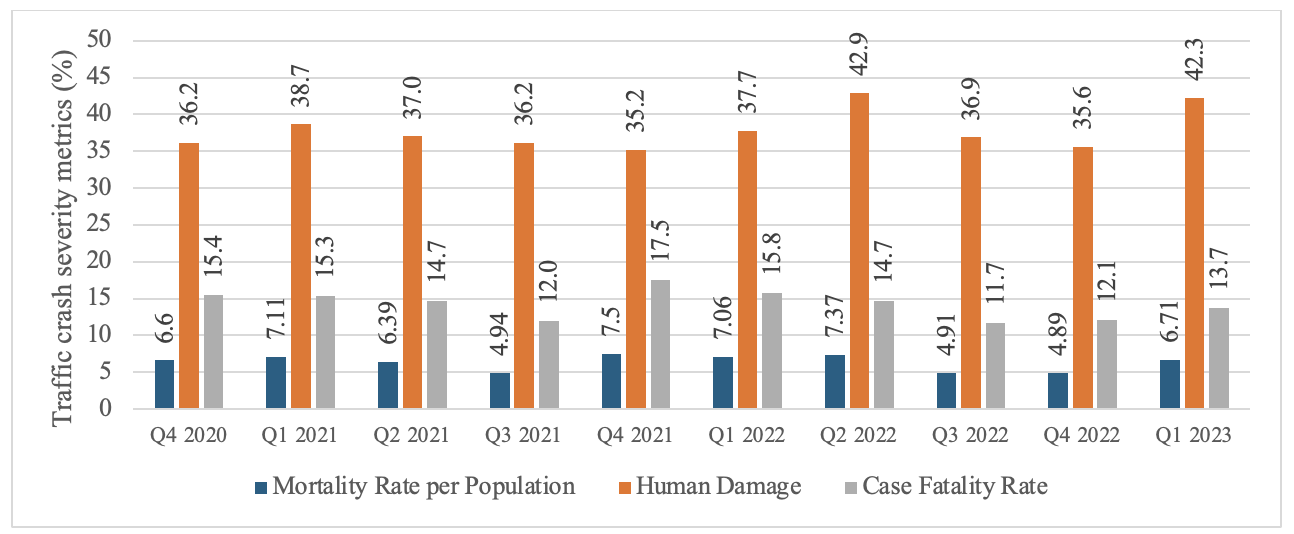
Using Equations (1) to (3), the comparison of MRP, HD, and CFR between Quarter 4, 2020 and Quarter 1, 2023 is shown in Figure 3 and Figure 4. The regional and time dimension comparison of road traffic crash severity indicators illustrates the temporal changes in traffic metrics within these regions.


To further compare the differences in crash severity between the two regions for the period from 2020 to 2023, the model metrics: MRP, HD, and CFR were analysed using one-way ANOVA as shown in Table 3.
The south-south region experienced more severe effects in terms of mortality (MRP), human damage (HD), and case fatality rates (CFR) compared to the southeast region. The differences between the two regions were statistically significant. However, in terms of time distribution, in the south-south region there was considerable variation in the mortality rate (Q1, 2021: 11.7%; Q2, 2021: 6.7%; Q1, 2023: 11.6%). This variability reflects substantial alterations in safety compliance and the severity of traffic incidents (Inah & Nwankwojike, 2018).
In contrast, the human damage metric in the south-south region varies considerably, however, general trend was relatively stable from Q4, 2020 (40.5%) to Q1, 2023 (45.2%). The case fatality rate also demonstrates notable fluctuations, as the maximum (23.2%, Q1, 2021) and minimum (13.3%, Q2, 2021) occurred in the same year. On the other hand, the southeast region maintains a generally lower mortality rate than the south-south region, starting at 6.6%, in Quarter 4 of 2020 and peaking at 7.50% percent in Quarter 4 of 2021. The rates are more stable, ranging from 4.94 percent to 7.50 percent which suggests a consistently lower level of mortality. Human damage in the southeast region initiates at 36.2 percent in Quarter 4 2020 and reaches a peak of 42.9 percent in Quarter 2 2022. While fluctuations are present, the overall trend is less pronounced than that observed in the south-south region, indicating a more stable pattern. Finally, the case fatality rate in the southeast region is generally lower and more consistent, starting at 15.4 percent in Quarter 4 2020, peaking at 17.5 percent in Quarter 4 2021, and decreasing to 13.7 percent by Quarter 1 2023, reflecting a more stable yet lower level of fatality per case compared to the south-south Region. The research outcome infers that a combination of greater RTC involvement and possibly more severe crash circumstances can be blamed for the higher death rates in the south-south region. The high number of people involved is associated with greater casualty rates, particularly in Quarter 1 2021 when a high mortality rate (11.7%) is accompanied by a notable number of serious casualties (148). Perhaps stronger emergency response systems, less severe crash conditions, or more effective road safety measures may have accounted for the southeast region’s lower death rates. For instance, even though 1,759 individuals got involved in RTC in Quarter 1 2021, their death rates were relatively lower (7.1%).
Analyse Phase
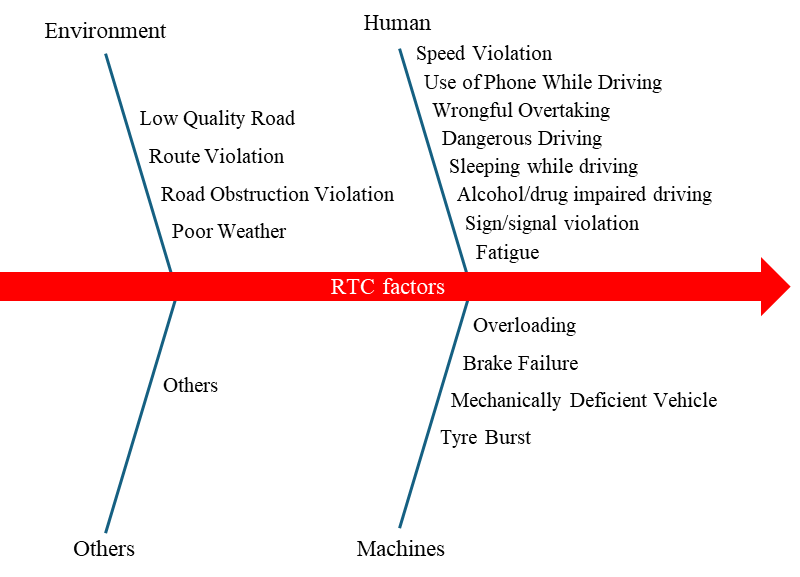
It is important to identify factors that contributed to RTC design improvement and subsequent control. Thus, in this phase, the cause-and-effect diagram, otherwise known as the Ishikawa (Fishbone) diagram (Figure 5) was used to uncover the root causes of RTC across the two regions. This involved interviews and brainstorming sessions between the research team and selected personnel of the Federal Road Safety (FRSC) of Nigeria in the two regions. Based on the responses of the FRSC officials, the causative factors of RTC were classified (human, environment, machine and other). After determining these factors, a detailed analysis was conducted using statistical comparisons across the two regions to verify the root cause and the degree of causative factor of RTC occurrence as summarised in Table 4.
.png)
Overall, the classification of these factors is in accordance with the Federal Road Safety Cooperation of Nigeria (FRSCN) and National Bureau of Statistics (NBS) classification. During the study period, a total of 17 causative factors were identified in the RTC data including some factors with similar, but distinct definitions including:
-
Wrongful Overtaking: specifically rule violations during overtaking
-
Dangerous Driving: encompassed a broad range of behaviours (e.g., pulling of stunts)
-
Dangerous Overtaking: action during overtaking that directly endangered the safety of the driver and passenger
-
Road Obstruction Violation: blocking or hindering traffic flow.
-
Mechanically deficient vehicle: A mechanically deficient vehicle risks the driver and road users due to defects from poor maintenance, wear, or manufacturing faults. Such defects compromise road standards, reliability, and safety.
-
Brake failure: failure refers to a vehicle’s braking system’s inability to adequately stop or decelerate the vehicle. This failure typically arises from issues such as worn brake pads, brake fluid leaks, or overheating. Common warning signs include reduced braking effectiveness, which can create difficulty in stopping the vehicle
-
Tyre burst: Is characterised by a sudden loss of air pressure in a tire, often resulting from inadequate inflation, wear, or excessive heat. This phenomenon can impair steering and lead to a loss of vehicle control, particularly at elevated speeds
-
-
Route violation: unauthorised use of roads
The top three factors were speed violation, brake failure and traffic sign/signal violation. These three causative factors accounted for the majority (68.6%) of all reported crashes in the two study regions. The most frequent of the three was speed violations, reported in over half the crashes in the south-south region (56.3%) and over a third in the south-east region (37.5%), highlighting the need for public awareness campaigns to promote responsible driving and long-term traffic calming measures such as lower speed limits and improved road designs in high-risk areas. The next two causative factors were Brake Failure and Traffic Sign/Signal Violation. Greater attention the roadworthiness of motor vehicles in Nigeria is needed as Brake Failure was the second most frequently reported causative factor in total and in the southeast region (14.8%), although the third most frequent in south-south (7.0%), emphasising the need for regular brake inspections and the adoption of advanced braking technologies such as ABS to improve vehicle safety. Traffic Sign/Signal Violation was the second most frequent causative factor in south-south region (8.7%) and third in southeast (12.4%), calling for enhanced traffic signal visibility and placement and automated enforcement systems such as red-light cameras.
The other factors were reported for a third of the total crashes (31.3%), with slightly more in the southeast region (35.3%) than the south-south region (28.0%). Again, the roadworthiness of motor vehicles in Nigeria is highlighted with the frequency of burst tyres reported as a causative factors in crashes in both the south-south (5.8%) and the southeast region (7.4%). This suggests a lack of awareness of the dangers of worn tyres and the need for community education. Further, regulatory responses could include routine tyre inspections that specify minimum requirements for tyre quality and trend depth. Route violations were reported as a causative factor in almost 100 crashes in each region (south-south: 93, 3.4%; southeast: 101, 4.3%). This is likely to be due to drivers making wrong turns or confusion about permitted access and needs to be addressed with improved road signage and advanced traffic management systems. While dangerous driving was relatively infrequent compared to other behaviours (south-south: 3.5%; southeast: 3.8%), it indicates that there may be a need for penalties for reckless overtaking and driver training programs focusing on hazard recognition and risk assessment. The roadworthiness of motor vehicles is reported again with Mechanically Deficient Vehicles a causative factor in the south-south (2.6%) and southeast region (1.9%), reinforcing the need for mandatory vehicle inspections and maintenance awareness programs to ensure vehicles are safe.
The remaining factors were reported in fewer than 2 percent of crashes. However, countermeasures for some of the factors are well-established. In particular, strengthening DUI laws, imposing stricter penalties, and increasing public education campaigns on the risks of impaired driving remain crucial. While implementing mandatory rest breaks for long-distance drivers and fatigue detection systems in commercial vehicles can help reduce fatigue-related crashes.
Overall, the findings emphasize the necessity for region-specific interventions, including stricter law enforcement, enhanced vehicle inspection programs, and targeted public education campaigns, ensuring a data-driven approach to mitigating RTC risks effectively (see Figure 6 and Figure 7).
_for_the_south-south.png)
_for_the_southeast.png)
Improve Phase
The goal of the improve phase in the DMAIC principle is to detail the action needed to reduce the occurrence of each causative factor identified as contributing to the RTC. Following the crash analysis above, Table 5 presents improvement measures, both short term and long term, for the causative factors in the RTC during the study period.
Control Phase
The control phase is intended to implement long-term improvements. Implementing the improvement measures outlined in the studied regions is likely to result in a significant reduction in RTC. Furthermore, as previously mentioned by Umit and Ali (2017), monitoring the implemented improvements and conducting regular meetings to analyse the likely causes of the increase in the number of crashes, as well as adopting the required preventive measures is important.
Discussion and Conclusions
The continuous economic progression of Nigeria has brought about significant transformations, in both transportation modes and lifestyles. Private motor vehicle ownership has dramatically increased with a concurrent increase in road traffic crashes and casualties. This calls for the implementation of stricter vehicle standards and effective traffic safety laws that will address these challenges.
The results of this study showed that the south-south region experienced a higher number of crashes than the southeast region, with serious cases making up more than half the RTC in both regions. However, while both regions experienced peaks in serious cases, the times these peaks occurred varied. These differing peak intervals may be attributed to economic inequality which could lead to varying investments in road designs, and traffic infrastructures across each region. The above analysis suggests that there is a statistically significant difference in the severity of MRP, HD, and CFR between the two regions. The south-south region consistently showed higher values for all variables than the southeast region. To further reduce the incidence and mortality of RTC in the regions, collaboration efforts are needed to improve the quality of roads, increase enforcement, modernise the motor vehicle fleet and increase education for drivers across all social strata on the importance of safe driving behaviours.
Further analysis on the root causes of RTC using the Ishikawa diagram (Figure 5), revealed speed violation was a significant factor across the two regions. High-risk behaviour such as exceeding the speed limit is often associated with greater severity of casualties in the event of RTC (Sae-Tae et al., 2020). Also, our findings, reveal lower values for incidences of drink driving (e.g., southeast region) relative to other traffic violations, this is because drink driving has been criminalised in Nigeria as in many other countries (Gaoqiang et al., 2020) and driving with a blood alcohol content above 0.05 is a criminal offence. However, greater enforcement is needed to continue to gain the benefits that are possible through the BAC restriction. Further, stricter traffic laws targeting drug prohibition and unsafe behaviours need to be further strengthened to curb drugged driving.
Lastly, while some improvement measures (Table 5) have been suggested to prevent crashes, to improve the health outcomes for individuals who are involved in RTC, it is important to provide effective post-crash medical care. There is an urgent need to establish a strong trauma-response system and emergency care network across regions, with trained medical staff to provide care for people injured in RTC (Tian-Jing et al., 2021). Timely, critical care at the crash location will improve an injured person’s likelihood of survival until they are able to access full hospital medical care.
Study Contribution and Limitations
The strength of this study lies in its methodology. The study utilised the Define, Measure, Analyse, Improve, and Control (DMAIC) approach of Six Sigma to investigate the trends and causative factors of RTC. The integration of this approach is rare and forms the novelty of this research and offers a structured framework for analysing complex systems like road safety. Beyond the study’s contribution and findings, the following key limitations should be considered while interpreting the study findings. First, despite the data size used, the rates of RTC injuries and casualties were estimated based on the number of crash cases and population impacted across the two regions. This is most likely to impact the precision of our estimates relative to other studies. Lastly, the study only assessed driver-related, machines, and environmental-related critical risk factors of RTC and did not explore other socio-demographic differentials. Subsequent research could extend the study to other regions in the country and the timeframe and explore the relationship between deaths and other regional performance metrics.
Acknowledgements
The authors wish to thank the National Bureau of Statistics (NBS) and the Federal Road Safety Command (FRSC) of Nigeria, for providing us with the needed data and information.
Authors contributions
OII and MIO contributed to data analysis and manuscript writing, FIA and SOE contributed to the data collection and manuscript revision. OOJ contributed to data collection and preparation. All authors have read and agreed to the published version of the manuscript.
Conflict of interest
The authors declare that they have no known competing financial interests or personal relationships that could have appeared to influence the work reported in this paper.
Data availability statement
Data used for this study are available online and can be accessed from the corresponding author.