
Introduction
Traffic crashes are one of the biggest public health problems in the world. Every year, almost 1.2 million people die and 20-50 million people are injured (WHO, 2023a). Traffic crashes are also a major burden on the health system (Ghasem et al., 2013). This is greater in some regions of the world, for example, the global rate of death and injury per 10,000 motor vehicles is 3, while the rate in Iran is 33 (Ghasem et al., 2013; Khoshakhlagh et al., 2019).
According to World Health Organization (WHO), road crashes were forecast to increase to become the seventh leading cause of death by 2030 (WHO, 2015). However, in the Kingdom of Saudi Arabia (KSA), road traffic crashes are already the second leading cause of death and have been the leading cause of injury since 2000 (Alslamah et al., 2023; WHO, n.d.). The rate of traffic crashes in the KSA is a result of not paying attention to safety principles. In 2018, the global status of road safety report identified the KSA as having the highest rate of road traffic crash deaths among high-income countries (HICs) (Alslamah et al., 2023). This is evidenced in the rate of deaths from road crashes per 100,000 population. In 2021, the rate in the KSA was 25.9 (WHO, n.d.) compared to 12.9 in the United States of America, 4.5 in Australia (WHO, 2021).
Preventing road crashes is a global priority and the WHO has set the aim to halve the number of deaths and serious injuries by 2030 (WHO, 2023b). To reach this target, it is critical to understand the main contributing factors. Finding the cause and determining the important factors affecting traffic crashes and determining their role can be a suitable basis for providing solutions aimed at preventing and reducing traffic crashes (Crizzle et al., 2017). Action is needed from the relevant institutions such as the Ministry of Transport and Logistic Services and the traffic police. In general, the main factors affecting traffic crashes are connected to each other in a chain that can be divided into four groups: road (geometry, traffic flow), vehicles (capability, roadworthiness), human factors (driver characteristics, behaviour, physiological and psychological abilities) and the environment (atmospheric conditions) (Alslamah et al., 2023; Crizzle et al., 2017; Khoshakhlagh & Ghasemi, 2017; Shappell & Wiegmann, 2013)).
Road conditions, particularly geographic location is another important factor in the analysis of road crashes. In a study conducted by Theofilatos et al. (2012), the parameters influencing crash severity inside and outside urban areas were investigated. Parameters influencing the severity of road crashes inside of the city were young drivers, intersections, and crashes with fixed objects, and bicycles whereas parameters influencing severity outside of the city were weather conditions, head-on and side crashes.
There is extensive literature on human factor characteristics. Research shows that gender is an important factor with males overrepresented in crashes, accounting for over two thirds of the injured (68%) compared to females (32%) (Zamani et al., 2014). Age is another important factor. The WHO classification divides the age of injured road users into four groups: children, up to 12 years old; youth, 13-17 years; adults, 18-59 years, and; elderly, 60 years and older (WHO, 2009). Crash trauma is more frequent in youth and adults accounting for the majority of injured road users (73%) (Victorino et al., 2003; Zhang et al., 1998). Crash involvement of young drivers is often attributed to inexperience (Bucsuházy et al., 2020). While elderly drivers are involved in a smaller proportion of crashes, increased physical fragility means a higher likelihood of a fatal outcome (Azami-Aghdash et al., 2018; Khoshakhlagh et al., 2017).
Research on vehicles has identified that car size and weight can influence occupant safety. Based on reports, light trucks and vans (LTVs) may be safer in crashes involving smaller cars, but less safe in single-vehicle crashes with fixed objects due to the greater strength of LTVs (Ulfarsson & Mannering, 2004).
The aim of this study was to investigate the role of factors affecting the consequences of traffic crashes in the Kingdom of Saudi Arabia (KSA).
Methods
This retrospective study was an analysis of crash data from 2019 to 2020 in the Kingdom of Saudi Arabia (KSA). The inclusion criteria were crashes that involved: a road user with a driving certificate, aged 18 years or older, citizen of KSA, crash occurred in cities of the KSA that recorded damages, injuries or death due to traffic crash in the KSA, and traffic crash due to violations in the KSA. All crash events that met the inclusion criteria were included in the study. The exclusion criteria were incomplete data on key study parameters including: age, gender, location, education level, crash time, and crash consequences.
Data collection
Data were extracted from the National Open Data Portal which permits access and extraction for analysis of the data of ministries and government agencies in the KSA (AlRushaid & Saudagar, 2016). The available data on crash consequences included: crash outcome (property damages, injury, death), age (<30 years, 30-50 years, >50 years), gender (male, female), location (inside the city, outside the city), education level (educated, illiterate), crash time (day, night), and vehicle type (private, heavy vehicle, motorcycle), and violation type. Also, of these variables, the probable factors that may can influence the crash consequences were selected for inclusion in the Bayesian network modelling.
Bayesian network modelling
Bayesian network modelling was used the analytical model in this study. This analytical method is used in various domains, including safety, healthcare, and decision support systems. Bayesian networks are an innovative approach that employs probabilities to express uncertainties and utilise probabilistic rules for learning and inference (Mittal & Kassim, 2007) that are capable of reasoning in uncertain conditions and enables models to be constructed using incomplete or qualitative data (Chen et al., 2013). These networks graphically depict random variables along with their conditional dependencies. They are particularly adept at evaluating an event to determine the probability that it was caused by any one of several potential factors (Scanagatta et al., 2019).
Statistical analysis
Statistical tests and descriptive statistics were carried out using Microsoft Excel. GeNIe academic software version 2.3 was used to analyse the Bayesian network. In the drawn model in this software, for these divisions, the five variables of age, gender, education, crash time, and crash location were directly connected to the outcome variable of crash consequences by means of directional lines. Incomplete and underreported data can lead to information loss, diminish the effectiveness of statistical tests, and introduce biases into research findings (Demissie et al., 2003). Consequently, in the current investigation, the Expectation-Maximization (EN) algorithm for Bayesian network parameter estimation in the context of road traffic crashes was employed. The EM algorithm serves as a deterministic estimation technique that operates asymptotically and it is ideal for estimating unknown parameters in situations where data may be missing or underreported. This method facilitates the execution of maximum likelihood estimations on incomplete datasets, making it a practical learning algorithm (Pilla & Lindsay, 2001).
After drawing the topological structure of the Bayesian network, a Conditional Probability Table (CPT) was obtained by the model with the Expectation-Maximization algorithm (Liu et al., 2015). Then, delta p sensitivity analysis was applied to examine the effects of the variables (Mohammadfam et al., 2017). For performing sensitivity analysis, the probability of one of the categories in selected variables was considered as 100 percent and variations of crash consequences were reported. The categories included age, gender, location, education level, crash time, and crash consequences. Sensitivity analysis of all possible states as one variable and a combination of variables were examined. Finally, a 10-fold cross-validation analysis was exploited to examine the model’s validity. The dataset was randomly divided into ten folds, nine folds (9 subsamples) were applied to train the Bayesian network model, and the remaining fold (1 subsample) was used to validate the model (Cao et al., 2019). In the GeNIe software, these probabilities, based on the mentioned divisions, must be entered in Bayesian network analysis.
Results
From 2019 to 2020, a total of 68,843 people were involved in traffic crashes in the Kingdom of Saudi Arabia (KSA). Among them, 58,471 cases had the consequences of damages and injuries and 10,372 cases with the consequence of deaths. More crashes occurred in 2019 (32,910, damages and injuries; 5,754 deaths) compared to 2020 (25,561, damages and injuries; 4,618 deaths). It is likely that the restrictions related to the pandemic impacted the number of crashes in 2020. Table 1 represents the statistical distribution of other studied variables.
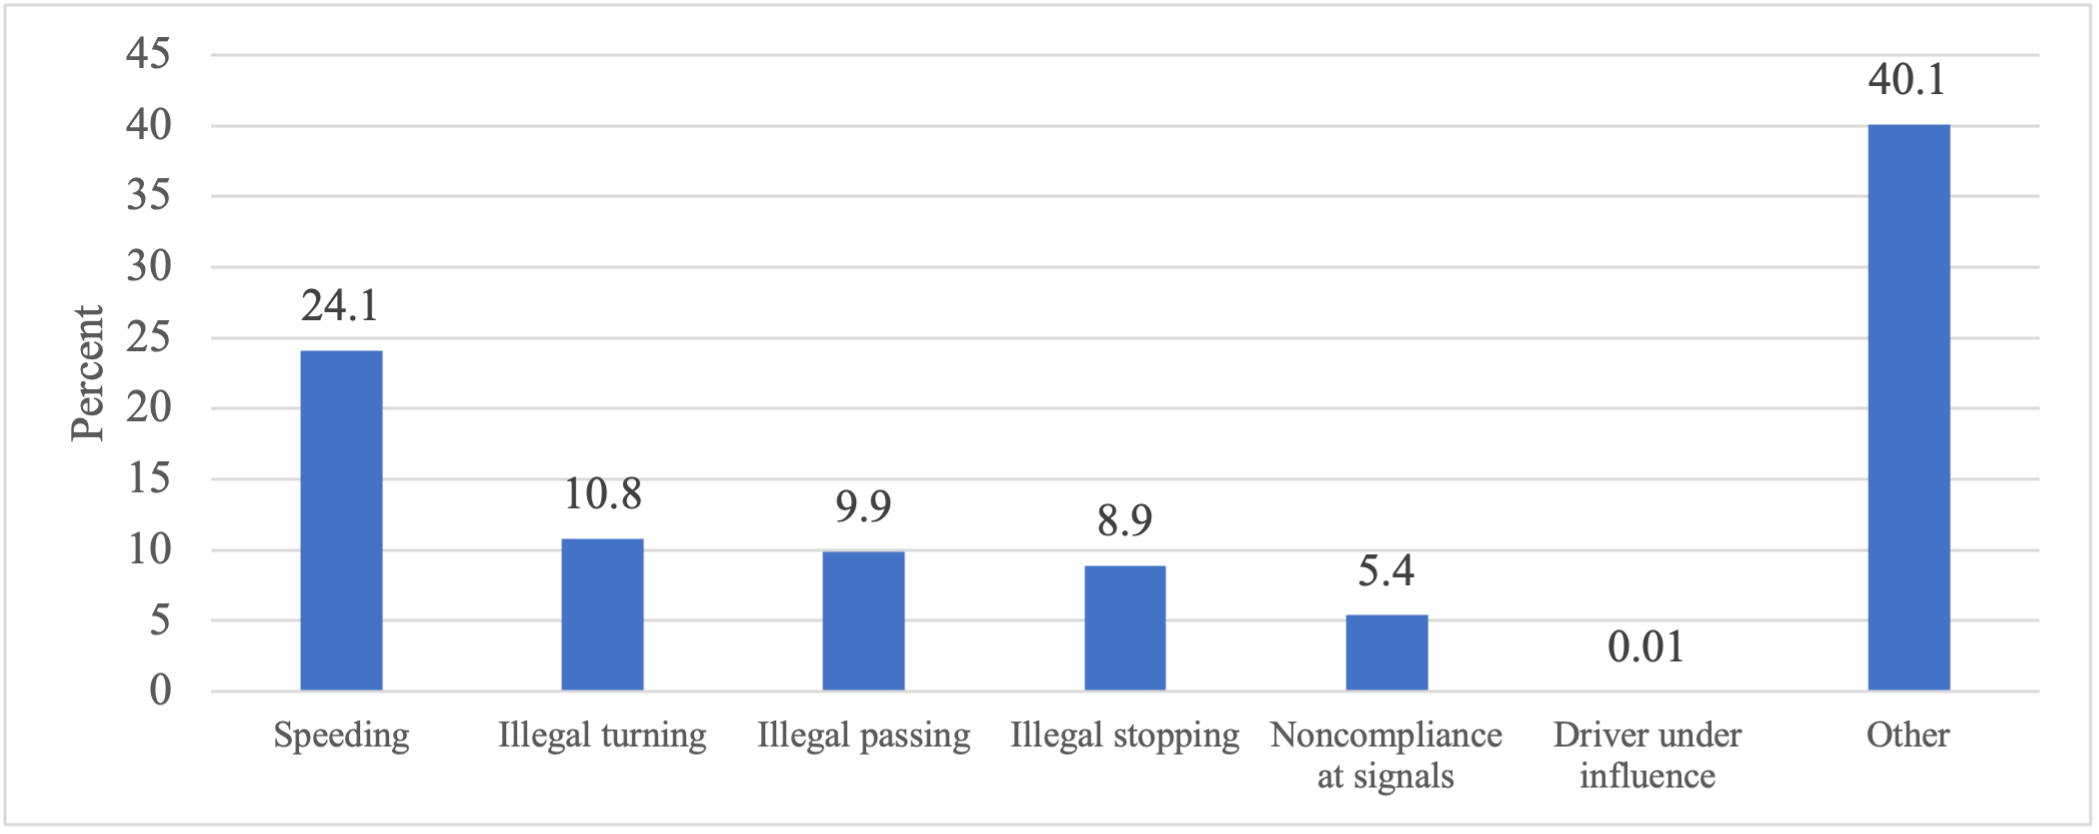
Figure 1 shows the violation type reported for the included crashes. The highest single violation types were: speeding (24.1%) and illegal turning (10.8%) which involved a driver turning left or right at an intersection when prohibited. Other violations included passing at a location when prohibited (illegal passing, 9.9%), stopping in a location when prohibited (illegal stopping 8.9%), noncompliance at traffic signals (5.4%) and driving while under the influence (0.01%). The category Other (40.1%) includes a combination of multiple violations.

Regarding the crash consequences, fatal outcomes accounted for 15 percent of crashes with injury and property damage the outcome for the majority of crashes (84.9%). Table 2 presents the Conditional Probability Table (CPT) for crash consequences. This table was used to draw the model in the Bayesian network modelling process. First, the crashes were divided into three groups, starting with age. Second, each age group was categorised by gender. Third, each group was divided by education level. Fourth, the crash data were further sub-divided by day and time, then by crash location. Lastly, the probability of the outcome (fatal, injury, property damage) in each division was computed based on the frequency distribution of crash records. For example, the probability of the crash outcome for females under 30 years who were educated, for crashes that occurred during the day and inside the city were 0.11 (death) or 0.89 (injury and/or property damage).
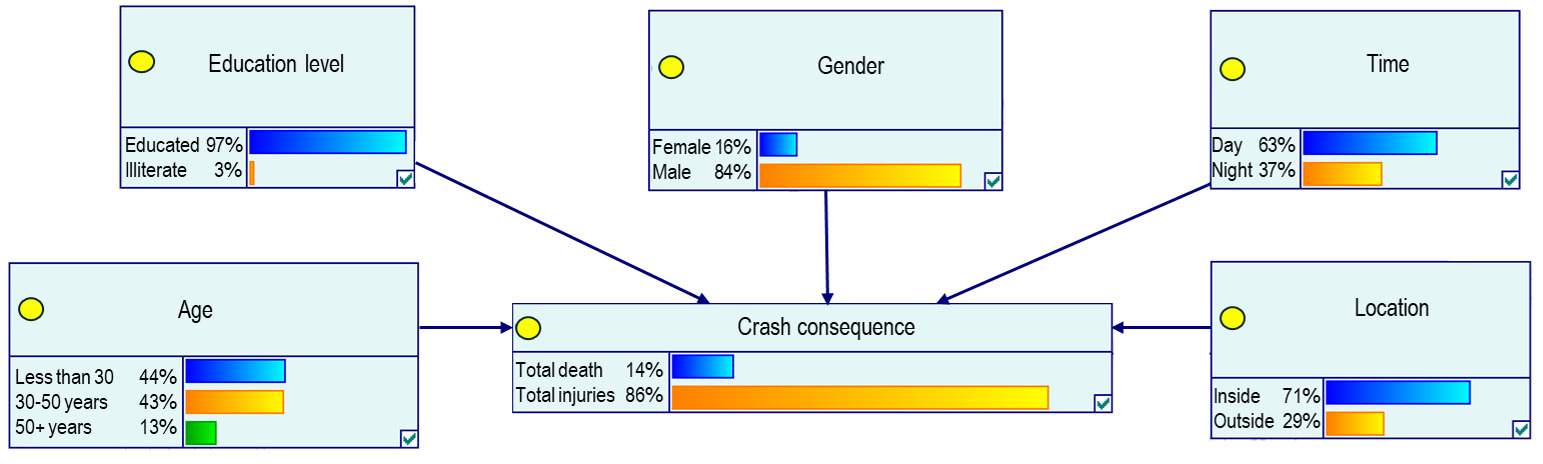
Figure 2 depicts the dependencies among the marginal probabilities of the studied variables based on the Bayesian network model.
In the sensitivity analysis of univariate states, each factor was analysed to determine the probability of death given a 100 percent distribution with variation among each factor. The probability level of educated people did not change while for illiterate people, the probability of death increased by 2 percent. The probability of death decreased by 2 percent for females while the probability of death did not change for males. For time of day, the probability of death decreased by 1 percent in the daytime and increased by 1 percent at nighttime. There was a variation within the age category. While the probability of death did not change for individuals under 30 years, it decreased by 1 percent for people with age between 31 to 50 years and increased by 2 percent for people older than 50 years. The greatest variation was by location where the probability of the death decreased by 3 percent for crashes in the city and increased by 7 percent for crashes that occurred outside the city.
In the sensitivity analysis of multivariate states, the greatest decrease in the probability of deaths was observed by 4 percent in 4 conditions. Those included the distribution of 100 percent of: 31-50 year old, female, educated, daytime and inside the city; 31-50 year old, female, illiterate, daytime and inside the city; <30 years, males, educated, daytime and inside the city, and; 31-50 years, males, educated, daytime and inside the city. The greatest increase in the probability of deaths related to three conditions. Those included the distribution of 100 percent of: males, >50 years, educated, nighttime and outside the city (13%); males, <30 years, illiterate, nighttime and outside the city (15%), and; males, >50 years, illiterate, nighttime and outside the city (13%).
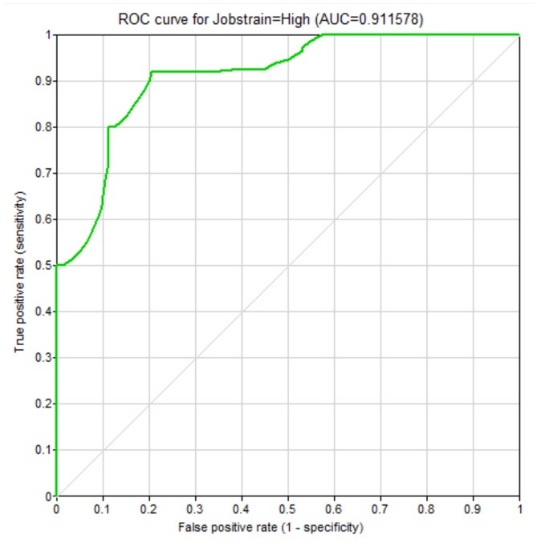
Figure 3 is the ROC curve drawn to evaluate the validity of the fitted Bayesian model. The area under the curve was equal to 0.912. The values of the sensitivity, specificity, and accuracy of the model were computed by 0.900, 0.800, and 0.857, respectively.

Discussion
In this study, the affective factors including age, gender, education level, location, and time of the day on the consequences due to traffic crashes were investigated.
Most variation in crash consequences was related to outside location with an increase in the probability of death (7%). Increases were also identified for other variables including: age (>50 years, 2%), education level (illiterate 2%), time (night time 1%). While a decrease in the probability of death was calculated for: age (31-50 years, 1%), gender (female 2%), time (daytime 1%) and location (inside the city, 3%). In the sensitivity analysis of multivariate states, the greatest increase in the probability of deaths was related to two states: <30 years, male, educated, night time and outside the city (15%) and >50 years, male, illiterate, night time, outside of the city (13%). In the first degree, these findings show the importance of two variables of location and time compared to other variables that have more determinant roles in both univariate and multivariate states. In the second degree, based on the results, other variables, including gender, age, and education level can affect crash consequences.
Studies have reported that the probability of mortality higher on the roads outside the city than on the roads inside the city identifying contributing factors including lack of well-built roads and lack of parking (Hatamabadi et al., 2012; Soori et al., 2013; Taravatmanesh et al., 2018). A study in Greece investigated the parameters influencing crash severity inside and outside urban regions. Factors that contributed to crashes that occurred in urban areas were: young drivers, bicycles, intersections, and collisions with fixed objects. While factors outside urban regions were weather conditions, head-on and side collisions (Theofilatos et al., 2012). Eboli et al (2020) developed a logistic regression method to identify factors influencing crash severity and outside urban areas was found to be significant, which is consistent with the results of the present study. While weather may be a factor in some countries, it is not as likely in the KSA as inclement weather is common and research has shown people drive more attentively and more slowly in inclement weather (Islam et al., 2019; Theofilatos et al., 2012).
The time the crash occurred was important as nighttime was shown in this study to increase the probability of crash-related deaths which is consistent with previous research (Lam, 2004). While the circumstances were not able to be explored in this study, previous research has identified that nighttime crashes may involve a reduction in poor visual acuity and other vision related issues for the driver (Alakija, 1981; Lam, 2004; Maag et al., 1997). Male drivers had higher rates of crashes in the dark, and previous research suggests this could be related to levels of risk taking in very unfavourable situations (such as dark or foggy situations) or that female drivers drive more cautiously or may not drive at all (Al-Balbissi, 2003; Amarasingha & Dissanayake, 2014). The association between gender and crashes is complex and may be a function of exposure as in many countries, males drive greater distances than females (Li et al., 1998). Further, males, including when driving, have the highest risk-taking and sensation-seeking tendencies (Tsai et al., 2008).
The literacy or education of the people has been considered differently in causing crashes, as some studies show that education has a direct relationship with the severity of crashes, and some have an inverse relationship. Shahbazi et al. (2019) showed a correlation between higher education levels and lower death rates compared to road users with lower levels of education. In a study in Iran, Khorasani-Zavareh et al. (2009), showed that following crashes, drivers with low education (illiterate and up to grade eight) died from the injuries moderately more often than those with higher education levels. Some studies have suggested that low levels of education may be a predictor for risky driving behaviours (Hassen et al., 2011; Males, 2009). However, Mohammadzadeh and Akbari (2012), stated that people with high or medium levels of education were at higher risk of crashes due to higher risk-taking. In a study in Iran by Montazeri (2004), the majority of people killed in road traffic crash deaths (81%) had a pre-university education.
Study limitations
The main challenges in this study related to the use of the national database, in particular, underreporting and missing data. This problem is not specific to a region. The WHO estimates that globally, road traffic injuries are likely to be underestimated (WHO, 2013). Earlier research by Barrimah et al. (2012) investigated the epidemiology of road traffic injuries within the Qassim region of the KSA and determined that the mortality rate due to road traffic incidents was nearly double that reported by police authorities. Other researchers have reported comparable gaps in crash reporting including discrepancies between hospital and police reported data in Scotland (Jeffrey et al., 2009) and low police reported rates in Hong Kong (Loo & Tsui, 2007). Various factors contribute to the underreporting of road traffic injuries. In some cases, incidents are neither reported nor recorded because individuals deem them too minor or unnecessary to report (Dandona et al., 2008). Additionally, there may be a tendency for some road traffic authorities to underreport crash statistics to avoid criticism from superiors and meet declining targets (McDonald et al., 2009).
To address the data limitation in the present study, the Bayesian network and the Expectation-Maximization (EM) algorithm were employed to analyse data that were incomplete. Changes to KSA data with the adoption of a multisectoral strategy holds promise for enhancing the accuracy of information regarding traffic-related injuries and fatalities in the KSA. In 2009, Indonesia implemented such a strategy to tackle the issue of unreported traffic deaths with authorities enacting legislation that enabled data to be gathered from diverse sources, including insurance companies and medical facilities, with the goal of a more precise assessment of traffic-related mortality rates. After this change, the traffic death estimates for 2010 indicated an increase of over 10,000 compared to the previous year, which can be attributed to the enhanced quality of data (Chan & WHO, 2013).
Conclusion
Based on the results of this study, two variables (i.e., location and time) have more determinant roles in the crash consequences compared to other variables. However, other variables, including gender, age, and education level can also affect crash consequences. The results also showed that a combination of variables has more effects than a single variable on increasing or decreasing consequences due to traffic crashes. Accordingly, it is essential to carry out preventive policies that focus on the combination of these variables. For example, stricter regulations and supervision can be adopted for the worst conditions based on the mentioned factors. There are other factors affecting crash consequences, such as mental health status, jobs, diseases, and alcohol and drug consumption, that were not entered into the present study because of a lack of records in the KSA open data portal. Therefore, it is suggested that the role of these factors is also investigated in the next studies and that the information on these factors is recorded in the KSA open data portal.
Data availability statement
The data is available from the corresponding author on reasonable request.
Human Research Ethics Review
Crash data used in this study were extracted from the National Open Data Portal which permits access and extraction for analysis of the data of ministries and government agencies in the KSA. The study was conducted in accordance with the Declaration of Helsinki.
Conflicts of interest
The author declares no conflicts of interest.